1112 Morfontaine St · Daytona Beach, FL
Flood risk No data
- FEMA flood zone
- —
- Chance of flooding over 30 yrs
- —
- Est. flood insurance / yr
- —
Fire risk No data
- Est. fire insurance / yr
- —
Heat risk No data
- Hot days now (above threshold)
- —
- Hot days in 30 yrs
- —
Wind risk No data
- Chance of severe wind over 30 yrs
- —
Air-quality risk No data
- Unhealthy air days now
- —
- Unhealthy air days in 30 yrs
- —
Risk factors via First Street. Map © Google.
Why this score? — see what drove the D grade
The composite is a weighted blend of 9 inputs, each scored 0–100. Each bar is that input's sub-score; the figure is the points it added to the 100-point composite (weight × sub-score).
- Cash flow +9.0/30.0
- ARV discount +7.5/15.0
- Livability +4.2/5.0
- Appreciation +4.0/10.0
- Rent growth +3.9/5.0
- Schools +3.9/10.0
- 1% rule +2.8/10.0
- DSCR +2.5/10.0
- Condition / age +2.5/5.0
$431,990
🖨 Deal sheet (PDF) 📄 Offer letter ✓ Due diligence
Listing remarks
The property is located at 1112 Morfontaine Street DAYTONA BEACH FL 32124 priced at 431990, the square foot and stories are 2336, 1.The number of bath is 3, halfbath is 0 there are 4 bedrooms and 3 garages. For more details please, call or email.
Key facts
- 3 garage spots
- Built 2026
- Listed 38 days
Property features AI
Finance
- Financial info: List price $431,990
Exterior
- Parking: 3 parking spaces; 3-car garage
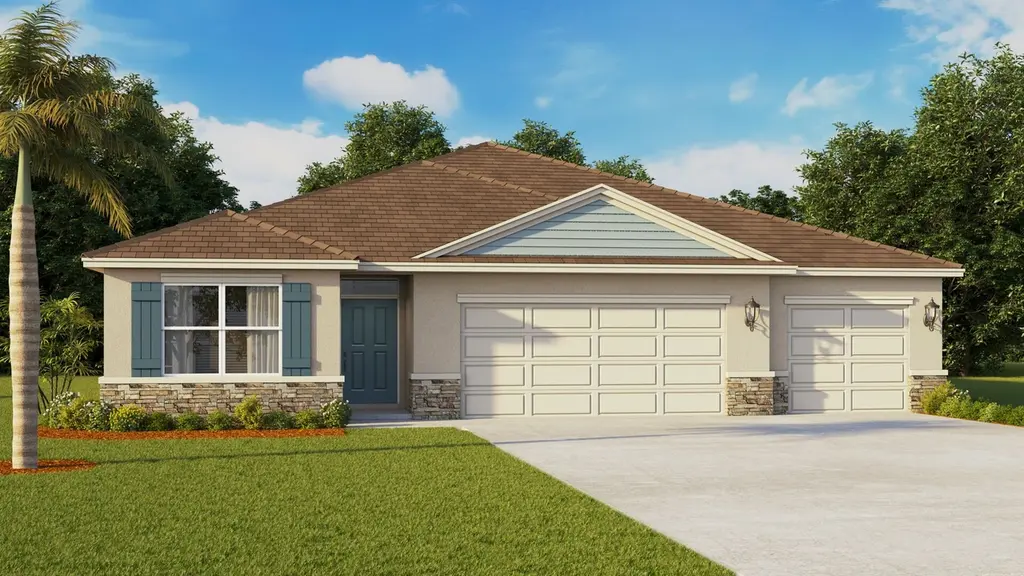
- Home design: Single-family home (Denham plan)
- Exterior features: Living area approximately 2,336
Interior
- Bedrooms: 4 bedrooms
- Bathrooms: 3 full bathrooms
- Interior features: Spec new construction, Denham plan
Neighborhood map
What this means for you Summary
Snapshot
- This is a 4-bed/3.0-bath single-family listed at $432k.
Deal economics
- At list price, monthly cash flow is $-338 ($-4k/yr) — negative.
- To cash-flow at today's rent, offer at most $383k (11.3% below list).
- To meet the 1% rule (rent ≥ 1% of price), the offer needs to be $335k (22.4% below list).
- Recommended offer: $335k (22.4% below list) — sets the bar for 1% rule.
Location & tenants
- Location reads 83/100 on livability (#46 in FL, #867 nationally) — a professional / high-income tenant draw. Strengths: amenities A+, commute A+, cost of living A+; Watch: employment D-.
- Volusia (suburban): math 44% / reading 49% proficiency, ranked #47 of 73 in FL (top 64%) — families likely to look elsewhere, expect single-tenant / working-renter base with shorter leases.
- Zoned schools: Champion Elementary School (math 39% / reading 44%, grade F, #1,437 of 2,144 statewide, top 68%, 584 students, 70% FRL); David C. Hinson Sr. Middle School (math 52% / reading 49%, grade C, #246 of 571 statewide, top 44%, 950 students, 52% FRL); Mainland High School (math 30% / reading 37%, grade F, #400 of 667 statewide, top 61%, 1,855 students, 64% FRL).
- Market conditions: Rents rising fast (+5.5%/yr); 335 active listings in the ZIP; 7 comparable units currently listed for rent nearby; rentals at typical pace (median 23d on market — plan ~3-4 weeks tenant-placement turnaround); solid renter incomes; 3,402 units permitted in Volusia County in 2024 (681 in 5+ unit buildings).
- This rent runs 43% of the median local income ($93k/yr) — at the standard rent-burdened threshold; future hikes will face affordability resistance.
Forward outlook
- Local home prices are declining (-2.0%/yr); year-one equity from $3k of loan paydown is wiped out by about $9k of value loss. Plan a longer hold.
- Volusia County population projected at +19% by 2050 — long-run rental-demand tailwind backs the buy-and-hold thesis.
Negotiation context
- It's been on market 38 days — a 3% lower offer ($419k) is reasonable based on typical stale-listing flexibility.
Questions for the listing agent
- What do current leases actually rent for vs. the listed asking? Can we see a recent rent roll and the last 12 months of T-12 income?
- It's been on market 38 days. Have you received any prior offers? Is the seller open to a 22% concession, seller financing, or rate buy-down credit?
- Is there a deadline driving the sale (1031 exchange, divorce, estate, relocation)? That informs how much negotiation room exists.
- Schools are D-rated, which usually means shorter tenancies and higher turnover. Who's the typical renter profile here, and what's been the actual vacancy rate?
- The area grade is low — what's the realistic commute time and amenity access for the typical tenant pool here? Any planned neighborhood developments (good or bad) we should know about?
- What's the average days-on-market for RENTAL listings here right now (not sales)? A rising rental-DOM trend means longer vacancies and softer asking-rent achievability than the comps imply.
- What's the recent tenant-quality profile in this submarket — average credit score on applications, eviction rate, late-payment / NSF rate, and stable-employment percentage? A property-management company in the area should have these aggregated.
- How much new for-sale + rental construction is in the pipeline within 1–3 miles? Heavy new supply typically softens prices + rents 12–24 months out; constrained supply supports both.
Investment metrics
- 1% rule
- 0.78% ✗
- Cap rate
- 5.35%
- Cash-on-cash
- -3.36%
- DSCR
- 0.85
- GRM
- 10.7
CMA / ARV
No comps found within radius.
Projected returns pro-forma
-1.99% appreciation · 5.46% rent growth · sell at horizon
- IRR
- -13.3%
- Equity multiple
- 0.47×
- Total profit
- $-64,489
- Equity at exit
- $84,115
- IRR
- -2.9%
- Equity multiple
- 0.75×
- Total profit
- $-30,513
- Equity at exit
- $72,090
Cash invested: $120,957 (down + closing). Projections, not guarantees.
Landlord ↔ Tenant lean methodology
- Overall (STATE)
- 87 Strongly Landlord-Friendly
- State Florida
- 87 Strongly Landlord-Friendly · R+3
- County
- — inherits STATE
- City
- — inherits STATE
ZIP-level market 32124
- Home prices YoY
- -0.6%
- Rents YoY
- 5.5%
- Active inventory
- 335
- Price-to-rent
- 10.7×
Monthly cashflow live
- Estimated rent
- $3,351 high interval (Pro) →
- Mortgage (P&I)
- −$2,265
- Tax est. 1.5%
- −$540 /mo · $6,480/yr
- Insurance
- −$180
- HOA
- −$0
- Vacancy / Maint / Mgmt
- −$704
- Net cashflow
- $-338
Break-even live
Sensitivity live
| Price | -10% $-40 | -5% $-189 | +0% $-338 | +5% $-488 | +10% $-637 |
|---|---|---|---|---|---|
| Rent | -10% $-603 | -5% $-471 | +0% $-338 | +5% $-206 | +10% $-74 |
| Rate | -1.0pp $-121 | -0.5pp $-229 | base $-338 | +0.5pp $-450 | +1.0pp $-564 |
UW: 25.0% down · 7.5% · 30yr · 1.5% tax · 5.0% vac · 8.0% maint · 8.0% mgmt
Financing live
Cash to close
- Down payment
- $107,998
- Closing costs
- $12,960
- Reserves months
- —
- Total cash needed
- —
Loan-product check · same deal, 3 products live
Conventional
25% down · 7.5% · 30yr
- Down + closing
- —
- Monthly P&I
- —
- Monthly cashflow
- —
- DSCR
- —
- Eligible?
- —
Personal DTI + credit; lowest rate.
DSCR
20% down · 8.5% · 30yr
- Down + closing
- —
- Monthly P&I
- —
- Monthly cashflow
- —
- DSCR
- —
- Eligible?
- —
No personal income docs; deal must DSCR.
Hard money
10% down · 12.0% · 12mo
- Down + closing
- —
- Monthly P&I
- —
- Monthly cashflow
- —
- DSCR
- —
- Eligible?
- —
Short-term bridge; refi at stabilization.
Rent comps 7 comps
| Address | Beds | Baths | Sqft | Rent | $/sqft | DOM | Units | Dist |
|---|---|---|---|---|---|---|---|---|
| 137 Lost Ball Dr Daytona Beach, FL | 4.0 | 2.5 | 2168 | $2,950 | $1.36 | 13d | 1 | 0.70mi |
| 284 Links Terrace Blvd Daytona Beach, FL | 4.0 | 2.5 | 2200 | $2,850 | $1.30 | 25d | 1 | 0.86mi |
| 604 Champion Ridge Dr Daytona Beach, FL | 3.0 | 2.0 | 1761 | $2,299 | $1.31 | 16d | 1 | 0.87mi |
| 129 Formby Grande Ave Daytona Beach, FL | 5.0 | 4.0 | 3317 | $3,600 | $1.09 | 25d | 1 | 0.95mi |
| 1250 Champions Dr Daytona Beach, FL | 3.0 | 2.0 | 2004 | $2,650 | $1.32 | 25d | 1 | 1.41mi |
| 1203 Cabot Cliffs Dr Daytona Beach, FL | 5.0 | 2.5 | 2355 | $2,750 | $1.17 | 23d | 1 | 1.41mi |
| 1143 Cabot Cliffs Dr Daytona Beach, FL | 5.0 | 2.5 | 2370 | $3,050 | $1.29 | 13d | 1 | 1.47mi |
Listing history 18 events
-
2026-06-22days on market $431,990 Active 38 DOM
-
2026-06-18days on market $431,990 Active 35 DOM
-
2026-06-17days on market $431,990 Active 34 DOM
-
2026-06-16days on market $431,990 Active 33 DOM
-
2026-06-15days on market $431,990 Active 32 DOM
-
2026-06-14days on market $431,990 Active 30 DOM
-
2026-06-10days on market $431,990 Active 27 DOM
-
2026-06-09days on market $431,990 Active 26 DOM
-
2026-06-08days on market $431,990 Active 25 DOM
-
2026-06-07days on market $431,990 Active 24 DOM
-
2026-06-05days on market $431,990 Active 21 DOM
-
2026-06-03days on market $431,990 Active 20 DOM
-
2026-06-03days on market $431,990 Active 19 DOM
-
2026-06-01days on market $431,990 Active 18 DOM
-
2026-05-31days on market $431,990 Active 17 DOM
-
2026-05-31days on market $431,990 Active 16 DOM
-
2026-05-14$431,990 Active 246-char remark
-
2024-12-06soldstatus $11,494,000
ⓘ Source: listings_history table (triggers on properties + properties_extension) + one-shot
backfill from property_details.listing_events for pre-trigger history.
Nearby sold comps map
Loading sold comps map…
Walkable amenities ~0.75 mi
Loading nearby amenities…
Taxation est. · year 1
- Rental income
- $40,206
- − Mortgage interest
- −$24,198
- − Property taxes
- −$6,480
- − Insurance
- −$2,160
- − Repairs & maintenance
- −$3,217
- − Management
- −$3,217
- − Depreciation
- −$12,567
- Taxable loss
- −$11,631
- Est. tax savings @ 24.0%
- +$2,792
- After-tax cash flow
- $-1,270/yr
For passive investors: Depreciation is non-cash, so a rental often shows a tax loss while cash-flowing — sheltering income. Rental losses are passive: they offset passive income freely, and up to $25,000/yr can offset ordinary (W-2) income if you actively participate and your MAGI is under $100k (phasing out to $0 by $150k); unused losses carry forward. On sale, claimed depreciation is recaptured at up to 25%, and gains may owe capital-gains tax (a 1031 exchange can defer both). Figures are a year-1 estimate at your 24.0% rate — not tax advice; consult a CPA.
Schools (NCES district)
- District
- Volusia
- NCES district ID
- 1201920
- Math proficiency
- 44% ▼ -9.00%
- Reading proficiency
- 49% ▼ -3.00%
- Median HH income
- $42,946
- Composite
- 39.2/100
- National rank
- #4019
- State rank
- #47 of 73 in FL
Livability — Daytona Beach
- Score
- 83/100
- State rank
- #46
- US rank
- #867
Category grades
Schools grade is shown separately in the Schools card above.
Census & demographics
- Census place
- Daytona Beach, FL
- County
- Volusia County · 556,871 people
- City population
- 67,539
- Metro
- Deltona-Daytona Beach-Ormond Beach, FL
- Population (ZIP)
- 11,409
- Household income
- $92,616
- Rent vs Own
- Severe rent burden
- 54.0
Population outlook (Volusia County) Hauer SSP2
- Today (2025)
- 572,749 people
- By 2030
- 598,695 · +4.5%
- By 2040
- 644,880 · +12.6%
- By 2050
- 681,451 · +19.0%
- By 2075
- 759,957 · +32.7%
- By 2100
- 778,902 · +36.0%
Race, ethnicity, and origin ACS 2023
- Neighborhood character
- Predominantly White (71%)
- Race & ethnicity
- White 71% Black 20% Hispanic / Latino 5% Asian 2% Two or more races 1%
- Common ancestry
- Romanian 3% Italian 2% Portuguese 1%
- Foreign-born
- 10% · Canada, Mexico, South Korea
- Languages at home
- 91% English-only · Spanish 4% Other Asian/Pacific 1% Other Indo-European 1%
Political lean MEDSL · Volusia
- 2024 margin
- Strong R (+21.8) · D 38.7% · R 60.5%
- 2008→2024 swing
- -27.4pp toward R · 2008: 5.7pp · 2024: -21.8pp
- All cycles
- 2024: R+21.8 2020: R+14.1 2016: R+13.1 2012: R+1.2 2008: D+5.7
Not yet ingested
- Civics
- —
Market trends
- HPI YoY
- ▼ -1.99%
- Current HPI
- 311.7456
- Rent YoY
- ▲ 5.46%
- Metro
- Deltona-Daytona Beach-Ormond Beach, FL
- State GDP YoY
- ▲ 3.28%
- F500 in state
- 36
Industry mix (Fortune 500 HQ in FL)
| Industry | F500 HQs | Revenue |
|---|---|---|
| Industrial Technology | 2 | $29B |
|
||
| Insurance | 2 | $17B |
|
||
| Retail | 1 | $60B |
|
||
| Technology Distribution | 1 | $58B |
|
||
| Homebuilding | 1 | $35B |
|
||
| Technology Manufacturing | 1 | $35B |
|
||
Cash-flow waterfall
monthlySold comps — $/sqft
last 12 mo · ≤1 miLoading sold comps…