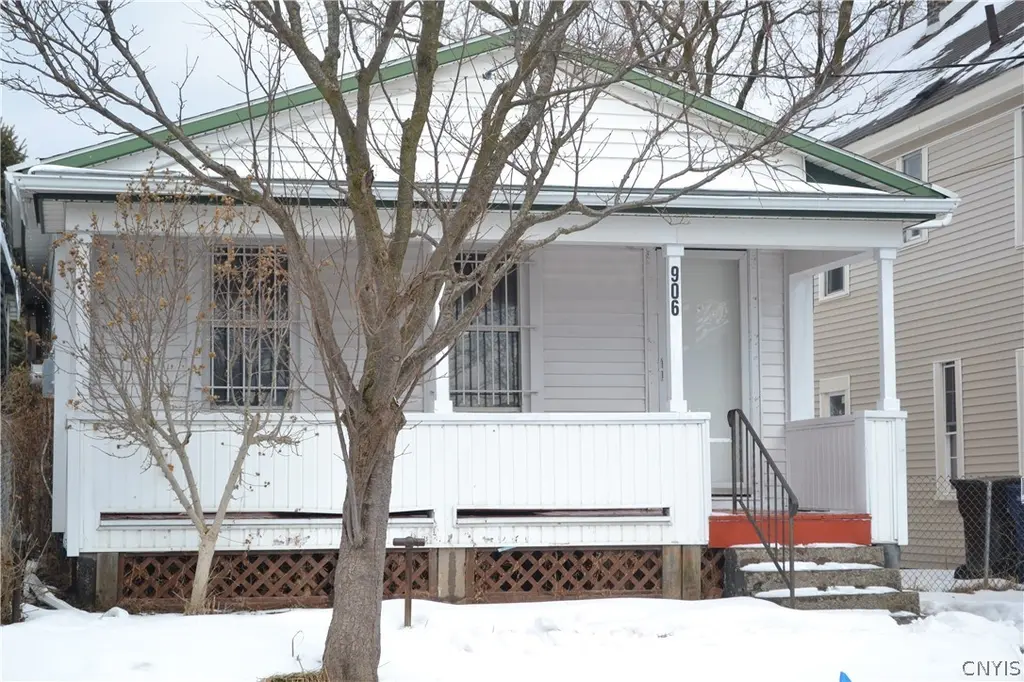
906 Park St · Syracuse, NY
Flood risk 1/10 · Minimal
- FEMA flood zone
- X (unshaded)
- Chance of flooding over 30 yrs
- 0.0%
- Est. flood insurance / yr
- $473 – $860
Fire risk 1/10 · Minimal
- Est. fire insurance / yr
- $691 – $1,283
Heat risk 3/10 · Minor
- Hot days now (above 95°F)
- 7 days/yr
- Hot days in 30 yrs
- 16 days/yr
Wind risk 1/10 · Minimal
- Chance of severe wind over 30 yrs
- —
Air-quality risk 2/10 · Minimal
- Unhealthy air days now
- 0 days/yr
- Unhealthy air days in 30 yrs
- 1 days/yr
Risk factors via First Street. Map © Google.
Why this score? — see what drove the B grade
The composite is a weighted blend of 9 inputs, each scored 0–100. Each bar is that input's sub-score; the figure is the points it added to the 100-point composite (weight × sub-score).
- Cash flow +30.0/30.0
- 1% rule +10.0/10.0
- DSCR +10.0/10.0
- Appreciation +10.0/10.0
- Livability +3.9/5.0
- Rent growth +2.5/5.0
- Condition / age +2.5/5.0
- ARV discount +2.0/15.0
- Schools +1.8/10.0
$89,900
🖨 Deal sheet 📄 Offer letter ✓ Due diligence
Listing remarks MLS
Well-maintained two-bedroom ranch offering immediate occupancy and strong long-term value. This property features an open floor plan with a spacious updated kitchen complete with gas stove, dishwasher, microwave, and ample cabinetry. The layout provides comfortable single-level living with a seamless flow between kitchen and main living space. Full bathroom includes tiled shower. All utilities are in working order. Mechanical systems are functional and the home has been maintained for ease of ownership. Exterior highlights include a fully fenced yard, covered back porch, and large open front porch providing additional living space. Manageable footprint makes for low maintenance while still offering outdoor privacy. Located in a stable rental corridor with consistent demand and convenient access to retail services, medical centers, and major roadways. Suitable for owner-occupants seeking efficient one-level living or investors looking for a solid addition to a rental portfolio. Move-in ready condition.
Key facts
- Open floor plan
- Gas stove
- Updated kitchen
Tags
Neighborhood map
What this means for you Summary
Snapshot
- This is a 3-bed/1.0-bath single-family listed at $90k.
Deal economics
- At list price, monthly cash flow is $690 ($8k/yr) — positive.
- The deal already cash-flows at list — no discount required.
- Meets the 1% rule at list price ($2k rent vs $90k).
- Recommended offer: $85k (6.0% below list) — sets the bar for market timing.
- Cap rate 15.5% vs local median 8.2% in Syracuse — top-decile yield for the area; either an underpriced asset or a hidden risk that comps aren't pricing in. Stress-test before assuming the spread holds.
Location & tenants
- Location reads 77/100 on livability (#187 in NY, #2,869 nationally) — a middle-class / working-renter tenant base. Strengths: amenities A+, commute A+, cost of living A+; Watch: schools D+, crime F, employment D-.
- Syracuse City School District (urban): math 18% / reading 26% proficiency, ranked #590 of 590 in NY (top 100%) — low school quality limits family demand, transient renter base, plan for 1-2y turnover; 74% free/reduced lunch — lower-income household profile, screen leases tightly.
- Market conditions: 99 active listings in the ZIP; 40 comparable units currently listed for rent nearby; rentals lingering (median 44d on market — plan ~5-8 weeks vacancy on turnover, expect pricing pressure); 62% of comp listings sitting > 30 days — soft ceiling on asking rent; lower-income renter base — watch delinquency; 616 units permitted in Onondaga County in 2024 (256 in 5+ unit buildings).
- This rent runs 43% of the median local income ($45k/yr) — at the standard rent-burdened threshold; future hikes will face affordability resistance.
Forward outlook
- In year one you build about $10k of equity ($622 loan paydown + $9k appreciation (10.0% local appreciation)).
- Onondaga County population projected to shrink 9% by 2050 — rents likely to lag national; underwrite the cash flow, not the appreciation.
- At projected returns (10.0% appreciation + 3.0% rent growth), your $25k cash investment doubles in ~2 years — after that, you're playing with house money.
- By year 4, paydown + projected appreciation supports a ~$34k cash-out refi (75% LTV) — recoverable capital for the next deal without selling this one.
Negotiation context
- It's been on market 88 days — a 6% lower offer ($85k) is reasonable based on typical stale-listing flexibility.
- 5 sale attempts since 8y ago with the ask held roughly flat each time — persistent listings suggest the price (not the market) is what's stuck; bring a comps-based counter.
- Current owner paid $31k; list at $90k implies a 192% gain — meaningful room to come down on a strong offer.
Risks & watch-outs
- Watch-outs: built in 1840 — expect roof / HVAC / electrical / plumbing capex.
Questions for the listing agent
- It's been on market 88 days. Have you received any prior offers? Is the seller open to a 6% concession, seller financing, or rate buy-down credit?
- Built in 1840 — when were the roof, HVAC, electrical panel, plumbing, and water heater last replaced?
- Why hasn't it sold? Are there any deal-killer items the seller is aware of (foundation, flood, title, zoning, code violations)?
- Is there a deadline driving the sale (1031 exchange, divorce, estate, relocation)? That informs how much negotiation room exists.
- Schools are D-rated, which usually means shorter tenancies and higher turnover. Who's the typical renter profile here, and what's been the actual vacancy rate?
- Crime grade is F in this area — have there been break-ins, vandalism, or insurance claims at this property in the last 3 years? What carrier currently insures it and at what premium?
- What's the average days-on-market for RENTAL listings here right now (not sales)? A rising rental-DOM trend means longer vacancies and softer asking-rent achievability than the comps imply.
- What's the recent tenant-quality profile in this submarket — average credit score on applications, eviction rate, late-payment / NSF rate, and stable-employment percentage? A property-management company in the area should have these aggregated.
- How much new for-sale + rental construction is in the pipeline within 1–3 miles? Heavy new supply typically softens prices + rents 12–24 months out; constrained supply supports both.
Investment metrics
- 1% rule
- 1.78% ✓
- Cap rate
- 15.51%
- Cash-on-cash
- 32.92%
- DSCR
- 2.46
- GRM
- 4.7
CMA / ARV
- ARV (median comp)
- $80,141
- List price
- $89,900
- Delta
- 12.18%
- Verdict
- OVERPRICED
- Comps
- 20 within 1.0 mi
Show comp detail 12 sales within ~0.75 mi
| Address | Dist | Beds/Ba | Sqft | Sold | Price | $/sf | Match |
|---|---|---|---|---|---|---|---|
| 928 Kirkpatrick St N | 0.61mi | 3/1.0 | 1,236 (-1%) | 0mo | $145,000 | $117 | 70 |
| 611 Highland St | 0.35mi | 3/1.0 | 1,302 (+5%) | 7mo | $95,000 | $73 | 70 |
| 231 Grumbach Ave | 0.39mi | 3/1.0 | 1,152 (-7%) | 0mo | $75,000 | $65 | 69 |
| 108 High St | 0.43mi | 3/1.0 | 1,276 (+3%) | 8mo | $175,000 | $137 | 68 |
| 116 Steuben St | 0.30mi | 3/1.0 | 1,104 (-11%) | 8mo | $90,000 | $82 | 60 |
| 2363 Grant Blvd | 0.63mi | 2/1.0 (-1) | 1,215 (-2%) | 5mo | $153,700 | $127 | 58 |
| 310 Helen St | 0.65mi | 2/1.5 (-1) | 1,274 (+2%) | 4mo | $191,000 | $150 | 55 |
| 117 Lawrence St | 0.37mi | 3/1.0 | 1,416 (+14%) | 6mo | $90,000 | $64 | 55 |
| 321 Dewitt St | 0.67mi | 3/1.5 | 1,310 (+5%) | 6mo | $175,000 | $134 | 53 |
| 200 Helen St | 0.64mi | 2/1.5 (-1) | 1,329 (+7%) | 5mo | $175,100 | $132 | 48 |
| 621 Dewitt St | 0.70mi | 3/1.0 | 1,113 (-10%) | 9mo | $190,000 | $171 | 42 |
| 1212 Spring St | 0.69mi | 4/1.5 (+1) | 1,115 (-10%) | 4mo | $71,000 | $64 | 40 |
Match score weights: distance 35% · size 25% · config 20% · recency 20%. Top-matched comps best support the ARV.
Projected returns pro-forma
10.0% appreciation · 3.0% rent growth · sell at horizon
- IRR
- 49.4%
- Equity multiple
- 4.69×
- Total profit
- $92,933
- Equity at exit
- $80,989
- IRR
- 43.1%
- Equity multiple
- 10.50×
- Total profit
- $239,079
- Equity at exit
- $174,656
Cash invested: $25,172 (down + closing). Projections, not guarantees.
Landlord ↔ Tenant lean methodology
- Overall (STATE)
- 15 Strongly Tenant-Friendly
- State New York
- 15 Strongly Tenant-Friendly · D+10
- County
- — inherits STATE
- City
- — inherits STATE
ZIP-level market 13208
- Home prices YoY
- 8.4%
- Active inventory
- 99
- Price-to-rent
- 4.7×
Monthly cashflow live
- Estimated rent
- $1,600 high interval (Pro) →
- Mortgage (P&I)
- −$471
- Tax from tax record
- −$65 /mo · $778/yr
- Insurance
- −$37
- HOA
- −$0
- Vacancy / Maint / Mgmt
- −$336
- Net cashflow
- $690
Break-even live
UW: 25.0% down · 7.5% · 30yr · 1.5% tax · 5.0% vac · 8.0% maint · 8.0% mgmt
Financing live
Cash to close
- Down payment
- $22,475
- Closing costs
- $2,697
- Reserves months
- —
- Total cash needed
- —
Loan-product check · same deal, 3 products live
Conventional
25% down · 7.5% · 30yr
- Down + closing
- —
- Monthly P&I
- —
- Monthly cashflow
- —
- DSCR
- —
- Eligible?
- —
Personal DTI + credit; lowest rate.
DSCR
20% down · 8.5% · 30yr
- Down + closing
- —
- Monthly P&I
- —
- Monthly cashflow
- —
- DSCR
- —
- Eligible?
- —
No personal income docs; deal must DSCR.
Hard money
10% down · 12.0% · 12mo
- Down + closing
- —
- Monthly P&I
- —
- Monthly cashflow
- —
- DSCR
- —
- Eligible?
- —
Short-term bridge; refi at stabilization.
Rent comps 40 comps
| Address | Beds | Baths | Sqft | Rent | $/sqft | DOM | Units | Dist |
|---|---|---|---|---|---|---|---|---|
| 912 Park St Unit 1 Syracuse, NY | 3.0 | 1.0 | 1040 | $1,200 | $1.15 | 44d | 1 | 0.04mi |
| 610 E Division St Unit F2 Syracuse, NY | 2.0 | 1.0 | 900 | $1,150 | $1.28 | 44d | 1 | 0.15mi |
| 746 E Laurel St Unit 2F Syracuse, NY | 2.0 | 1.0 | 800 | $1,100 | $1.38 | 44d | 1 | 0.30mi |
| 746 E Laurel St Unit 1 Syracuse, NY | 4.0 | 2.0 | 1400 | $1,500 | $1.07 | 44d | 1 | 0.30mi |
| 807-13 N Salina St Unit 809A Syracuse, NY | 2.0 | 1.0 | 1020 | $1,325 | $1.30 | 44d | 1 | 0.36mi |
| 205 Beecher St Unit 3 Syracuse, NY | 2.0 | 1.0 | 815 | $1,100 | $1.35 | 44d | 1 | 0.42mi |
| 517 N Salina St Unit 4 Syracuse, NY | 2.0 | 1.0 | 700 | $1,050 | $1.50 | 14d | 1 | 0.46mi |
| 210 W Division St Unit 24 Syracuse, NY | 2.0 | 2.0 | 1200 | $1,850 | $1.54 | 21d | 1 | 0.58mi |
| 721 N Clinton St Unit 105 Syracuse, NY | 2.0 | 2.0 | 1000 | $1,475 | $1.48 | 44d | 1 | 0.58mi |
| 721 N Clinton St Unit 213 Syracuse, NY | 2.0 | 2.0 | 1000 | $1,550 | $1.55 | 44d | 1 | 0.58mi |
| 210 W Division St Unit 87 Syracuse, NY | 2.0 | 2.0 | 1200 | $1,750 | $1.46 | 44d | 1 | 0.59mi |
| 126 Woodruff Ave Syracuse, NY | 3.0 | 1.0 | 1200 | $1,675 | $1.40 | 44d | 1 | 0.64mi |
| 416 Pearl St Unit 2 Syracuse, NY | 3.0 | 1.0 | 900 | $2,400 | $2.67 | 14d | 1 | 0.67mi |
| 205A Hawley Ave Unit 213C Syracuse, NY | 3.0 | 2.5 | 1350 | $1,650 | $1.22 | 44d | 1 | 0.77mi |
| 205A Hawley Ave Unit 211C Syracuse, NY | 3.0 | 2.5 | 1350 | $1,675 | $1.24 | 44d | 1 | 0.77mi |
| 1507 N Salina St Unit 3 Syracuse, NY | 3.0 | 2.0 | 1030 | $1,350 | $1.31 | 44d | 1 | 0.80mi |
| 373 Spencer St Unit 303 Syracuse, NY | 2.0 | 1.5 | 1085 | $1,850 | $1.71 | 44d | 1 | 0.84mi |
| 200 Catherine St Apt 5 Syracuse, NY | 2.0 | 1.0 | 850 | $1,550 | $1.82 | 44d | 1 | 0.86mi |
| 286 Ross Park Syracuse, NY | 3.0 | 1.0 | 1100 | $1,500 | $1.36 | 44d | 1 | 0.92mi |
| 525 Burnet Ave Unit First Floor Syracuse, NY | 3.0 | 1.0 | 900 | $1,650 | $1.83 | 44d | 1 | 0.95mi |
| 208 W Water St Syracuse, NY | 2.0 | 2.0 | 962 | $1,800 | $1.87 | 44d | 1 | 0.97mi |
| 101 S Salina St Syracuse, NY | 2.0 | 1.0 | 651 | $2,871 | $4.41 | 14d | 14 | 0.99mi |
| 423 Wendell Ter Syracuse, NY | 4.0 | 1.0 | 1312 | $2,500 | $1.91 | 14d | 1 | 1.00mi |
| 324 W Water St Unit 106 Syracuse, NY | 2.0 | 1.0 | 1436 | $2,095 | $1.46 | 21d | 1 | 1.04mi |
| 324 W Water St Syracuse, NY | 2.0 | 1.0 | 1007 | $1,975 | $1.96 | 14d | 6 | 1.04mi |
| 129 W Fayette St Unit 217 Syracuse, NY | 2.0 | 2.0 | 1100 | $1,550 | $1.41 | 14d | 1 | 1.10mi |
| 321 S Salina St Unit 201 Syracuse, NY | 2.0 | 1.0 | 1446 | $2,450 | $1.69 | 44d | 1 | 1.12mi |
| 321 S Salina St Unit 501 Syracuse, NY | 2.0 | 1.0 | 1446 | $3,000 | $2.07 | 44d | 1 | 1.12mi |
| 317 S Clinton St Unit 4A Syracuse, NY | 2.0 | 1.5 | 1500 | $2,100 | $1.40 | 14d | 1 | 1.12mi |
| 317 S Clinton St Unit 3A Syracuse, NY | 2.0 | 2.0 | 1500 | $2,100 | $1.40 | 44d | 1 | 1.12mi |
| 110 Walton St Unit 301 Syracuse, NY | 2.0 | 2.0 | 1051 | $2,000 | $1.90 | 21d | 1 | 1.14mi |
| 110 Walton St Unit 201 Syracuse, NY | 2.0 | 2.0 | 1051 | $2,200 | $2.09 | 44d | 1 | 1.14mi |
| 120 Walton St Syracuse, NY | 1.0–2.0 | 1.0–2.0 | 825 | $3,200 | $3.88 | 44d | 2 | 1.14mi |
| 1618 James St #3 Syracuse, NY | 2.0 | 1.0 | 1150 | $2,200 | $1.91 | 14d | 1 | 1.16mi |
| 201 E Jefferson St Syracuse, NY | 2.0 | 1.0 | 662 | $1,626 | $2.45 | 14d | 9 | 1.17mi |
| 205 E Jefferson St Unit 2B Syracuse, NY | 2.0 | 2.5 | 1100 | $2,200 | $2.00 | 21d | 1 | 1.17mi |
| 900 E Fayette St Syracuse, NY | 1.0–2.0 | 1.0 | 817 | $1,995 | $2.44 | 14d | 9 | 1.21mi |
| 538 Erie Blvd W Syracuse, NY | 2.0 | 2.0 | 1110 | $2,100 | $1.89 | 21d | 1 | 1.22mi |
| 60 Presidential Plz Syracuse, NY | 1.0–2.0 | 1.0–1.5 | 970 | $1,315 | $1.36 | 44d | 1 | 1.26mi |
| 1132 Wolf St Unit 4 Syracuse, NY | 3.0 | 1.0 | 1041 | $1,350 | $1.30 | 44d | 1 | 1.27mi |
Listing history 12 events
-
2026-02-25$89,900 Active 1016-char remark
Show marketing remark (1016 chars)
Well-maintained two-bedroom ranch offering immediate occupancy and strong long-term value. This property features an open floor plan with a spacious updated kitchen complete with gas stove, dishwasher, microwave, and ample cabinetry. The layout provides comfortable single-level living with a seamless flow between kitchen and main living space. Full bathroom includes tiled shower. All utilities are in working order. Mechanical systems are functional and the home has been maintained for ease of ownership. Exterior highlights include a fully fenced yard, covered back porch, and large open front porch providing additional living space. Manageable footprint makes for low maintenance while still offering outdoor privacy. Located in a stable rental corridor with consistent demand and convenient access to retail services, medical centers, and major roadways. Suitable for owner-occupants seeking efficient one-level living or investors looking for a solid addition to a rental portfolio. Move-in ready condition.
-
2026-02-23historical
-
2025-09-23$89,900 Active
-
2020-08-20soldstatus $30,750 Closed Sale or Rented
-
2020-05-20status Pending Sale
-
2020-05-13$34,900 Active
-
2018-09-21soldstatus $39,000 Closed Sale or Rented
-
2018-08-21status Pending Sale
-
2018-08-15historical Continue to Show- Under Contract
-
2018-08-14status Active
-
2018-07-31historical Continue to Show- Under Contract
-
2018-07-27$42,500 Active
ⓘ Source: listings_history table (triggers on properties + properties_extension) + one-shot
backfill from property_details.listing_events for pre-trigger history.
Tax reassessment forecast NY · Partial reset (capped growth)
- Current annual tax
- $778 · $65/mo
- Projected year-2 tax
- $1,149 · $96/mo
- Expected delta
- +$371/yr (+$31/mo · 47.7%)
ⓘ Screening estimate from a state-policy table — verify with the county assessor before closing.
Climate risk First Street
- Flood 1/10 Low FEMA zone X (unshaded) · 0% chance over 30 yrs
- Wildfire 1/10 Low
- Heat 3/10 Moderate 7 d/yr ≥95°F today · 16 d/yr by 30 yrs out
- Wind 1/10 Low
- Air quality 2/10 Low 0 unhealthy d/yr today · 1 by 30 yrs out
Nearby sold comps map
Loading sold comps map…
Walkable amenities ~0.75 mi
Loading nearby amenities…
Taxation est. · year 1
- Rental income
- $19,203
- − Mortgage interest
- −$5,036
- − Property taxes
- −$778
- − Insurance
- −$450
- − Repairs & maintenance
- −$1,536
- − Management
- −$1,536
- − Depreciation
- −$2,615
- Taxable income
- $7,252
- Est. tax owed @ 24.0%
- −$1,740
- After-tax cash flow
- $6,545/yr
For passive investors: Depreciation is non-cash, so a rental often shows a tax loss while cash-flowing — sheltering income. Rental losses are passive: they offset passive income freely, and up to $25,000/yr can offset ordinary (W-2) income if you actively participate and your MAGI is under $100k (phasing out to $0 by $150k); unused losses carry forward. On sale, claimed depreciation is recaptured at up to 25%, and gains may owe capital-gains tax (a 1031 exchange can defer both). Figures are a year-1 estimate at your 24.0% rate — not tax advice; consult a CPA.
Schools (NCES district)
- District
- Syracuse City School District
- NCES district ID
- 3628590
- Math proficiency
- 18% ▼ -5.00%
- Reading proficiency
- 26% ▬ 0.00%
- Median HH income
- $32,097
- Composite
- 17.83/100
- National rank
- #9007
- State rank
- #590 of 590 in NY
Livability — Syracuse
- Score
- 77/100
- State rank
- #187
- US rank
- #2869
Category grades
Schools grade is shown separately in the Schools card above.
Census & demographics
- Census place
- Syracuse, NY
- County
- Onondaga County · 247,257 people
- City population
- 152,627
- Metro
- Syracuse, NY
- Population (ZIP)
- 22,993
- Household income
- $44,712
- Rent vs Own
- Severe rent burden
- 1437.0
Population outlook (Onondaga County) Hauer SSP2
- Today (2025)
- 467,894 people
- By 2030
- 463,381 · -1.0%
- By 2040
- 447,697 · -4.3%
- By 2050
- 426,399 · -8.9%
- By 2075
- 373,661 · -20.1%
- By 2100
- 307,967 · -34.2%
Race, ethnicity, and origin ACS 2023
- Neighborhood character
- Highly diverse neighborhood (Simpson 0.70)
- Race & ethnicity
- White 46% Black 24% Asian 14% Two or more races 10% Hispanic / Latino 6%
- Hispanic origin (detail)
- Puerto Rican 4% Dominican 1%
- Common ancestry
- Romanian 3% Swedish 3% Italian 1%
- Foreign-born
- 22% · Vietnam, Philippines, Canada
- Languages at home
- 70% English-only · Spanish 6% Other Asian/Pacific 5% Vietnamese 4%
Political lean MEDSL · Onondaga
- 2024 margin
- D (+17.3) · D 58.6% · R 41.4%
- 2008→2024 swing
- -3.0pp toward R · 2008: 20.3pp · 2024: 17.3pp
- All cycles
- 2024: D+17.3 2020: D+20.6 2016: D+12.8 2012: D+21.1 2008: D+20.3
Not yet ingested
- Civics
- —
Market trends
- HPI YoY
- ▲ 30.91%
- Current HPI
- 399.3284
- Rent YoY
- —
- Metro
- Syracuse, NY
- State GDP YoY
- ▲ 2.60%
- F500 in state
- 92
Industry mix (Fortune 500 HQ in NY)
| Industry | F500 HQs | Revenue |
|---|---|---|
| Financial Services | 10 | $950B |
|
||
| Consumer Goods | 9 | $162B |
|
||
| Insurance | 4 | $225B |
|
||
| Telecommunications | 2 | $144B |
|
||
| Pharmaceuticals | 2 | $112B |
|
||
| Media / Entertainment | 2 | $69B |
|
||
Price history
+111.5% since first listed12 events — show timeline
- 2026-02-25 Listed $89,900 CNYIS
- 2026-02-23 Listing Removed — CNYIS
- 2025-09-23 Listed $89,900 CNYIS
- 2020-08-20 Sold (MLS) $30,750 CNYIS
- 2020-05-20 Pending — CNYIS
- 2020-05-13 Listed $34,900 CNYIS
- 2018-09-21 Sold (MLS) $39,000 CNYIS
- 2018-08-21 Pending — CNYIS
- 2018-08-15 Contingent — CNYIS
- 2018-08-14 Relisted — CNYIS
- 2018-07-31 Contingent — CNYIS
- 2018-07-27 Listed $42,500 CNYIS
Property tax history
+2.4%/yrLatest (2025): $778 · +0.0% YoY. Source: county tax records.
Cash-flow waterfall
monthlySold comps — $/sqft
last 12 mo · ≤1 miLoading sold comps…