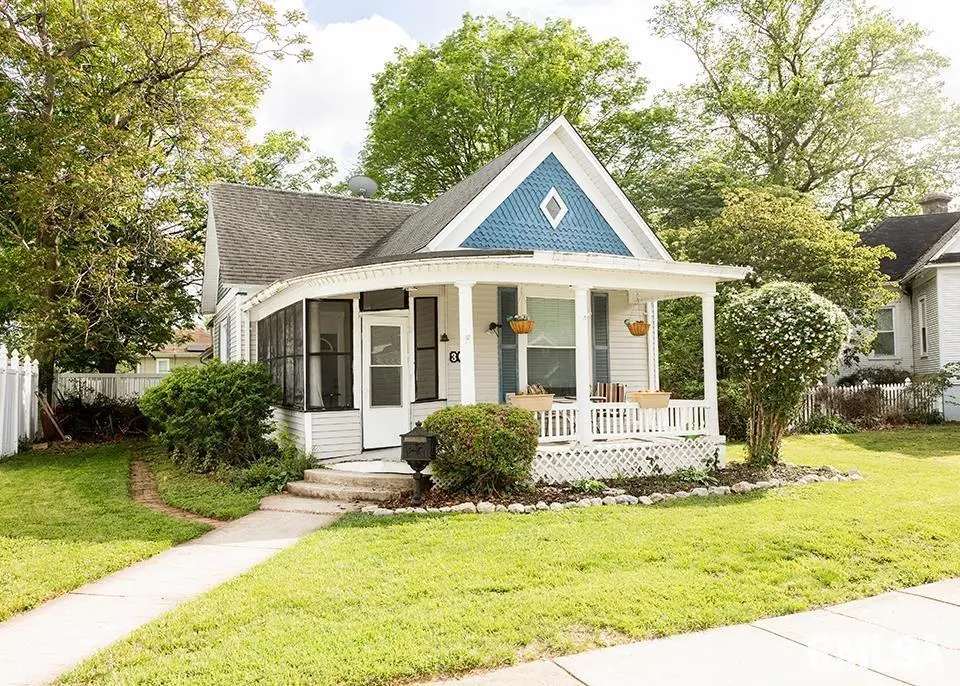
305 W Clark Ave · Effingham, IL
Flood risk 1/10 · Minimal
- FEMA flood zone
- X
- Chance of flooding over 30 yrs
- 0.0%
- Est. flood insurance / yr
- $507 – $1,088
Fire risk 1/10 · Minimal
- Est. fire insurance / yr
- $804 – $1,492
Heat risk 4/10 · Minor
- Hot days now (above 106°F)
- 7 days/yr
- Hot days in 30 yrs
- 20 days/yr
Wind risk 2/10 · Minimal
- Chance of severe wind over 30 yrs
- 1.0%
Air-quality risk 2/10 · Minimal
- Unhealthy air days now
- 1 days/yr
- Unhealthy air days in 30 yrs
- 2 days/yr
Risk factors via First Street. Map © Google.
Why this score? — see what drove the D+ grade
The composite is a weighted blend of 9 inputs, each scored 0–100. Each bar is that input's sub-score; the figure is the points it added to the 100-point composite (weight × sub-score).
- ARV discount +15.0/15.0
- Cash flow +14.3/30.0
- DSCR +4.4/10.0
- Livability +3.9/5.0
- 1% rule +3.8/10.0
- Rent growth +2.5/5.0
- Condition / age +2.5/5.0
- Schools +1.9/10.0
- Appreciation +0.0/10.0
$130,000
🖨 Deal sheet 📄 Offer letter ✓ Due diligence
Listing remarks MLS
Enormous 3 bedroom, 1 bathroom home that is ready for you! Tall ceilings, a HUGE kitchen with built-ins, and a HUGE dining room with new flooring. Updates include replacement windows throughout and fresh paint! This property is centrally located in town for easy access to dining, shopping, schools, and a short walk to Bliss Park. There is also a fenced in backyard for corralling pets, kids, and entertaining. Don't let this one get away!
Key facts
- Fenced in backyard
- Great location
- New water heater
Tags
Property features AI
Exterior
- Parking: On-street parking
- Utilities: Public water; Public sewer
- Home design: Single family residence; Built in 1920
- Construction: Shingle roof
- Exterior features: Level lot
Interior
- Kitchen: Kitchen on main level
- Bedrooms: 4 bedrooms; Primary bedroom on main level; Additional bedrooms located on upper level, lower level, basement, and an additional level; Several bedrooms have egress windows
- Flooring: Laminate flooring in multiple bedrooms; Vinyl flooring in kitchen
- Bathrooms: 1 full bathroom
- Heating & cooling: Central air conditioning; Forced air heating
- Interior features: Dishwasher; Refrigerator
Neighborhood map
What this means for you Summary
Snapshot
- This is a 1-bed/1.0-bath single-family listed at $130k.
Deal economics
- At list price, monthly cash flow is $24 ($293/yr) — positive.
- The deal already cash-flows at list — no discount required.
- To meet the 1% rule (rent ≥ 1% of price), the offer needs to be $114k (12.4% below list).
- Recommended offer: $114k (12.4% below list) — sets the bar for 1% rule.
- Cap rate 6.5% vs local median 2.6% in Effingham — top-decile yield for the area; either an underpriced asset or a hidden risk that comps aren't pricing in. Stress-test before assuming the spread holds.
Location & tenants
- Location reads 78/100 on livability (#140 in IL, #2,564 nationally) — a middle-class / working-renter tenant base. Strengths: cost of living A+, housing A+, health & safety A+; Watch: amenities F.
- Effingham CUSD 40 (town): math 18% / reading 26% proficiency, ranked #387 of 620 in IL (top 62%) — low school quality limits family demand, transient renter base, plan for 1-2y turnover.
- Zoned schools: Effingham High School (math 27% / reading 27%, grade F, #218 of 693 statewide, top 35%, 734 students, 0% FRL) — zoned schools average 0% FRL vs 41% district-wide (41 pts lower); this property's tenant base skews higher-income than the district average.
- Market conditions: 111 active listings in the ZIP; 27 units permitted in Effingham County in 2024 (0 in 5+ unit buildings).
Forward outlook
- Local home prices are declining (-3.0%/yr); year-one equity from $899 of loan paydown is wiped out by about $4k of value loss. Plan a longer hold.
- Effingham County population projected at -13% by 2050 — secular population decline; favor cash flow + early exit over multi-decade hold.
Negotiation context
- It's been on market 18 days — a 2% lower offer ($128k) is reasonable based on typical stale-listing flexibility.
- 7 sale attempts since 10y ago; this cycle's ask has dropped $9k (6%) from the opening price — seller is motivated, your offer sets the floor, not the list.
- Current owner paid $110k; 18% above their basis — modest negotiation headroom, anchor on the comps not their cost.
Risks & watch-outs
- Watch-outs: built in 1920 — expect roof / HVAC / electrical / plumbing capex.
Questions for the listing agent
- Built in 1920 — when were the roof, HVAC, electrical panel, plumbing, and water heater last replaced?
- Is there a deadline driving the sale (1031 exchange, divorce, estate, relocation)? That informs how much negotiation room exists.
- Schools are D-rated, which usually means shorter tenancies and higher turnover. Who's the typical renter profile here, and what's been the actual vacancy rate?
- The area grade is low — what's the realistic commute time and amenity access for the typical tenant pool here? Any planned neighborhood developments (good or bad) we should know about?
- What's the average days-on-market for RENTAL listings here right now (not sales)? A rising rental-DOM trend means longer vacancies and softer asking-rent achievability than the comps imply.
- What's the recent tenant-quality profile in this submarket — average credit score on applications, eviction rate, late-payment / NSF rate, and stable-employment percentage? A property-management company in the area should have these aggregated.
- How much new for-sale + rental construction is in the pipeline within 1–3 miles? Heavy new supply typically softens prices + rents 12–24 months out; constrained supply supports both.
Investment metrics
- 1% rule
- 0.88% ✗
- Cap rate
- 6.52%
- Cash-on-cash
- 0.81%
- DSCR
- 1.04
- GRM
- 9.5
CMA / ARV
- ARV (median comp)
- $165,046
- List price
- $130,000
- Delta
- -21.23%
- Verdict
- UNDERPRICED
- Comps
- 20 within 1.0 mi
Show comp detail 3 sales within ~0.75 mi
| Address | Dist | Beds/Ba | Sqft | Sold | Price | $/sf | Match |
|---|---|---|---|---|---|---|---|
| 508 E Brentwood Ave | 0.52mi | 2/2.0 (+1) | 1,556 (-3%) | 7mo | $147,000 | $94 | 56 |
| 507 E Jefferson Ave | 0.69mi | 2/1.0 (+1) | 1,495 (-7%) | 4mo | $107,500 | $72 | 49 |
| 516 E Brentwood Ave | 0.57mi | 2/1.0 (+1) | 1,728 (+8%) | 18mo | $149,000 | $86 | 41 |
Match score weights: distance 35% · size 25% · config 20% · recency 20%. Top-matched comps best support the ARV.
Projected returns pro-forma
-3.0% appreciation · 3.0% rent growth · sell at horizon
- IRR
- -15.0%
- Equity multiple
- 0.46×
- Total profit
- $-19,508
- Equity at exit
- $19,383
- IRR
- -6.4%
- Equity multiple
- 0.59×
- Total profit
- $-14,973
- Equity at exit
- $11,240
Cash invested: $36,400 (down + closing). Projections, not guarantees.
Landlord ↔ Tenant lean methodology
- Overall (STATE)
- 43 Moderately Tenant-Leaning
- State Illinois
- 43 Moderately Tenant-Leaning · D+7
- County
- — inherits STATE
- City
- — inherits STATE
ZIP-level market 62401
- Home prices YoY
- -26.2%
- Active inventory
- 111
- Price-to-rent
- 9.5×
Monthly cashflow live
- Estimated rent
- $1,138 medium interval (Pro) →
- Mortgage (P&I)
- −$682
- Tax from tax record
- −$139 /mo · $1,667/yr
- Insurance
- −$54
- HOA
- −$0
- Vacancy / Maint / Mgmt
- −$239
- Net cashflow
- $24
Break-even live
UW: 25.0% down · 7.5% · 30yr · 1.5% tax · 5.0% vac · 8.0% maint · 8.0% mgmt
Financing live
Cash to close
- Down payment
- $32,500
- Closing costs
- $3,900
- Reserves months
- —
- Total cash needed
- —
Loan-product check · same deal, 3 products live
Conventional
25% down · 7.5% · 30yr
- Down + closing
- —
- Monthly P&I
- —
- Monthly cashflow
- —
- DSCR
- —
- Eligible?
- —
Personal DTI + credit; lowest rate.
DSCR
20% down · 8.5% · 30yr
- Down + closing
- —
- Monthly P&I
- —
- Monthly cashflow
- —
- DSCR
- —
- Eligible?
- —
No personal income docs; deal must DSCR.
Hard money
10% down · 12.0% · 12mo
- Down + closing
- —
- Monthly P&I
- —
- Monthly cashflow
- —
- DSCR
- —
- Eligible?
- —
Short-term bridge; refi at stabilization.
Listing history 18 events
-
2026-05-15status Pending 979-char remark
-
2026-05-12price $130,000 979-char remark
-
2026-04-24$139,000 Active 979-char remark
-
2020-03-20soldstatus $70,000
-
2020-03-19soldstatus $70,000 445-char remark
Show marketing remark (445 chars)
Enormous 3 bedroom, 1 bathroom home that is ready for you! Tall ceilings, a HUGE kitchen with built-ins, and a HUGE dining room with new flooring. Updates include replacement windows throughout and fresh paint! This property is centrally located in town for easy access to dining, shopping, schools, and a short walk to Bliss Park. There is also a fenced in backyard for corralling pets, kids, and entertaining. Don't let this one get away!
-
2020-03-19soldstatus $70,000
Show marketing remark (445 chars)
Enormous 3 bedroom, 1 bathroom home that is ready for you! Tall ceilings, a HUGE kitchen with built-ins, and a HUGE dining room with new flooring. Updates include replacement windows throughout and fresh paint! This property is centrally located in town for easy access to dining, shopping, schools, and a short walk to Bliss Park. There is also a fenced in backyard for corralling pets, kids, and entertaining. Don't let this one get away!
-
2019-04-01$77,900 445-char remark
Show marketing remark (445 chars)
Enormous 3 bedroom, 1 bathroom home that is ready for you! Tall ceilings, a HUGE kitchen with built-ins, and a HUGE dining room with new flooring. Updates include replacement windows throughout and fresh paint! This property is centrally located in town for easy access to dining, shopping, schools, and a short walk to Bliss Park. There is also a fenced in backyard for corralling pets, kids, and entertaining. Don't let this one get away!
-
2019-04-01$77,900
Show marketing remark (445 chars)
Enormous 3 bedroom, 1 bathroom home that is ready for you! Tall ceilings, a HUGE kitchen with built-ins, and a HUGE dining room with new flooring. Updates include replacement windows throughout and fresh paint! This property is centrally located in town for easy access to dining, shopping, schools, and a short walk to Bliss Park. There is also a fenced in backyard for corralling pets, kids, and entertaining. Don't let this one get away!
-
2017-07-07soldstatus $76,000
-
2017-07-06soldstatus $76,000
-
2017-07-06soldstatus $76,000
-
2017-04-15$79,900
-
2017-04-15$79,900
-
2016-05-27soldstatus $73,000
-
2016-05-27soldstatus $73,000
-
2016-05-27soldstatus $73,100
-
2016-03-23$75,000
-
2016-03-23$75,000
ⓘ Source: listings_history table (triggers on properties + properties_extension) + one-shot
backfill from property_details.listing_events for pre-trigger history.
Tax reassessment forecast IL · Partial reset (capped growth)
- Current annual tax
- $1,667 · $139/mo
- Projected year-2 tax
- $2,309 · $192/mo
- Expected delta
- +$642/yr (+$54/mo · 38.5%)
ⓘ Screening estimate from a state-policy table — verify with the county assessor before closing.
Climate risk First Street
- Flood 1/10 Low FEMA zone X · 0% chance over 30 yrs
- Wildfire 1/10 Low
- Heat 4/10 Moderate 7 d/yr ≥106°F today · 20 d/yr by 30 yrs out
- Wind 2/10 Low 100% chance of damaging wind over 30 yrs
- Air quality 2/10 Low 1 unhealthy d/yr today · 2 by 30 yrs out
Nearby sold comps map
Loading sold comps map…
Walkable amenities ~0.75 mi
Loading nearby amenities…
Taxation est. · year 1
- Rental income
- $13,659
- − Mortgage interest
- −$7,282
- − Property taxes
- −$1,667
- − Insurance
- −$650
- − Repairs & maintenance
- −$1,093
- − Management
- −$1,093
- − Depreciation
- −$3,782
- Taxable loss
- −$1,907
- Est. tax savings @ 24.0%
- +$458
- After-tax cash flow
- $751/yr
For passive investors: Depreciation is non-cash, so a rental often shows a tax loss while cash-flowing — sheltering income. Rental losses are passive: they offset passive income freely, and up to $25,000/yr can offset ordinary (W-2) income if you actively participate and your MAGI is under $100k (phasing out to $0 by $150k); unused losses carry forward. On sale, claimed depreciation is recaptured at up to 25%, and gains may owe capital-gains tax (a 1031 exchange can defer both). Figures are a year-1 estimate at your 24.0% rate — not tax advice; consult a CPA.
Schools (NCES district)
- District
- Effingham CUSD 40
- NCES district ID
- 1713560
- Math proficiency
- 18% ▼ -5.00%
- Reading proficiency
- 26% ▼ -6.00%
- Median HH income
- $48,021
- Composite
- 19.35/100
- National rank
- #8789
- State rank
- #387 of 620 in IL
Livability — Effingham
- Score
- 78/100
- State rank
- #140
- US rank
- #2564
Category grades
Schools grade is shown separately in the Schools card above.
Census & demographics
- Census place
- Effingham, IL
- City population
- 19,371
- Population (ZIP)
- 19,371
Population outlook (Effingham County) Hauer SSP2
- Today (2025)
- 34,179 people
- By 2030
- 33,648 · -1.6%
- By 2040
- 32,066 · -6.2%
- By 2050
- 29,813 · -12.8%
- By 2075
- 24,101 · -29.5%
- By 2100
- 17,174 · -49.8%
Race, ethnicity, and origin ACS 2023
- Neighborhood character
- Predominantly White (94%)
- Race & ethnicity
- White 94% Hispanic / Latino 3% Two or more races 2%
- Common ancestry
- Lithuanian 2% Romanian 2% Italian 1%
- Foreign-born
- 3% · Canada
- Languages at home
- 96% English-only · Spanish 3% Other Indo-European 1%
Political lean MEDSL · Effingham
- 2024 margin
- Solid R (+60.4) · D 19.0% · R 79.3% · Other 1.7%
- 2008→2024 swing
- -24.4pp toward R · 2008: -36.0pp · 2024: -60.4pp
- All cycles
- 2024: R+60.4 2020: R+59.2 2016: R+60.5 2012: R+52.0 2008: R+36.0
Not yet ingested
- Civics
- —
Market trends
- HPI YoY
- ▼ -59.52%
- Current HPI
- 167.267
- Rent YoY
- —
- Metro
- —
- State GDP YoY
- ▲ 1.59%
- F500 in state
- 60
Industry mix (Fortune 500 HQ in IL)
| Industry | F500 HQs | Revenue |
|---|---|---|
| Insurance | 4 | $201B |
|
||
| Consumer Goods | 4 | $87B |
|
||
| Industrial Machinery | 3 | $64B |
|
||
| Healthcare | 2 | $55B |
|
||
| Retail / Pharmacy | 1 | $148B |
|
||
| Agriculture / Food | 1 | $86B |
|
||
Price history
+46.7% since first listed19 events — show timeline
- 2026-06-18 Sold (MLS) $110,000 RMLSA as Distributed by MLS Grid
- 2026-05-15 Pending — RMLSA as Distributed by MLS Grid
- 2026-05-12 Price Changed $130,000 RMLSA as Distributed by MLS Grid
- 2026-04-24 Listed $139,000 RMLSA as Distributed by MLS Grid
- 2020-03-20 Sold (Public Records) $70,000 Public Records
- 2020-03-19 Sold (MLS) $70,000 MRED as Distributed by MLS Grid
- 2020-03-19 Sold (MLS) $70,000 CIBR
- 2019-04-01 Listed $77,900 MRED as Distributed by MLS Grid
- 2019-04-01 Listed $77,900 CIBR
- 2017-07-07 Sold (Public Records) $76,000 Public Records
- 2017-07-06 Sold (MLS) $76,000 CIBR
- 2017-07-06 Sold (MLS) $76,000 MRED as Distributed by MLS Grid
- 2017-04-15 Listed $79,900 CIBR
- 2017-04-15 Listed $79,900 MRED as Distributed by MLS Grid
- 2016-05-27 Sold (Public Records) $73,100 Public Records
- 2016-05-27 Sold (MLS) $73,000 CIBR
- 2016-05-27 Sold (MLS) $73,000 MRED as Distributed by MLS Grid
- 2016-03-23 Listed $75,000 CIBR
- 2016-03-23 Listed $75,000 MRED as Distributed by MLS Grid
Property tax history
+4.2%/yrLatest (2024): $1,667 · +11.9% YoY. Source: county tax records.
Cash-flow waterfall
monthlySold comps — $/sqft
last 12 mo · ≤1 miLoading sold comps…