8900 170th St Unit 12F · New York, NY
Flood risk 4/10 · Minor
- FEMA flood zone
- X (unshaded)
- Chance of flooding over 30 yrs
- 0.22%
- Est. flood insurance / yr
- $507 – $1,088
Fire risk 1/10 · Minimal
- Est. fire insurance / yr
- $691 – $1,283
Heat risk 6/10 · Moderate
- Hot days now (above 99°F)
- 7 days/yr
- Hot days in 30 yrs
- 15 days/yr
Wind risk 6/10 · Moderate
- Chance of severe wind over 30 yrs
- 50.0%
Air-quality risk 4/10 · Minor
- Unhealthy air days now
- 6 days/yr
- Unhealthy air days in 30 yrs
- 6 days/yr
Risk factors via First Street. Map © Google.
Why this score? — see what drove the D grade
The composite is a weighted blend of 9 inputs, each scored 0–100. Each bar is that input's sub-score; the figure is the points it added to the 100-point composite (weight × sub-score).
- Cash flow +12.2/30.0
- ARV discount +7.5/15.0
- Schools +5.0/10.0
- Livability +3.8/5.0
- DSCR +3.6/10.0
- 1% rule +3.5/10.0
- Rent growth +2.7/5.0
- Condition / age +2.2/5.0
- Appreciation +0.0/10.0
$350,000
🖨 Deal sheet 📄 Offer letter ✓ Due diligence
Listing remarks
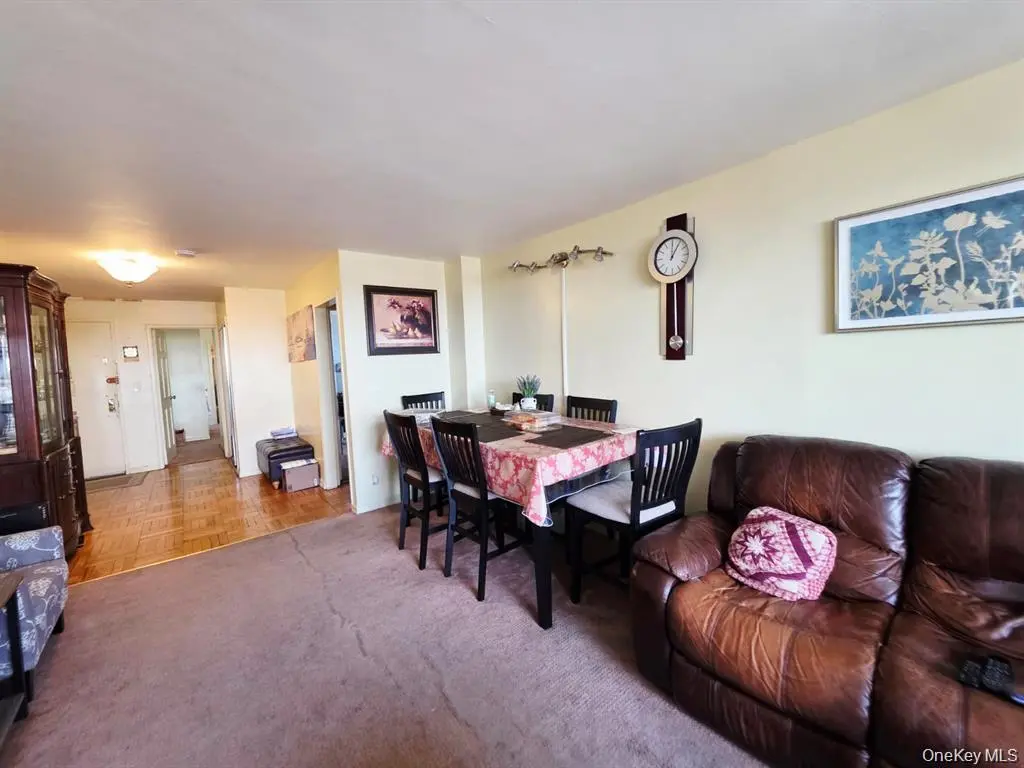
2 bedroom, 2 full bathroom. huge living room, dining room. kitchen. balcony. double elevators.
Key facts
- Garage
- Built 1968
- Listed 3 days
Neighborhood map
What this means for you Summary
Snapshot
- This is a 2-bed/2.0-bath condo listed at $350k. Condition is rated fair.
Deal economics
- At list price, monthly cash flow is $-69 ($-825/yr) — negative.
- To cash-flow at today's rent, offer at most $340k (2.8% below list).
- To meet the 1% rule (rent ≥ 1% of price), the offer needs to be $297k (15.0% below list).
- Recommended offer: $297k (15.0% below list) — sets the bar for 1% rule.
- Cap rate 6.1% vs local median 2.6% in New York — top-decile yield for the area; either an underpriced asset or a hidden risk that comps aren't pricing in. Stress-test before assuming the spread holds.
Location & tenants
- Location reads 75/100 on livability (#268 in NY, #4,188 nationally) — a middle-class / working-renter tenant base. Strengths: amenities A+, commute A+, health & safety A; Watch: crime F, cost of living F.
- Market conditions: Rents flat; 197 active listings in the ZIP; 40 comparable units currently listed for rent nearby; rentals at typical pace (median 25d on market — plan ~3-4 weeks tenant-placement turnaround); 5,302 units permitted in Queens County in 2024 (4,918 in 5+ unit buildings).
- At $2,975/mo this rent would consume 48% of the median local household income ($74k/yr) (locally 4385% of renters already pay >50% of income on rent) — very limited rent-growth headroom before tenants either downsize or default.
Forward outlook
- Local home prices are declining (-3.0%/yr); year-one equity from $2k of loan paydown is wiped out by about $10k of value loss. Plan a longer hold.
- Queens County population projected at +16% by 2050 — long-run rental-demand tailwind backs the buy-and-hold thesis.
Negotiation context
- Only 3 days on market — expect competitive offers; lowballing is unlikely to land.
- 4 sale attempts since 13y ago with the ask held roughly flat each time — persistent listings suggest the price (not the market) is what's stuck; bring a comps-based counter.
Risks & watch-outs
- Climate carrying-cost: major wind risk, 50% chance of damaging wind over 30y; extreme-heat days projected 7→15/yr by 2055 (HVAC capex compounding) — expect insurance premiums to compound above CPI over the hold.
Questions for the listing agent
- What do current leases actually rent for vs. the listed asking? Can we see a recent rent roll and the last 12 months of T-12 income?
- Have any recent inspections been done? Can we get a copy of the seller's disclosures and any deferred-maintenance estimates?
- Built in 1968 — when were the roof, HVAC, electrical panel, plumbing, and water heater last replaced?
- Any open or pending special assessments — roof, HVAC, plumbing, elevator, façade? What's the per-unit balance and payoff schedule, and is the seller paying it off at close or rolling it to the buyer?
- Is there a deadline driving the sale (1031 exchange, divorce, estate, relocation)? That informs how much negotiation room exists.
- Schools are B-rated — typically a magnet for longer-tenancy family renters. What's the average tenant stay here, and is there a school-zone premium baked into asking?
- Crime grade is F in this area — have there been break-ins, vandalism, or insurance claims at this property in the last 3 years? What carrier currently insures it and at what premium?
- The area grade is low — what's the realistic commute time and amenity access for the typical tenant pool here? Any planned neighborhood developments (good or bad) we should know about?
- What's the average days-on-market for RENTAL listings here right now (not sales)? A rising rental-DOM trend means longer vacancies and softer asking-rent achievability than the comps imply.
- What's the recent tenant-quality profile in this submarket — average credit score on applications, eviction rate, late-payment / NSF rate, and stable-employment percentage? A property-management company in the area should have these aggregated.
- How much new apartment / multifamily construction is in the pipeline within 1–3 miles? Heavy new supply (>2% of stock underway) typically softens rents 12–24 months out; light construction supports rent growth.
Investment metrics
- 1% rule
- 0.85% ✗
- Cap rate
- 6.06%
- Cash-on-cash
- -0.84%
- DSCR
- 0.96
- GRM
- 9.8
CMA / ARV
No comps found within radius.
Projected returns pro-forma
-3.0% appreciation · 0.75% rent growth · sell at horizon
- IRR
- -20.2%
- Equity multiple
- 0.31×
- Total profit
- $-67,637
- Equity at exit
- $52,186
- IRR
- -19.1%
- Equity multiple
- 0.08×
- Total profit
- $-90,190
- Equity at exit
- $30,262
Cash invested: $98,000 (down + closing). Projections, not guarantees.
Landlord ↔ Tenant lean methodology
- Overall (CITY)
- 0 Strongly Tenant-Friendly
- State New York
- 15 Strongly Tenant-Friendly · D+10
- County
- — inherits STATE
- City New York
- 0 Strongly Tenant-Friendly · D+34
ZIP-level market 11432
- Rents YoY
- 0.8%
- Active inventory
- 197
- Price-to-rent
- 9.8×
Monthly cashflow live
- Estimated rent
- $2,975 high interval (Pro) →
- Mortgage (P&I)
- −$1,835
- Tax est. 1.5%
- −$438 /mo · $5,250/yr
- Insurance
- −$146
- HOA
- −$0
- Vacancy / Maint / Mgmt
- −$625
- Net cashflow
- $-69
Break-even live
UW: 25.0% down · 7.5% · 30yr · 1.5% tax · 5.0% vac · 8.0% maint · 8.0% mgmt
Financing live
Cash to close
- Down payment
- $87,500
- Closing costs
- $10,500
- Reserves months
- —
- Total cash needed
- —
Loan-product check · same deal, 3 products live
Conventional
25% down · 7.5% · 30yr
- Down + closing
- —
- Monthly P&I
- —
- Monthly cashflow
- —
- DSCR
- —
- Eligible?
- —
Personal DTI + credit; lowest rate.
DSCR
20% down · 8.5% · 30yr
- Down + closing
- —
- Monthly P&I
- —
- Monthly cashflow
- —
- DSCR
- —
- Eligible?
- —
No personal income docs; deal must DSCR.
Hard money
10% down · 12.0% · 12mo
- Down + closing
- —
- Monthly P&I
- —
- Monthly cashflow
- —
- DSCR
- —
- Eligible?
- —
Short-term bridge; refi at stabilization.
Rent comps 40 comps
| Address | Beds | Baths | Sqft | Rent | $/sqft | DOM | Units | Dist |
|---|---|---|---|---|---|---|---|---|
| 90-48 171st St Jamaica, NY | 2.0 | 1.0 | 1000 | $2,750 | $2.75 | 24d | 1 | 0.14mi |
| 17218 Jamaica Ave Unit 501 Jamaica, NY | 2.0 | 2.0 | 939 | $3,300 | $3.51 | 24d | 1 | 0.22mi |
| 8712 175th St Unit 6B Jamaica, NY | 2.0 | 2.0 | 876 | $3,000 | $3.42 | 24d | 1 | 0.22mi |
| 17545 88th Ave Unit 6F Jamaica, NY | 2.0 | 2.0 | 1224 | $2,950 | $2.41 | 24d | 1 | 0.33mi |
| 177-16 Wexford Ter Unit 401 Jamaica, NY | 1.0 | 1.0 | 700 | $2,600 | $3.71 | 14d | 1 | 0.36mi |
| 177-30 Wexford Ter Apt 806 Jamaica, NY | 2.0 | 1.0 | 1090 | $3,400 | $3.12 | 15d | 1 | 0.38mi |
| 177-30 Wexford Ter Unit 603 Jamaica, NY | 2.0 | 1.0 | 800 | $3,300 | $4.12 | 24d | 1 | 0.38mi |
| 177-30 Wexford Ter Unit 502 Jamaica, NY | 2.0 | 1.0 | 1100 | $3,270 | $2.97 | 12d | 1 | 0.38mi |
| 177-30 Wexford Ter Unit 404 Jamaica, NY | 1.0 | 1.0 | 700 | $2,600 | $3.71 | 3d | 1 | 0.38mi |
| 177-30 Wexford Ter Unit 311 Jamaica, NY | 1.0 | 1.0 | 700 | $2,600 | $3.71 | 14d | 1 | 0.38mi |
| 177-30 Wexford Ter Unit 201 Jamaica, NY | 1.0 | 1.0 | 730 | $2,700 | $3.70 | 3d | 1 | 0.38mi |
| 177-30 Wexford Ter Unit 802 Jamaica, NY | 2.0 | 1.0 | 900 | $3,300 | $3.67 | 3d | 1 | 0.38mi |
| 90-32 179th St Unit 2nd fl Jamaica, NY | 3.0 | 1.0 | 1200 | $3,000 | $2.50 | 24d | 1 | 0.40mi |
| 175-32 Devonshire Rd Unit 1st Floor Jamaica, NY | 3.0 | 2.0 | 1100 | $3,300 | $3.00 | 24d | 1 | 0.42mi |
| 175-32 Devonshire Rd Unit 1st Floor Jamaica, NY | 3.0 | 2.0 | 1100 | $3,300 | $3.00 | 10d | 1 | 0.42mi |
| 84-73 168th Pl Unit 2nd floor Jamaica, NY | 3.0 | 2.0 | 1000 | $3,200 | $3.20 | 19d | 1 | 0.42mi |
| 88-56 162nd St Apt 2D Jamaica, NY | 2.0 | 1.0 | 1000 | $3,000 | $3.00 | 24d | 1 | 0.47mi |
| 103-20 168th Pl Unit 2nd floor Jamaica, NY | 3.0 | 1.0 | 1000 | $2,900 | $2.90 | 24d | 1 | 0.47mi |
| 89-15 Parsons Blvd Unit W6B Jamaica, NY | 1.0 | 1.0 | 725 | $2,100 | $2.90 | 19d | 1 | 0.58mi |
| 105-17 170th St Unit 1 Jamaica, NY | 3.0 | 2.0 | 850 | $3,200 | $3.76 | 24d | 1 | 0.59mi |
| 8311 169th St Jamaica, NY | 3.0 | 2.0 | 1200 | $3,100 | $2.58 | 11d | 1 | 0.63mi |
| 15501 90th Ave Unit 3R Jamaica, NY | 1.0 | 1.0 | 950 | $2,100 | $2.21 | 24d | 1 | 0.66mi |
| 16020 84th Rd Jamaica, NY | 3.0 | 1.5 | 900 | $900 | $1.00 | 17d | 1 | 0.79mi |
| 148-37 88th Ave Queens, NY | 2.0 | 2.0 | 900 | $3,500 | $3.89 | 24d | 1 | 0.85mi |
| 106-12 156th St Unit 2nd Fl Jamaica, NY | 3.0 | 2.0 | 1208 | $3,499 | $2.90 | 24d | 1 | 0.92mi |
| 14832 87th Ave Jamaica, NY | 2.0 | 1.0 | 768 | $2,800 | $3.65 | 19d | 1 | 0.92mi |
| 148-16 87th Ave Unit 2 Jamaica, NY | 2.0 | 1.0 | 700 | $2,300 | $3.29 | 17d | 1 | 0.96mi |
| 10940 175th St Jamaica, NY | 3.0 | 1.5 | 1300 | $4,000 | $3.08 | 19d | 1 | 0.96mi |
| 80-12 165th St Unit 3 Jamaica, NY | 2.0 | 1.5 | 960 | $2,800 | $2.92 | 24d | 1 | 1.07mi |
| 16612 Union Tpke Fresh Meadows, NY | 3.0 | 2.5 | 1292 | $4,900 | $3.79 | 24d | 1 | 1.07mi |
| 17814 80th Dr Jamaica, NY | 3.0 | 1.5 | 1100 | $5,499 | $5.00 | 4d | 1 | 1.09mi |
| 16525 Union Tpke Fresh Meadows, NY | 2.0 | 1.0 | 1000 | $2,900 | $2.90 | 24d | 1 | 1.11mi |
| 190-11 Hillside Ave Apt 202 Hollis, NY | 1.0 | 1.0 | 700 | $2,700 | $3.86 | 24d | 1 | 1.13mi |
| 190-11 Hillside Ave Unit 304 Hollis, NY | 1.0 | 1.0 | 700 | $2,600 | $3.71 | 15d | 1 | 1.13mi |
| 8023 159th St Jamaica, NY | 3.0 | 1.5 | 1392 | $3,000 | $2.16 | 5d | 1 | 1.14mi |
| 88-33 144th St Unit 2nd Fl Jamaica, NY | 3.0 | 1.0 | 1100 | $2,600 | $2.36 | 3d | 1 | 1.14mi |
| 15307 Arlington Ter Jamaica, NY | 3.0 | 1.5 | 1470 | $3,800 | $2.59 | 24d | 1 | 1.14mi |
| 144-07 Jamaica Ave Unit 3rd Floor Jamaica, NY | 3.0 | 2.0 | 800 | $2,750 | $3.44 | 24d | 1 | 1.16mi |
| 16910 77th Rd Fresh Meadows, NY | 3.0 | 3.0 | 1200 | $4,300 | $3.58 | 24d | 1 | 1.16mi |
| 7731 166th St Fresh Meadows, NY | 3.0 | 1.0 | 1000 | $2,700 | $2.70 | 8d | 1 | 1.16mi |
HOA detail condo
- Monthly dues
- $0 · $0/yr
- Assessments
- None detected in remarks — confirm with the listing agent.
Listing history 8 events
-
2026-04-27status Pending
-
2026-04-24$350,000 Active
-
2026-04-17historical
-
2026-01-14$349,000 Active
-
2014-08-18historical
-
2014-02-25$159,000
-
2013-11-13historical
-
2013-02-19$169,000
ⓘ Source: listings_history table (triggers on properties + properties_extension) + one-shot
backfill from property_details.listing_events for pre-trigger history.
Climate risk First Street
- Flood 4/10 Moderate FEMA zone X (unshaded) · 22% chance over 30 yrs
- Wildfire 1/10 Low
- Heat 6/10 Major 7 d/yr ≥99°F today · 15 d/yr by 30 yrs out
- Wind 6/10 Major 50% chance of damaging wind over 30 yrs
- Air quality 4/10 Moderate 6 unhealthy d/yr today · 6 by 30 yrs out
Nearby sold comps map
Loading sold comps map…
Walkable amenities ~0.75 mi
Loading nearby amenities…
Taxation est. · year 1
- Rental income
- $35,696
- − Mortgage interest
- −$19,605
- − Property taxes
- −$5,250
- − Insurance
- −$1,750
- − Repairs & maintenance
- −$2,856
- − Management
- −$2,856
- − Depreciation
- −$10,182
- Taxable loss
- −$6,802
- Est. tax savings @ 24.0%
- +$1,633
- After-tax cash flow
- $807/yr
For passive investors: Depreciation is non-cash, so a rental often shows a tax loss while cash-flowing — sheltering income. Rental losses are passive: they offset passive income freely, and up to $25,000/yr can offset ordinary (W-2) income if you actively participate and your MAGI is under $100k (phasing out to $0 by $150k); unused losses carry forward. On sale, claimed depreciation is recaptured at up to 25%, and gains may owe capital-gains tax (a 1031 exchange can defer both). Figures are a year-1 estimate at your 24.0% rate — not tax advice; consult a CPA.
Condition & rehab AI · 11 photos
This condo is in fair condition with some cosmetic updates needed, such as fresh paint and new carpet, to enhance its resale and rental value.
Repairs flagged
- Minor Paint — Lightly worn paint
- Minor Flooring — Some wear on carpet
Value-add opportunities
- Resale Paint — Fresh paint can make a significant difference in curb appeal
- Rental Flooring — New carpet can make the space more inviting for renters
Renovation cost estimate screening
| Repair item | Severity | Est. cost |
|---|---|---|
| Paint · Lightly worn paint | Minor | $500–3,000 |
| Flooring · Some wear on carpet | Minor | $500–3,000 |
| Total estimated repair cost · 2 items | $1,000–6,000 |
Value-add ROI direction
- Resale Paint — Fresh paint can make a significant difference in curb appeal ↑
- Rental Flooring — New carpet can make the space more inviting for renters ↑
ⓘ Cost ranges are severity-bucket heuristics (US national rule-of-thumb). Get contractor quotes + a written scope before underwriting a rehab budget.
Schools (NCES district)
No district data.
Livability — New York
- Score
- 75/100
- State rank
- #268
- US rank
- #4188
Category grades
Schools grade is shown separately in the Schools card above.
Census & demographics
- Census place
- New York, NY
- County
- Queens County · 1,914,869 people
- City population
- 7,731,280
- Metro
- New York-Newark-Jersey City, NY-NJ-PA
- Population (ZIP)
- 62,892
- Household income
- $74,096
- Rent vs Own
- Severe rent burden
- 4385.0
Population outlook (Queens County) Hauer SSP2
- Today (2025)
- 2,546,320 people
- By 2030
- 2,643,059 · +3.8%
- By 2040
- 2,815,563 · +10.6%
- By 2050
- 2,944,423 · +15.6%
- By 2075
- 3,123,338 · +22.7%
- By 2100
- 3,098,688 · +21.7%
Race, ethnicity, and origin ACS 2023
- Neighborhood character
- Highly diverse neighborhood (Simpson 0.73)
- Race & ethnicity
- Asian 42% Hispanic / Latino 21% Black 17% White 12% Two or more races 8%
- Hispanic origin (detail)
- Mexican 1% Puerto Rican 2% Dominican 2%
- Common ancestry
- Hispanic 3% Scotch-Irish 1% Lithuanian 1%
- Foreign-born
- 57% · Canada, Jamaica, China
- Languages at home
- 34% English-only · Other Indo-European 30% Spanish 19% Tagalog/Filipino 4%
Political lean MEDSL · Queens
- 2024 margin
- Strong D (+24.6) · D 62.3% · R 37.7%
- 2008→2024 swing
- -26.2pp toward R · 2008: 50.8pp · 2024: 24.6pp
- All cycles
- 2024: D+24.6 2020: D+45.2 2016: D+53.4 2012: D+58.5 2008: D+50.8
Not yet ingested
- Civics
- —
Market trends
- HPI YoY
- ▼ -457.06%
- Current HPI
- 282.1513
- Rent YoY
- ▲ 0.75%
- Metro
- New York-Newark-Jersey City, NY-NJ-PA
- State GDP YoY
- ▲ 2.60%
- F500 in state
- 92
Industry mix (Fortune 500 HQ in NY)
| Industry | F500 HQs | Revenue |
|---|---|---|
| Financial Services | 10 | $950B |
|
||
| Consumer Goods | 9 | $162B |
|
||
| Insurance | 4 | $225B |
|
||
| Telecommunications | 2 | $144B |
|
||
| Pharmaceuticals | 2 | $112B |
|
||
| Media / Entertainment | 2 | $69B |
|
||
Price history
+107.1% since first listed8 events — show timeline
- 2026-04-27 Pending — OneKey® MLS as Distributed by MLS Grid
- 2026-04-24 Listed $350,000 OneKey® MLS as Distributed by MLS Grid
- 2026-04-17 Listing Removed — OneKey® MLS as Distributed by MLS Grid
- 2026-01-14 Listed $349,000 OneKey® MLS as Distributed by MLS Grid
- 2014-08-18 Listing Removed — OneKey® MLS as Distributed by MLS Grid
- 2014-02-25 Listed $159,000 OneKey® MLS as Distributed by MLS Grid
- 2013-11-13 Listing Removed — OneKey® MLS as Distributed by MLS Grid
- 2013-02-19 Listed $169,000 OneKey® MLS as Distributed by MLS Grid
Cash-flow waterfall
monthlySold comps — $/sqft
last 12 mo · ≤1 miLoading sold comps…