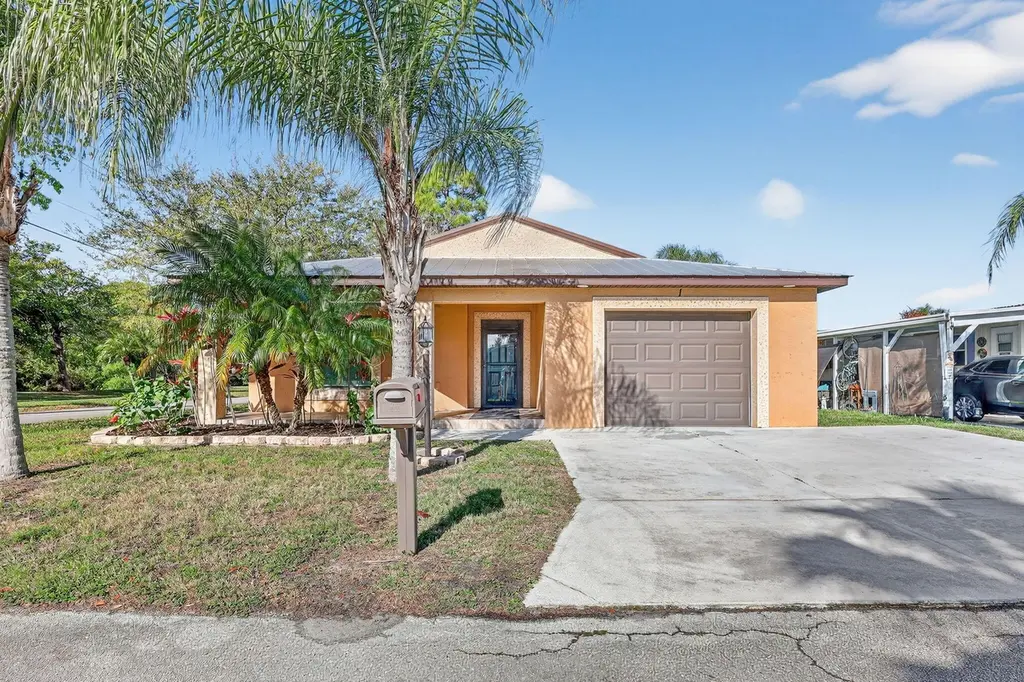
1 Cortez Ln · River Park, FL
Flood risk 1/10 · Minimal
- FEMA flood zone
- X (unshaded)
- Chance of flooding over 30 yrs
- 0.0%
- Est. flood insurance / yr
- $507 – $1,088
Fire risk 3/10 · Minor
- Est. fire insurance / yr
- $947 – $1,759
Heat risk 10/10 · Severe
- Hot days now (above 106°F)
- 7 days/yr
- Hot days in 30 yrs
- 21 days/yr
Wind risk 10/10 · Severe
- Chance of severe wind over 30 yrs
- 99.0%
Air-quality risk 2/10 · Minimal
- Unhealthy air days now
- 1 days/yr
- Unhealthy air days in 30 yrs
- 1 days/yr
Risk factors via First Street. Map © Google.
Why this score? — see what drove the C grade
The composite is a weighted blend of 9 inputs, each scored 0–100. Each bar is that input's sub-score; the figure is the points it added to the 100-point composite (weight × sub-score).
- Cash flow +20.2/30.0
- ARV discount +12.7/15.0
- DSCR +6.4/10.0
- 1% rule +5.6/10.0
- Schools +3.7/10.0
- Livability +3.5/5.0
- Rent growth +3.0/5.0
- Condition / age +2.5/5.0
- Appreciation +0.0/10.0
$190,000
🖨 Deal sheet 📄 Offer letter ✓ Due diligence
Listing remarks
ELEGANT, DURABLE, SAFE & AFFORDABLE this 2019 2bed/2bath home is BUILTtoLAST w/ Concrete Block Construction, IMPACT WINDOWS & MetalRoof built on 5/8'' Plywood for maxstrength. Corner Lot w/ tropical foliage for FrontPorch Privacy. Step inside & beauty continues w/ one of largest potential living space offered; OpenConcept, GRANITECounters, PlantationShutters for lighting & temp control, SS Appl, new Fridge, Garage w/ overheadStorage, Master w/ Walk-in Closet & dbl Sink Ensuite, LRG Window/ Screened Lanai great for Grilling, Greenroom, Den, bedroom & more. PRIMELOCATION; beach, shopping, mall, grocery, bank, hospital, postal & more! Lot Lease 779.45 incl
Key facts
- Metal roof
- Open concept
- Front porch privacy
Tags
Property features AI
Finance
- Other: Pets not allowed
- Financial info: Property is on a land lease (monthly fee; lease expires in the future)
- HOA & community: Located in a senior community; Land lease in place (monthly payment)
Exterior
- Parking: Attached garage (1 space); Covered parking (1 space); Driveway with additional open parking (2 spaces); Total parking for 3 vehicles
- Security: Smoke detectors; Security patrol
- Utilities: Public water; Public sewer; Electricity available; Cable available
- Home design: Single-family residence; One story; Faces east; Resale property
- Construction: Stucco and CBS construction; Metal roof; Built on a single-story foundation
- Exterior features: Corner lot with many trees; Not waterfront
Interior
- Kitchen: Dishwasher; Electric range; Microwave; Refrigerator
- Bedrooms: 2 bedrooms on the main level
- Flooring: Carpet; Tile; Vinyl; Wood; Other
- Bathrooms: 2 full bathrooms on the main level
- Heating & cooling: Central electric heating; Central air conditioning; Ceiling fans
- Interior features: Vaulted ceilings; Walk-in closets; Split bedroom layout; Pull-down attic stairs; Plantation shutters; Storm windows
- Laundry & utility: Indoor laundry room on the main level with washer hookup
Neighborhood map
What this means for you Summary
Snapshot
- This is a 2-bed/2.0-bath single-family listed at $190k.
Deal economics
- At list price, monthly cash flow is $241 ($3k/yr) — positive.
- The deal already cash-flows at list — no discount required.
- Meets the 1% rule at list price ($2k rent vs $190k).
- Recommended offer: $179k (6.0% below list) — sets the bar for market timing.
- Cap rate 7.8% vs local median 6.3% in River Park — meaningfully above typical; check what's discounted (condition, days-on-market, listing class) to confirm the premium yield is real.
Location & tenants
- Location reads 69/100 on livability (#451 in FL) — a middle-class / working-renter tenant base. Strengths: cost of living A+, housing A+, commute A-; Watch: schools F, amenities F, employment F.
- St. Lucie (urban): math 40% / reading 48% proficiency, ranked #51 of 73 in FL (top 70%) — families likely to look elsewhere, expect single-tenant / working-renter base with shorter leases.
- Market conditions: Rents rising (+1.9%/yr); 639 active listings in the ZIP; 11 comparable units currently listed for rent nearby; rentals at typical pace (median 24d on market — plan ~3-4 weeks tenant-placement turnaround); 4,868 units permitted in St. Lucie County in 2024 (268 in 5+ unit buildings).
- This rent runs 39% of the median local income ($62k/yr) — at the standard rent-burdened threshold; future hikes will face affordability resistance.
Forward outlook
- Local home prices are declining (-3.0%/yr); year-one equity from $1k of loan paydown is wiped out by about $6k of value loss. Plan a longer hold.
- St. Lucie County population projected at +20% by 2050 — long-run rental-demand tailwind backs the buy-and-hold thesis.
Negotiation context
- It's been on market 88 days — a 6% lower offer ($179k) is reasonable based on typical stale-listing flexibility.
- 8 sale attempts since 8y ago with the ask held roughly flat each time — persistent listings suggest the price (not the market) is what's stuck; bring a comps-based counter.
Risks & watch-outs
- Climate carrying-cost: severe wind risk, 99% chance of damaging wind over 30y; extreme-heat days projected 7→21/yr by 2055 (HVAC capex compounding) — expect insurance premiums to compound above CPI over the hold.
Questions for the listing agent
- It's been on market 88 days. Have you received any prior offers? Is the seller open to a 6% concession, seller financing, or rate buy-down credit?
- Why hasn't it sold? Are there any deal-killer items the seller is aware of (foundation, flood, title, zoning, code violations)?
- Is there a deadline driving the sale (1031 exchange, divorce, estate, relocation)? That informs how much negotiation room exists.
- Schools are F-rated, which usually means shorter tenancies and higher turnover. Who's the typical renter profile here, and what's been the actual vacancy rate?
- What's the average days-on-market for RENTAL listings here right now (not sales)? A rising rental-DOM trend means longer vacancies and softer asking-rent achievability than the comps imply.
- What's the recent tenant-quality profile in this submarket — average credit score on applications, eviction rate, late-payment / NSF rate, and stable-employment percentage? A property-management company in the area should have these aggregated.
- How much new for-sale + rental construction is in the pipeline within 1–3 miles? Heavy new supply typically softens prices + rents 12–24 months out; constrained supply supports both.
Investment metrics
- 1% rule
- 1.06% ✓
- Cap rate
- 7.82%
- Cash-on-cash
- 5.45%
- DSCR
- 1.24
- GRM
- 7.9
CMA / ARV
- ARV (on-the-fly)
- $215,061
- Comps found
- 10
Show comp detail 10 sales within ~0.75 mi
| Address | Dist | Beds/Ba | Sqft | Sold | Price | $/sf | Match |
|---|---|---|---|---|---|---|---|
| 53 El Camino Real | 0.47mi | 2/2.0 | 1,462 (-0%) | 1mo | $259,000 | $177 | 77 |
| 9 Kachina Ln | 0.46mi | 2/2.0 | 1,462 (-0%) | 2mo | $259,000 | $177 | 77 |
| 8 Golf Dr | 0.21mi | 2/2.0 | 1,427 (-2%) | 13mo | $160,000 | $112 | 75 |
| 45 Florida Way | 0.49mi | 2/2.0 | 1,451 (-1%) | 2mo | $165,000 | $114 | 74 |
| 39 SE Flamenco Way | 0.26mi | 2/2.0 | 1,357 (-7%) | 6mo | $200,000 | $147 | 71 |
| 11 Nogales Way | 0.40mi | 2/2.0 | 1,451 (-1%) | 15mo | $205,000 | $141 | 68 |
| 20 Camino Del Rio | 0.66mi | 2/2.0 | 1,446 (-1%) | 5mo | $259,000 | $179 | 63 |
| 8 Santa Maria Ct | 0.57mi | 2/2.0 | 1,319 (-10%) | 3mo | $145,000 | $110 | 55 |
| 8241 Maidencane Pl | 0.29mi | 3/2.0 (+1) | 1,656 (+13%) | 12mo | $360,000 | $217 | 49 |
| 45 Huarte Way | 0.63mi | 2/2.0 | 1,319 (-10%) | 13mo | $142,000 | $108 | 43 |
Match score weights: distance 35% · size 25% · config 20% · recency 20%. Top-matched comps best support the ARV.
Projected returns pro-forma
-3.0% appreciation · 1.92% rent growth · sell at horizon
- IRR
- -9.1%
- Equity multiple
- 0.67×
- Total profit
- $-17,519
- Equity at exit
- $28,330
- IRR
- -1.1%
- Equity multiple
- 0.93×
- Total profit
- $-3,922
- Equity at exit
- $16,428
Cash invested: $53,200 (down + closing). Projections, not guarantees.
Landlord ↔ Tenant lean methodology
- Overall (STATE)
- 87 Strongly Landlord-Friendly
- State Florida
- 87 Strongly Landlord-Friendly · R+3
- County
- — inherits STATE
- City
- — inherits STATE
ZIP-level market 34952
- Home prices YoY
- -29.6%
- Rents YoY
- 1.9%
- Active inventory
- 639
- Price-to-rent
- 7.9×
Monthly cashflow live
- Estimated rent
- $2,011 high interval (Pro) →
- Mortgage (P&I)
- −$996
- Tax from tax record
- −$271 /mo · $3,257/yr
- Insurance
- −$79
- HOA
- −$0
- Vacancy / Maint / Mgmt
- −$422
- Net cashflow
- $241
Break-even live
UW: 25.0% down · 7.5% · 30yr · 1.5% tax · 5.0% vac · 8.0% maint · 8.0% mgmt
Financing live
Cash to close
- Down payment
- $47,500
- Closing costs
- $5,700
- Reserves months
- —
- Total cash needed
- —
Loan-product check · same deal, 3 products live
Conventional
25% down · 7.5% · 30yr
- Down + closing
- —
- Monthly P&I
- —
- Monthly cashflow
- —
- DSCR
- —
- Eligible?
- —
Personal DTI + credit; lowest rate.
DSCR
20% down · 8.5% · 30yr
- Down + closing
- —
- Monthly P&I
- —
- Monthly cashflow
- —
- DSCR
- —
- Eligible?
- —
No personal income docs; deal must DSCR.
Hard money
10% down · 12.0% · 12mo
- Down + closing
- —
- Monthly P&I
- —
- Monthly cashflow
- —
- DSCR
- —
- Eligible?
- —
Short-term bridge; refi at stabilization.
Rent comps 11 comps
| Address | Beds | Baths | Sqft | Rent | $/sqft | DOM | Units | Dist |
|---|---|---|---|---|---|---|---|---|
| 1900 Bella Vista Way Port Saint Lucie, FL | 1.0–2.0 | 1.0–2.0 | 995 | $1,764 | $1.77 | 14d | 15 | 0.56mi |
| 730 SE White Ave Port Saint Lucie, FL | 2.0 | 2.0 | 1386 | $10,000 | $7.22 | 23d | 1 | 1.13mi |
| 805 SE Cavern Ave Port Saint Lucie, FL | 3.0 | 2.0 | 1732 | $2,500 | $1.44 | 23d | 1 | 1.13mi |
| 7700 Pine Lakes Blvd Port Saint Lucie, FL | 1.0–3.0 | 1.0–2.0 | 1022 | $1,878 | $1.84 | 14d | 16 | 1.13mi |
| 124 E Arbor Ave Port Saint Lucie, FL | 3.0 | 1.0 | 964 | $2,550 | $2.65 | 14d | 1 | 1.21mi |
| 1810 SE Pinewood Trl Port Saint Lucie, FL | 1.0–2.0 | 1.0–2.0 | 1013 | $2,055 | $2.03 | 14d | 7 | 1.30mi |
| 71 W Caribbean Port St. Lucie, FL | 2.0 | 2.0 | 1417 | $1,700 | $1.20 | 23d | 1 | 1.36mi |
| 14 Lake Vista Trl #101 Port Saint Lucie, FL | 2.0 | 2.0 | 1170 | $2,200 | $1.88 | 23d | 1 | 1.41mi |
| 991 SE Walters Ter Port Saint Lucie, FL | 2.0 | 2.0 | 1040 | $8,500 | $8.17 | 23d | 1 | 1.45mi |
| 11 Lake Vista Trl #206 Port Saint Lucie, FL | 2.0 | 2.0 | 1080 | $1,400 | $1.30 | 23d | 1 | 1.46mi |
| 650 SE Evergreen Ter Port Saint Lucie, FL | 2.0 | 2.0 | 974 | $2,095 | $2.15 | 14d | 1 | 1.47mi |
Listing history 44 events
-
2026-06-18days on market $190,000 Active 88 DOM
-
2026-06-17days on market $190,000 Active 87 DOM
-
2026-06-16days on market $190,000 Active 86 DOM
-
2026-06-15days on market $190,000 Active 85 DOM
-
2026-06-14days on market $190,000 Active 83 DOM
-
2026-06-13days on market $190,000 Active 82 DOM
-
2026-06-10days on market $190,000 Active 80 DOM
-
2026-06-09days on market $190,000 Active 79 DOM
-
2026-06-08days on market $190,000 Active 78 DOM
-
2026-06-07days on market $190,000 Active 77 DOM
-
2026-06-05days on market $190,000 Active 74 DOM
-
2026-06-03days on market $190,000 Active 73 DOM
-
2026-06-02days on market $190,000 Active 72 DOM
-
2026-06-01days on market $190,000 Active 71 DOM
-
2026-05-31days on market $190,000 Active 70 DOM
-
2026-05-30days on market $190,000 Active 69 DOM
-
2026-03-22$190,000 Active
-
2026-03-12historical
-
2026-01-28price $192,000
-
2025-12-08$207,000 Active
-
2025-12-01historical
-
2025-10-29price $199,700
-
2025-10-16status Active
-
2025-10-03historical
-
2025-09-10price $228,300
-
2025-08-21price $248,400
-
2025-04-02$264,600 Active
-
2024-07-19soldstatus $195,000 Closed
-
2024-06-18historical Active Under Contract
-
2024-05-16price $199,000
-
2024-04-26$210,000 Active
-
2024-04-25historical $210,000
-
2024-04-22historical
-
2024-01-29$214,000 Active
-
2023-03-07soldstatus $182,500 Closed
-
2023-01-26historical Active Under Contract
-
2022-12-13price $200,000
-
2022-11-15price $225,000
-
2022-10-27$235,000 Active
-
2018-11-26soldstatus $145,000 Closed
-
2018-10-23historical Contingent
-
2018-04-18price $145,000
-
2018-02-22price $140,000
-
2018-02-22$129,000 Active
ⓘ Source: listings_history table (triggers on properties + properties_extension) + one-shot
backfill from property_details.listing_events for pre-trigger history.
Tax reassessment forecast FL · Resets to sale price
- Current annual tax
- $3,257 · $271/mo
- Projected year-2 tax
- $3,257 · $271/mo
- Expected delta
- $0/yr ($0/mo · 0.0%)
ⓘ Screening estimate from a state-policy table — verify with the county assessor before closing.
Climate risk First Street
- Flood 1/10 Low FEMA zone X (unshaded) · 0% chance over 30 yrs
- Wildfire 3/10 Moderate
- Heat 10/10 Extreme 7 d/yr ≥106°F today · 21 d/yr by 30 yrs out
- Wind 10/10 Extreme 99% chance of damaging wind over 30 yrs
- Air quality 2/10 Low 1 unhealthy d/yr today · 1 by 30 yrs out
Nearby sold comps map
Loading sold comps map…
Walkable amenities ~0.75 mi
Loading nearby amenities…
Taxation est. · year 1
- Rental income
- $24,128
- − Mortgage interest
- −$10,643
- − Property taxes
- −$3,257
- − Insurance
- −$950
- − Repairs & maintenance
- −$1,930
- − Management
- −$1,930
- − Depreciation
- −$5,527
- Taxable loss
- −$109
- Est. tax savings @ 24.0%
- +$26
- After-tax cash flow
- $2,924/yr
For passive investors: Depreciation is non-cash, so a rental often shows a tax loss while cash-flowing — sheltering income. Rental losses are passive: they offset passive income freely, and up to $25,000/yr can offset ordinary (W-2) income if you actively participate and your MAGI is under $100k (phasing out to $0 by $150k); unused losses carry forward. On sale, claimed depreciation is recaptured at up to 25%, and gains may owe capital-gains tax (a 1031 exchange can defer both). Figures are a year-1 estimate at your 24.0% rate — not tax advice; consult a CPA.
Schools (NCES district)
- District
- St. Lucie
- NCES district ID
- 1201770
- Math proficiency
- 40% ▼ -11.00%
- Reading proficiency
- 48% ▼ -4.00%
- Median HH income
- $44,737
- Composite
- 37.28/100
- National rank
- #4449
- State rank
- #51 of 73 in FL
Livability — River Park
- Score
- 69/100
- State rank
- #451
- US rank
- #8159
Category grades
Schools grade is shown separately in the Schools card above.
Census & demographics
- County
- Saint Lucie County · 337,150 people
- Metro
- Port St. Lucie, FL
- Population (ZIP)
- 42,655
- Household income
- $61,628
- Rent vs Own
- Severe rent burden
- 1759.0
Population outlook (St. Lucie County) Hauer SSP2
- Today (2025)
- 338,016 people
- By 2030
- 355,687 · +5.2%
- By 2040
- 385,521 · +14.1%
- By 2050
- 406,106 · +20.1%
- By 2075
- 441,054 · +30.5%
- By 2100
- 436,885 · +29.2%
Race, ethnicity, and origin ACS 2023
- Neighborhood character
- Diverse neighborhood (Simpson 0.57)
- Race & ethnicity
- White 62% Hispanic / Latino 19% Two or more races 14% Black 10% Asian 3%
- Hispanic origin (detail)
- Mexican 4% Puerto Rican 4% Cuban 2% Dominican 2%
- Common ancestry
- Romanian 3% Lithuanian 2% Hispanic 1%
- Foreign-born
- 18% · Canada, Jamaica, China
- Languages at home
- 76% English-only · Spanish 16% French/Haitian/Cajun 3% Tagalog/Filipino 2%
Political lean MEDSL · St. Lucie
- 2024 margin
- Lean R (+9.1) · D 45.1% · R 54.2%
- 2008→2024 swing
- -21.2pp toward R · 2008: 12.1pp · 2024: -9.1pp
- All cycles
- 2024: R+9.1 2020: R+1.6 2016: R+2.5 2012: D+7.9 2008: D+12.1
Not yet ingested
- Civics
- —
Market trends
- HPI YoY
- ▼ -155.80%
- Current HPI
- 371.0573
- Rent YoY
- ▲ 1.92%
- Metro
- Port St. Lucie, FL
- State GDP YoY
- ▲ 3.28%
- F500 in state
- 36
Industry mix (Fortune 500 HQ in FL)
| Industry | F500 HQs | Revenue |
|---|---|---|
| Industrial Technology | 2 | $29B |
|
||
| Insurance | 2 | $17B |
|
||
| Retail | 1 | $60B |
|
||
| Technology Distribution | 1 | $58B |
|
||
| Homebuilding | 1 | $35B |
|
||
| Technology Manufacturing | 1 | $35B |
|
||
Price history
+47.3% since first listed28 events — show timeline
- 2026-03-22 Listed $190,000 Beaches MLS
- 2026-03-12 Listing Removed — Beaches MLS
- 2026-01-28 Price Changed $192,000 Beaches MLS
- 2025-12-08 Listed $207,000 Beaches MLS
- 2025-12-01 Listing Removed — Beaches MLS
- 2025-10-29 Price Changed $199,700 Beaches MLS
- 2025-10-16 Relisted — Beaches MLS
- 2025-10-03 Listing Removed — Beaches MLS
- 2025-09-10 Price Changed $228,300 Beaches MLS
- 2025-08-21 Price Changed $248,400 Beaches MLS
- 2025-04-02 Listed $264,600 Beaches MLS
- 2024-07-19 Sold (MLS) $195,000 Beaches MLS
- 2024-06-18 Contingent — Beaches MLS
- 2024-05-16 Price Changed $199,000 Beaches MLS
- 2024-04-26 Listed $210,000 Beaches MLS
- 2024-04-25 Coming Soon $210,000 Beaches MLS
- 2024-04-22 Listing Removed — MARMLS
- 2024-01-29 Listed $214,000 MARMLS
- 2023-03-07 Sold (MLS) $182,500 Beaches MLS
- 2023-01-26 Contingent — Beaches MLS
- 2022-12-13 Price Changed $200,000 Beaches MLS
- 2022-11-15 Price Changed $225,000 Beaches MLS
- 2022-10-27 Listed $235,000 Beaches MLS
- 2018-11-26 Sold (MLS) $145,000 Beaches MLS
- 2018-10-23 Contingent — Beaches MLS
- 2018-04-18 Price Changed $145,000 Beaches MLS
- 2018-02-22 Price Changed $140,000 Beaches MLS
- 2018-02-22 Listed $129,000 Beaches MLS
Property tax history
+58.2%/yrLatest (2025): $3,257 · +0.3% YoY. Source: county tax records.
Cash-flow waterfall
monthlySold comps — $/sqft
last 12 mo · ≤1 miLoading sold comps…