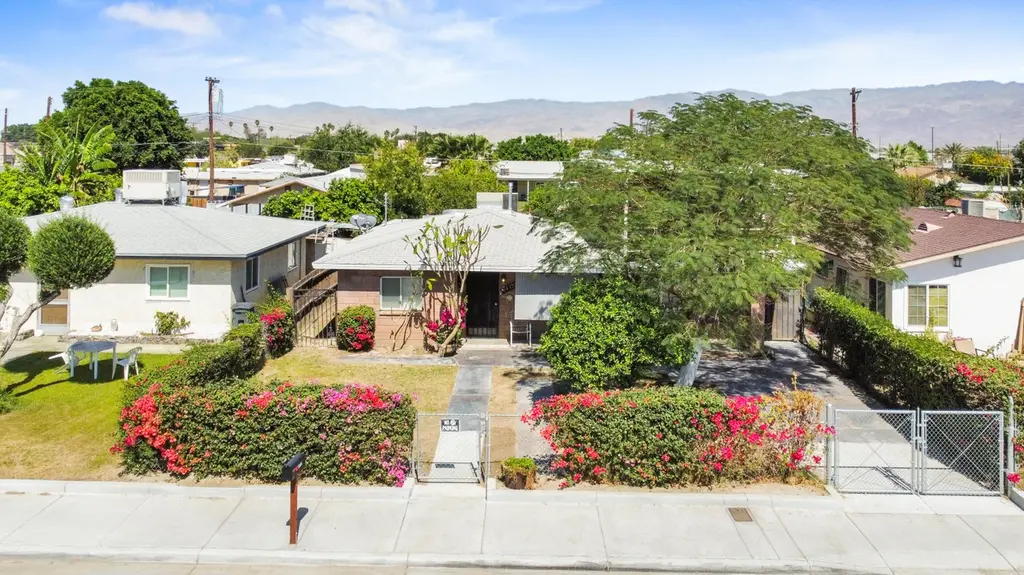
84172 Avenue 48 · Coachella, CA
Flood risk 1/10 · Minimal
- FEMA flood zone
- X (unshaded)
- Chance of flooding over 30 yrs
- 0.0%
- Est. flood insurance / yr
- $507 – $1,088
Fire risk 7/10 · Major
- Est. fire insurance / yr
- $659 – $1,223
Heat risk 10/10 · Severe
- Hot days now (above 115°F)
- 7 days/yr
- Hot days in 30 yrs
- 19 days/yr
Wind risk 1/10 · Minimal
- Chance of severe wind over 30 yrs
- —
Air-quality risk 3/10 · Minor
- Unhealthy air days now
- 3 days/yr
- Unhealthy air days in 30 yrs
- 5 days/yr
Risk factors via First Street. Map © Google.
Why this score? — see what drove the C grade
The composite is a weighted blend of 9 inputs, each scored 0–100. Each bar is that input's sub-score; the figure is the points it added to the 100-point composite (weight × sub-score).
- Cash flow +21.3/30.0
- ARV discount +13.7/15.0
- DSCR +6.8/10.0
- 1% rule +4.6/10.0
- Schools +3.8/10.0
- Rent growth +3.3/5.0
- Condition / age +2.5/5.0
- Livability +2.4/5.0
- Appreciation +0.0/10.0
$399,000
🖨 Deal sheet 📄 Offer letter ✓ Due diligence
Listing remarks
Welcome to this well-maintained and versatile property located in the rapidly growing city of Indio. Offering 5 bedrooms and 2 bathrooms across 1,645 square feet of living space, this home provides both comfort and flexibility for a variety of lifestyles. One of the standout features is the expansive yard, offering endless possibilities. Whether you're a passionate gardener, need space for outdoor projects, recreational use, or are looking to create your own private retreat, this property delivers the room to make it happen. The large lot provides a rare opportunity to truly customize and maximize outdoor living. The home reflects pride of ownership throughout, with care and attention evide
Key facts
- Expansive yard
- Large lot
- 6,970 sq ft lot
Tags
Property features AI
Finance
- Other: Fee simple ownership; Lot and square-foot data source: Assessor; Property sold as-is
- Financial info: Probate listing; Acceptable financing: Conventional, VA, FHA, Cash to new loan, Cash; Short-term rentals allowed; Possession at close of escrow
- HOA & community: No monthly association fee; Not a gated community
Exterior
- Parking: On-street parking; Other parking available
- Utilities: Sewer connected and paid; No PUD
- Home design: Detached single-family home; Two stories; Year built per assessor
- Exterior features: Mountain view; No security features listed
Interior
- Flooring: Carpet; Linoleum
- Bathrooms: 2 full bathrooms
- Heating & cooling: Central heating; Air conditioning
- Interior features: Unfurnished; Dining room; Family room; No fireplace
Neighborhood map
What this means for you Summary
Snapshot
- This is a 5-bed/2.0-bath single-family listed at $399k.
Deal economics
- At list price, monthly cash flow is $581 ($7k/yr) — positive.
- The deal already cash-flows at list — no discount required.
- To meet the 1% rule (rent ≥ 1% of price), the offer needs to be $381k (4.5% below list).
- Recommended offer: $375k (6.0% below list) — sets the bar for market timing.
- Cap rate 8.0% vs local median 4.4% in Coachella — top-decile yield for the area; either an underpriced asset or a hidden risk that comps aren't pricing in. Stress-test before assuming the spread holds.
Location & tenants
- Location reads 47/100 on livability (#1,230 in CA) — a working-class tenant base; expect higher turnover. Watch: schools F, amenities F, commute F.
- Desert Sands Unified (suburban): math 31% / reading 56% proficiency, ranked #199 of 517 in CA (top 38%) — families likely to look elsewhere, expect single-tenant / working-renter base with shorter leases.
- Market conditions: Rents rising (+3.3%/yr); 514 active listings in the ZIP; 8 comparable units currently listed for rent nearby; rentals lingering (median 44d on market — plan ~5-8 weeks vacancy on turnover, expect pricing pressure); 62% of comp listings sitting > 30 days — soft ceiling on asking rent; 9,195 units permitted in Riverside County in 2024 (1,512 in 5+ unit buildings).
- At $3,811/mo this rent would consume 68% of the median local household income ($67k/yr) (locally 2036% of renters already pay >50% of income on rent) — very limited rent-growth headroom before tenants either downsize or default.
Forward outlook
- Local home prices are declining (-3.0%/yr); year-one equity from $3k of loan paydown is wiped out by about $12k of value loss. Plan a longer hold.
- Riverside County population projected at +22% by 2050 — long-run rental-demand tailwind backs the buy-and-hold thesis.
Negotiation context
- It's been on market 76 days — a 6% lower offer ($375k) is reasonable based on typical stale-listing flexibility.
- Current owner paid $10k; list at $399k implies a 3890% gain — meaningful room to come down on a strong offer.
Risks & watch-outs
- Watch-outs: built in 1958 — expect roof / HVAC / electrical / plumbing capex.
- Climate carrying-cost: major wildfire risk; extreme-heat days projected 7→19/yr by 2055 (HVAC capex compounding) — expect insurance premiums to compound above CPI over the hold.
Questions for the listing agent
- It's been on market 76 days. Have you received any prior offers? Is the seller open to a 6% concession, seller financing, or rate buy-down credit?
- Built in 1958 — when were the roof, HVAC, electrical panel, plumbing, and water heater last replaced?
- Why hasn't it sold? Are there any deal-killer items the seller is aware of (foundation, flood, title, zoning, code violations)?
- Is there a deadline driving the sale (1031 exchange, divorce, estate, relocation)? That informs how much negotiation room exists.
- Schools are F-rated, which usually means shorter tenancies and higher turnover. Who's the typical renter profile here, and what's been the actual vacancy rate?
- What's the average days-on-market for RENTAL listings here right now (not sales)? A rising rental-DOM trend means longer vacancies and softer asking-rent achievability than the comps imply.
- What's the recent tenant-quality profile in this submarket — average credit score on applications, eviction rate, late-payment / NSF rate, and stable-employment percentage? A property-management company in the area should have these aggregated.
- How much new for-sale + rental construction is in the pipeline within 1–3 miles? Heavy new supply typically softens prices + rents 12–24 months out; constrained supply supports both.
Investment metrics
- 1% rule
- 0.96% ✗
- Cap rate
- 8.04%
- Cash-on-cash
- 6.24%
- DSCR
- 1.28
- GRM
- 8.7
CMA / ARV
- ARV (on-the-fly)
- $462,245
- Comps found
- 7
Show comp detail 7 sales within ~0.75 mi
| Address | Dist | Beds/Ba | Sqft | Sold | Price | $/sf | Match |
|---|---|---|---|---|---|---|---|
| 84172 Avenue 48 | 0.00mi | 5/2.0 | 1,645 (0%) | 1mo | $395,000 | $240 | 100 |
| 47727 Phoenix St | 0.67mi | 4/2.0 (-1) | 1,708 (+4%) | 4mo | $468,000 | $274 | 54 |
| 83645 Palomar Ct Ct | 0.48mi | 4/2.0 (-1) | 1,798 (+9%) | 14mo | $570,000 | $317 | 46 |
| 49071 Sierra St | 0.59mi | 4/2.0 (-1) | 1,428 (-13%) | 9mo | $459,900 | $322 | 38 |
| 49235 Summer St | 0.70mi | 4/2.0 (-1) | 1,428 (-13%) | 3mo | $395,000 | $277 | 38 |
| 83643 Mccoy Peak Ave | 0.55mi | 4/2.0 (-1) | 1,798 (+9%) | 22mo | $505,000 | $281 | 36 |
| 84086 Magnolia St | 0.70mi | 4/2.0 (-1) | 1,428 (-13%) | 9mo | $450,000 | $315 | 33 |
Match score weights: distance 35% · size 25% · config 20% · recency 20%. Top-matched comps best support the ARV.
Projected returns pro-forma
-3.0% appreciation · 3.34% rent growth · sell at horizon
- IRR
- -6.4%
- Equity multiple
- 0.76×
- Total profit
- $-26,490
- Equity at exit
- $59,492
- IRR
- 3.6%
- Equity multiple
- 1.26×
- Total profit
- $29,397
- Equity at exit
- $34,498
Cash invested: $111,720 (down + closing). Projections, not guarantees.
Landlord ↔ Tenant lean methodology
- Overall (STATE)
- 18 Strongly Tenant-Friendly
- State California
- 18 Strongly Tenant-Friendly · D+13
- County
- — inherits STATE
- City
- — inherits STATE
ZIP-level market 92201
- Home prices YoY
- -28.4%
- Rents YoY
- 3.3%
- Active inventory
- 514
- Price-to-rent
- 8.7×
Monthly cashflow live
- Estimated rent
- $3,811 high interval (Pro) →
- Mortgage (P&I)
- −$2,092
- Tax from tax record
- −$171 /mo · $2,049/yr
- Insurance
- −$166
- HOA
- −$0
- Vacancy / Maint / Mgmt
- −$800
- Net cashflow
- $581
Break-even live
UW: 25.0% down · 7.5% · 30yr · 1.5% tax · 5.0% vac · 8.0% maint · 8.0% mgmt
Financing live
Cash to close
- Down payment
- $99,750
- Closing costs
- $11,970
- Reserves months
- —
- Total cash needed
- —
Loan-product check · same deal, 3 products live
Conventional
25% down · 7.5% · 30yr
- Down + closing
- —
- Monthly P&I
- —
- Monthly cashflow
- —
- DSCR
- —
- Eligible?
- —
Personal DTI + credit; lowest rate.
DSCR
20% down · 8.5% · 30yr
- Down + closing
- —
- Monthly P&I
- —
- Monthly cashflow
- —
- DSCR
- —
- Eligible?
- —
No personal income docs; deal must DSCR.
Hard money
10% down · 12.0% · 12mo
- Down + closing
- —
- Monthly P&I
- —
- Monthly cashflow
- —
- DSCR
- —
- Eligible?
- —
Short-term bridge; refi at stabilization.
Rent comps 8 comps
| Address | Beds | Baths | Sqft | Rent | $/sqft | DOM | Units | Dist |
|---|---|---|---|---|---|---|---|---|
| 49115 Mesa Ct Coachella, CA | 5.0 | 2.0 | 2000 | $3,200 | $1.60 | 43d | 1 | 0.74mi |
| 83589 Shadowrock Dr Coachella, CA | 4.0 | 3.0 | 1679 | $4,300 | $2.56 | 43d | 1 | 1.10mi |
| 47519 Margarita St Indio, CA | 4.0 | 3.0 | 2125 | $3,999 | $1.88 | 43d | 1 | 1.18mi |
| 83110 Raven Ln Indio, CA | 4.0 | 3.0 | 1890 | $3,500 | $1.85 | 11d | 1 | 1.23mi |
| 82934 Via Venecia Indio, CA | 5.0 | 3.0 | 1593 | $3,700 | $2.32 | 2d | 1 | 1.27mi |
| 82798 Longfellow Ct Indio, CA | 4.0 | 3.0 | 2014 | $4,500 | $2.23 | 43d | 1 | 1.40mi |
| 50157 Calle Tolosa Coachella, CA | 4.0 | 3.5 | 1912 | $3,414 | $1.79 | 11d | 1 | 1.44mi |
| 83958 Calle Moreno Coachella, CA | 4.0 | 2.0 | 2000 | $3,350 | $1.68 | 43d | 1 | 1.45mi |
Listing history 8 events
-
2026-06-04status $399,000 Pending 76 DOM
-
2026-06-03days on market $399,000 Active Under Contract 76 DOM
-
2026-06-02days on market $399,000 Active Under Contract 75 DOM
-
2026-06-01days on market $399,000 Active Under Contract 74 DOM
-
2026-05-31days on market $399,000 Active Under Contract 73 DOM
-
2026-04-21historical Active Under Contract
-
2026-03-19$399,000 Active
-
1976-09-01soldstatus $10,000
ⓘ Source: listings_history table (triggers on properties + properties_extension) + one-shot
backfill from property_details.listing_events for pre-trigger history.
Tax reassessment forecast CA · Resets to sale price
- Current annual tax
- $2,049 · $171/mo
- Projected year-2 tax
- $3,032 · $253/mo
- Expected delta
- +$983/yr (+$82/mo · 48.0%)
ⓘ Screening estimate from a state-policy table — verify with the county assessor before closing.
Climate risk First Street
- Flood 1/10 Low FEMA zone X (unshaded) · 0% chance over 30 yrs
- Wildfire 7/10 Severe
- Heat 10/10 Extreme 7 d/yr ≥115°F today · 19 d/yr by 30 yrs out
- Wind 1/10 Low
- Air quality 3/10 Moderate 3 unhealthy d/yr today · 5 by 30 yrs out
Nearby sold comps map
Loading sold comps map…
Walkable amenities ~0.75 mi
Loading nearby amenities…
Taxation est. · year 1
- Rental income
- $45,727
- − Mortgage interest
- −$22,350
- − Property taxes
- −$2,049
- − Insurance
- −$1,995
- − Repairs & maintenance
- −$3,658
- − Management
- −$3,658
- − Depreciation
- −$11,607
- Taxable income
- $409
- Est. tax owed @ 24.0%
- −$98
- After-tax cash flow
- $6,873/yr
For passive investors: Depreciation is non-cash, so a rental often shows a tax loss while cash-flowing — sheltering income. Rental losses are passive: they offset passive income freely, and up to $25,000/yr can offset ordinary (W-2) income if you actively participate and your MAGI is under $100k (phasing out to $0 by $150k); unused losses carry forward. On sale, claimed depreciation is recaptured at up to 25%, and gains may owe capital-gains tax (a 1031 exchange can defer both). Figures are a year-1 estimate at your 24.0% rate — not tax advice; consult a CPA.
Schools (NCES district)
- District
- Desert Sands Unified
- NCES district ID
- 0611110
- Math proficiency
- 31% ▼ -4.00%
- Reading proficiency
- 56% ▲ 7.00%
- Median HH income
- $54,957
- Composite
- 37.77/100
- National rank
- #4346
- State rank
- #199 of 517 in CA
Livability — Coachella
- Score
- 47/100
- State rank
- #1230
- US rank
- #26216
Category grades
Schools grade is shown separately in the Schools card above.
Census & demographics
- County
- Riverside County · 2,287,001 people
- Metro
- Riverside-San Bernardino-Ontario, CA
- Population (ZIP)
- 65,825
- Household income
- $66,758
- Rent vs Own
- Severe rent burden
- 2036.0
Population outlook (Riverside County) Hauer SSP2
- Today (2025)
- 2,664,475 people
- By 2030
- 2,802,692 · +5.2%
- By 2040
- 3,050,904 · +14.5%
- By 2050
- 3,256,783 · +22.2%
- By 2075
- 3,655,058 · +37.2%
- By 2100
- 3,766,594 · +41.4%
Race, ethnicity, and origin ACS 2023
- Neighborhood character
- Predominantly Hispanic (74%)
- Race & ethnicity
- Hispanic / Latino 74% Two or more races 39% White 19% Black 3% Asian 3% Native American 1%
- Hispanic origin (detail)
- Mexican 69%
- Common ancestry
- Romanian 1% Iranian 1%
- Foreign-born
- 29% · Canada, Vietnam, Jamaica
- Languages at home
- 41% English-only · Spanish 55% Arabic 1% Tagalog/Filipino 1%
Political lean MEDSL · Riverside
- 2024 margin
- Toss-up / Even · D 48.0% · R 49.3% · Other 2.6%
- 2008→2024 swing
- -3.6pp toward R · 2008: 2.3pp · 2024: -1.3pp
- All cycles
- 2024: R+1.3 2020: D+8.0 2016: D+4.3 2012: R+0.4 2008: D+2.3
Not yet ingested
- Civics
- —
Market trends
- HPI YoY
- ▼ -138.46%
- Current HPI
- 348.6605
- Rent YoY
- ▲ 3.34%
- Metro
- Riverside-San Bernardino-Ontario, CA
- State GDP YoY
- ▲ 3.21%
- F500 in state
- 116
Industry mix (Fortune 500 HQ in CA)
| Industry | F500 HQs | Revenue |
|---|---|---|
| Technology | 27 | $1,492B |
|
||
| Financial Services | 3 | $174B |
|
||
| Retail | 3 | $44B |
|
||
| Insurance | 3 | $26B |
|
||
| Media / Entertainment | 2 | $115B |
|
||
| Pharmaceuticals / Biotech | 2 | $62B |
|
||
Price history
+3890.0% since first listed3 events — show timeline
- 2026-04-21 Contingent — GPSMLS
- 2026-03-19 Listed $399,000 GPSMLS
- 1976-09-01 Sold (Public Records) $10,000 Public Records
Property tax history
+2.4%/yrLatest (2025): $2,049 · +1.9% YoY. Source: county tax records.
Cash-flow waterfall
monthlySold comps — $/sqft
last 12 mo · ≤1 miLoading sold comps…