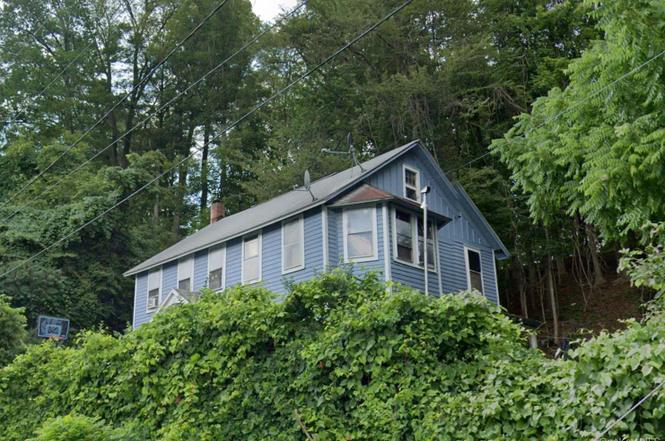
70 Plank Rd · Napanoch, NY
Flood risk 1/10 · Minimal
- FEMA flood zone
- X (unshaded)
- Chance of flooding over 30 yrs
- 0.0%
- Est. flood insurance / yr
- $473 – $860
Fire risk 2/10 · Minimal
- Est. fire insurance / yr
- $691 – $1,283
Heat risk 5/10 · Moderate
- Hot days now (above 96°F)
- 9 days/yr
- Hot days in 30 yrs
- 20 days/yr
Wind risk 3/10 · Minor
- Chance of severe wind over 30 yrs
- 8.0%
Air-quality risk 2/10 · Minimal
- Unhealthy air days now
- 1 days/yr
- Unhealthy air days in 30 yrs
- 1 days/yr
Risk factors via First Street. Map © Google.
Why this score? — see what drove the D+ grade
The composite is a weighted blend of 9 inputs, each scored 0–100. Each bar is that input's sub-score; the figure is the points it added to the 100-point composite (weight × sub-score).
- ARV discount +15.0/15.0
- Appreciation +10.0/10.0
- Cash flow +8.0/30.0
- Livability +3.5/5.0
- Schools +3.3/10.0
- 1% rule +2.9/10.0
- Rent growth +2.5/5.0
- Condition / age +2.5/5.0
- DSCR +2.1/10.0
$200,000
🖨 Deal sheet (PDF) 📄 Offer letter ✓ Due diligence
Listing remarks
Charming 1920s two-story home in Napanoch! This 1,760 sq ft residence features 4 spacious bedrooms, 1 full bath, a full basement, and sits on a manageable 0.20-acre lot. Built with character and updated in 1970, the home offers a wood-sided exterior, hot-air heating, and plenty of flexible space for today’s living needs. The layout lends itself to both comfort and functionality, whether you’re seeking a family home or an investment opportunity.
Key facts
- Hot air heating
- Manageable lot
- Full basement
Tags
Property features AI
Exterior
- Parking: No carport
- Utilities: Public sewer; Electricity connected
- Home design: Single-family residence; Living area per public records
- Construction: Frame construction
- Exterior features: Frame construction; Not waterfront
Interior
- Kitchen: Oven; Range; Refrigerator
- Bathrooms: 1 full bathroom
- Heating & cooling: Oil heating; Other heating; No central cooling
- Interior features: Other interior features; Full unfinished basement; Attic with pull-down stairs; 11 total rooms
Neighborhood map
What this means for you Summary
Snapshot
- This is a 4-bed/1.0-bath single-family listed at $200k.
Deal economics
- At list price, monthly cash flow is $-204 ($-2k/yr) — negative.
- To cash-flow at today's rent, offer at most $164k (18.0% below list).
- To meet the 1% rule (rent ≥ 1% of price), the offer needs to be $157k (21.3% below list).
- Recommended offer: $157k (21.3% below list) — sets the bar for 1% rule.
Location & tenants
- Location reads 70/100 on livability (#435 in NY) — a middle-class / working-renter tenant base. Strengths: cost of living A+, housing A+, crime A; Watch: amenities F, commute F, health & safety D-.
- Ellenville Central School District (town): math 32% / reading 46% proficiency, ranked #534 of 590 in NY (top 90%) — families likely to look elsewhere, expect single-tenant / working-renter base with shorter leases.
- Zoned schools: Ellenville Elementary School (math 17% / reading 42%, grade F, #1,729 of 2,108 statewide, top 84%, 674 students, 61% FRL); Ellenville Junior/Senior High School (math 82% / reading 82%, grade A, #452 of 1,100 statewide, top 44%, 731 students, 64% FRL).
- Zoned-school proficiency averages 56% at this address vs 39% district-wide (+17 pts) — the actual schools serving this property are materially stronger than the Ellenville Central School District average implies; a family-tenant draw the district grade alone would hide.
- Market conditions: 19 active listings in the ZIP; 464 units permitted in Ulster County in 2024 (170 in 5+ unit buildings).
Forward outlook
- In year one you build about $21k of equity ($1k loan paydown + $20k appreciation (10.0% local appreciation)).
- Ulster County population projected at -14% by 2050 — secular population decline; favor cash flow + early exit over multi-decade hold.
- By year 2, paydown + projected appreciation supports a ~$34k cash-out refi (75% LTV) — recoverable capital for the next deal without selling this one.
Negotiation context
- Only 6 days on market — expect competitive offers; lowballing is unlikely to land.
- 3 sale attempts with the ask held roughly flat each time — persistent listings suggest the price (not the market) is what's stuck; bring a comps-based counter.
Risks & watch-outs
- Watch-outs: built in 1920 — expect roof / HVAC / electrical / plumbing capex.
- Climate carrying-cost: extreme-heat days projected 9→20/yr by 2055 (HVAC capex compounding) — expect insurance premiums to compound above CPI over the hold.
Questions for the listing agent
- What do current leases actually rent for vs. the listed asking? Can we see a recent rent roll and the last 12 months of T-12 income?
- Built in 1920 — when were the roof, HVAC, electrical panel, plumbing, and water heater last replaced?
- Is there a deadline driving the sale (1031 exchange, divorce, estate, relocation)? That informs how much negotiation room exists.
- The area grade is low — what's the realistic commute time and amenity access for the typical tenant pool here? Any planned neighborhood developments (good or bad) we should know about?
- What's the average days-on-market for RENTAL listings here right now (not sales)? A rising rental-DOM trend means longer vacancies and softer asking-rent achievability than the comps imply.
- What's the recent tenant-quality profile in this submarket — average credit score on applications, eviction rate, late-payment / NSF rate, and stable-employment percentage? A property-management company in the area should have these aggregated.
- How much new for-sale + rental construction is in the pipeline within 1–3 miles? Heavy new supply typically softens prices + rents 12–24 months out; constrained supply supports both.
Investment metrics
- 1% rule
- 0.79% ✗
- Cap rate
- 5.07%
- Cash-on-cash
- -4.37%
- DSCR
- 0.81
- GRM
- 10.6
CMA / ARV
- ARV (on-the-fly)
- $344,960
- Comps found
- 2
Show comp detail 2 sales within ~0.75 mi
| Address | Dist | Beds/Ba | Sqft | Sold | Price | $/sf | Match |
|---|---|---|---|---|---|---|---|
| 10 Route 55 | 0.36mi | 3/2.5 (-1) | 1,864 (+6%) | 1mo | $365,000 | $196 | 62 |
| 67 Clinton St | 0.23mi | 4/1.0 | 1,564 (-11%) | 11mo | $205,000 | $131 | 62 |
Match score weights: distance 35% · size 25% · config 20% · recency 20%. Top-matched comps best support the ARV.
Projected returns pro-forma
10.0% appreciation · 3.0% rent growth · sell at horizon
- IRR
- 21.2%
- Equity multiple
- 2.71×
- Total profit
- $96,001
- Equity at exit
- $180,176
- IRR
- 19.2%
- Equity multiple
- 6.23×
- Total profit
- $293,049
- Equity at exit
- $388,556
Cash invested: $56,000 (down + closing). Projections, not guarantees.
Landlord ↔ Tenant lean methodology
- Overall (STATE)
- 15 Strongly Tenant-Friendly
- State New York
- 15 Strongly Tenant-Friendly · D+10
- County
- — inherits STATE
- City
- — inherits STATE
ZIP-level market 12458
- Active inventory
- 19
- Price-to-rent
- 10.6×
Monthly cashflow live
- Estimated rent
- $1,575 medium interval (Pro) →
- Mortgage (P&I)
- −$1,049
- Tax from tax record
- −$316 /mo · $3,790/yr
- Insurance
- −$83
- HOA
- −$0
- Vacancy / Maint / Mgmt
- −$331
- Net cashflow
- $-204
Break-even live
Sensitivity live
| Price | -10% $-91 | -5% $-147 | +0% $-204 | +5% $-261 | +10% $-317 |
|---|---|---|---|---|---|
| Rent | -10% $-328 | -5% $-266 | +0% $-204 | +5% $-142 | +10% $-80 |
| Rate | -1.0pp $-103 | -0.5pp $-153 | base $-204 | +0.5pp $-256 | +1.0pp $-308 |
UW: 25.0% down · 7.5% · 30yr · 1.5% tax · 5.0% vac · 8.0% maint · 8.0% mgmt
Financing live
Cash to close
- Down payment
- $50,000
- Closing costs
- $6,000
- Reserves months
- —
- Total cash needed
- —
Loan-product check · same deal, 3 products live
Conventional
25% down · 7.5% · 30yr
- Down + closing
- —
- Monthly P&I
- —
- Monthly cashflow
- —
- DSCR
- —
- Eligible?
- —
Personal DTI + credit; lowest rate.
DSCR
20% down · 8.5% · 30yr
- Down + closing
- —
- Monthly P&I
- —
- Monthly cashflow
- —
- DSCR
- —
- Eligible?
- —
No personal income docs; deal must DSCR.
Hard money
10% down · 12.0% · 12mo
- Down + closing
- —
- Monthly P&I
- —
- Monthly cashflow
- —
- DSCR
- —
- Eligible?
- —
Short-term bridge; refi at stabilization.
Listing history 6 events
-
2026-06-21days on market $200,000 Active 6 DOM
-
2026-06-21days on market $200,000 Active 5 DOM
-
2026-06-18days on market $200,000 Active 3 DOM
-
2026-06-17days on market $200,000 Active 2 DOM
-
2026-06-17remarks 448-char remark
-
2026-06-17$200,000 Active 1 DOM
ⓘ Source: listings_history table (triggers on properties + properties_extension) + one-shot
backfill from property_details.listing_events for pre-trigger history.
Tax reassessment forecast NY · Partial reset (capped growth)
- Current annual tax
- $3,790 · $316/mo
- Projected year-2 tax
- $3,790 · $316/mo
- Expected delta
- $0/yr ($0/mo · -0.0%)
ⓘ Screening estimate from a state-policy table — verify with the county assessor before closing.
Climate risk First Street
- Flood 1/10 Low FEMA zone X (unshaded) · 0% chance over 30 yrs
- Wildfire 2/10 Low
- Heat 5/10 Major 9 d/yr ≥96°F today · 20 d/yr by 30 yrs out
- Wind 3/10 Moderate 8% chance of damaging wind over 30 yrs
- Air quality 2/10 Low 1 unhealthy d/yr today · 1 by 30 yrs out
Nearby sold comps map
Loading sold comps map…
Walkable amenities ~0.75 mi
Loading nearby amenities…
Taxation est. · year 1
- Rental income
- $18,897
- − Mortgage interest
- −$11,203
- − Property taxes
- −$3,790
- − Insurance
- −$1,000
- − Repairs & maintenance
- −$1,512
- − Management
- −$1,512
- − Depreciation
- −$5,818
- Taxable loss
- −$5,938
- Est. tax savings @ 24.0%
- +$1,425
- After-tax cash flow
- $-1,022/yr
For passive investors: Depreciation is non-cash, so a rental often shows a tax loss while cash-flowing — sheltering income. Rental losses are passive: they offset passive income freely, and up to $25,000/yr can offset ordinary (W-2) income if you actively participate and your MAGI is under $100k (phasing out to $0 by $150k); unused losses carry forward. On sale, claimed depreciation is recaptured at up to 25%, and gains may owe capital-gains tax (a 1031 exchange can defer both). Figures are a year-1 estimate at your 24.0% rate — not tax advice; consult a CPA.
Schools (NCES district)
- District
- Ellenville Central School District
- NCES district ID
- 3610500
- Math proficiency
- 32% ▼ -6.00%
- Reading proficiency
- 46% ▲ 10.00%
- Median HH income
- $45,937
- Composite
- 33.22/100
- National rank
- #5525
- State rank
- #534 of 590 in NY
Livability — Napanoch
- Score
- 70/100
- State rank
- #435
- US rank
- #7610
Category grades
Schools grade is shown separately in the Schools card above.
Census & demographics
- Census place
- Napanoch, NY
- Population (ZIP)
- 3,195
Population outlook (Ulster County) Hauer SSP2
- Today (2025)
- 175,887 people
- By 2030
- 171,876 · -2.3%
- By 2040
- 161,771 · -8.0%
- By 2050
- 151,470 · -13.9%
- By 2075
- 133,023 · -24.4%
- By 2100
- 113,504 · -35.5%
Race, ethnicity, and origin ACS 2023
- Neighborhood character
- Diverse neighborhood (Simpson 0.61)
- Race & ethnicity
- White 55% Hispanic / Latino 22% Black 21% Two or more races 9%
- Hispanic origin (detail)
- Mexican 1% Puerto Rican 8% Dominican 7%
- Common ancestry
- American 7% Russian 4% Estonian 2%
- Foreign-born
- 10% · Canada
- Languages at home
- 85% English-only · Spanish 12% Other Indo-European 2%
Political lean MEDSL · Ulster
- 2024 margin
- D (+18.7) · D 59.3% · R 40.7%
- 2008→2024 swing
- -4.9pp toward R · 2008: 23.6pp · 2024: 18.7pp
- All cycles
- 2024: D+18.7 2020: D+20.9 2016: D+9.1 2012: D+21.9 2008: D+23.6
Not yet ingested
- Civics
- —
Market trends
- HPI YoY
- ▲ 109.69%
- Current HPI
- 375.4261
- Rent YoY
- —
- Metro
- —
- State GDP YoY
- ▲ 2.60%
- F500 in state
- 92
Industry mix (Fortune 500 HQ in NY)
| Industry | F500 HQs | Revenue |
|---|---|---|
| Financial Services | 10 | $950B |
|
||
| Consumer Goods | 9 | $162B |
|
||
| Insurance | 4 | $225B |
|
||
| Telecommunications | 2 | $144B |
|
||
| Pharmaceuticals | 2 | $112B |
|
||
| Media / Entertainment | 2 | $69B |
|
||
Price history
+256.7% since first listed5 events — show timeline
- 2026-06-16 Relisted — OneKey® MLS as Distributed by MLS Grid
- 2025-09-05 Relisted — OneKey® MLS as Distributed by MLS Grid
- 2025-09-01 Listed $200,000 OneKey® MLS as Distributed by MLS Grid
- 2004-10-20 Sold (Public Records) $175,000 Public Records
- 1992-12-16 Sold (Public Records) $56,065 Public Records
Property tax history
-0.8%/yrLatest (2025): $3,790 · +4.6% YoY. Source: county tax records.
Cash-flow waterfall
monthlySold comps — $/sqft
last 12 mo · ≤1 miLoading sold comps…