 🏗️ New Construction
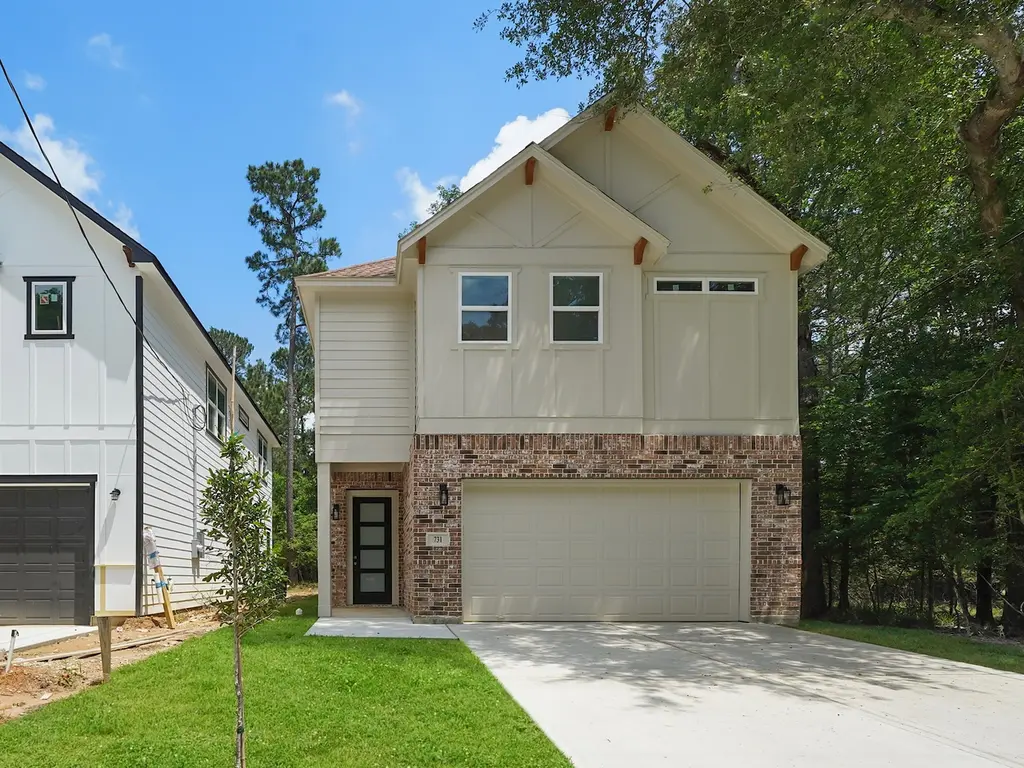
731 Magnolia Point Dr · Houston, TX
Flood risk 1/10 · Minimal
- FEMA flood zone
- X (unshaded)
- Chance of flooding over 30 yrs
- 0.0%
- Est. flood insurance / yr
- $507 – $1,088
Fire risk 3/10 · Minor
- Est. fire insurance / yr
- $1,222 – $2,270
Heat risk 9/10 · Severe
- Hot days now (above 112°F)
- 7 days/yr
- Hot days in 30 yrs
- 24 days/yr
Wind risk 8/10 · Major
- Chance of severe wind over 30 yrs
- 99.0%
Air-quality risk 2/10 · Minimal
- Unhealthy air days now
- 1 days/yr
- Unhealthy air days in 30 yrs
- 2 days/yr
Risk factors via First Street. Map © Google.
Why this score? — see what drove the F grade
The composite is a weighted blend of 9 inputs, each scored 0–100. Each bar is that input's sub-score; the figure is the points it added to the 100-point composite (weight × sub-score).
- ARV discount +7.5/15.0
- Cash flow +5.2/30.0
- Livability +3.7/5.0
- Schools +3.1/10.0
- Rent growth +2.5/5.0
- Condition / age +2.5/5.0
- 1% rule +0.9/10.0
- Appreciation +0.7/10.0
- DSCR +0.0/10.0
$299,000
🖨 Deal sheet (PDF) 📄 Offer letter ✓ Due diligence
Listing remarks
Please contact me for builder specials!!!! Home NOT in a flood zone! Tucked away in a peaceful wooded setting this stunning two story contemporary home is the perfect escape for those seeking privacy, comfort, and a connection to nature. Surrounded by towering trees and serene forest views. Inside you’re welcomed by soaring 10-foot ceilings and an open-concept layout that feels both spacious and inviting. Thoughtful design touches and classic finishes add timeless character while the beautiful kitchen complete with a large central island makes everyday living and entertaining effortless. Step outside to the covered patio where you can enjoy peaceful mornings, cozy evenings in the hear
Key facts
- Covered patio
- Large central island
- Serene forest views
Tags
Property features AI
Finance
- Financial info: Lease not considered
Exterior
- Parking: Attached 2-car garage
- Utilities: Public water
- Home design: Residential property; New construction (2025); Slab foundation; Composition roof
- Construction: Brick construction; Built by Casamea Builders LLC
- Exterior features: Covered patio; Patio; Covered deck
Interior
- Kitchen: Dishwasher; Gas cooktop; Gas oven; Gas range; Pantry; Quartz counters
- Bedrooms: Primary bedroom on second level (14 x 14); Bedroom on second level (12 x 9); Bedroom on second level (12.5 x 12)
- Flooring: Tile
- Bathrooms: 2 full bathrooms; 1 half bathroom
- Heating & cooling: Propane heating; Central electric air conditioning
- Interior features: Double vanity; Pantry; Quartz counters; Soaking tub; Separate shower; 6 total rooms
- Laundry & utility: Washer hookup; Gas dryer hookup
Neighborhood map
What this means for you Summary
Snapshot
- This is a 3-bed/2.5-bath land listed at $299k.
Deal economics
- At list price, monthly cash flow is $-742 ($-9k/yr) — negative.
- To cash-flow at today's rent, offer at most $219k (26.7% below list).
- To meet the 1% rule (rent ≥ 1% of price), the offer needs to be $192k (35.9% below list).
- Recommended offer: $192k (35.9% below list) — sets the bar for 1% rule.
Location & tenants
- Location reads 74/100 on livability (#184 in TX, #4,771 nationally) — a middle-class / working-renter tenant base. Strengths: amenities A+, cost of living A+, housing A+; Watch: crime F.
- Huffman ISD (rural): math 32% / reading 35% proficiency, ranked #500 of 826 in TX (top 60%) — families likely to look elsewhere, expect single-tenant / working-renter base with shorter leases.
- Zoned schools: Huffman Middle (math 36% / reading 32%, grade F, #892 of 1,662 statewide, top 55%, 907 students, 42% FRL); Hargrave H S (math 31% / reading 46%, grade F, #866 of 1,632 statewide, top 54%, 1,125 students, 36% FRL) — zoned schools at 39% FRL track the district average.
- Market conditions: 587 active listings in the ZIP; solid renter incomes; 29,883 units permitted in Harris County in 2024 (8,621 in 5+ unit buildings).
Forward outlook
- Local home prices are declining (-3.0%/yr); year-one equity from $2k of loan paydown is wiped out by about $10k of value loss. Plan a longer hold.
- Harris County population projected at +47% by 2050 — long-run rental-demand tailwind backs the buy-and-hold thesis.
Negotiation context
- Only 9 days on market — expect competitive offers; lowballing is unlikely to land.
- 7 sale attempts since 5y ago with the ask held roughly flat each time — persistent listings suggest the price (not the market) is what's stuck; bring a comps-based counter.
Risks & watch-outs
- Climate carrying-cost: severe wind risk, 99% chance of damaging wind over 30y; extreme-heat days projected 7→24/yr by 2055 (HVAC capex compounding) — expect insurance premiums to compound above CPI over the hold.
Questions for the listing agent
- What do current leases actually rent for vs. the listed asking? Can we see a recent rent roll and the last 12 months of T-12 income?
- Is there a deadline driving the sale (1031 exchange, divorce, estate, relocation)? That informs how much negotiation room exists.
- Schools are D-rated, which usually means shorter tenancies and higher turnover. Who's the typical renter profile here, and what's been the actual vacancy rate?
- Crime grade is F in this area — have there been break-ins, vandalism, or insurance claims at this property in the last 3 years? What carrier currently insures it and at what premium?
- The area grade is low — what's the realistic commute time and amenity access for the typical tenant pool here? Any planned neighborhood developments (good or bad) we should know about?
- What's the average days-on-market for RENTAL listings here right now (not sales)? A rising rental-DOM trend means longer vacancies and softer asking-rent achievability than the comps imply.
- What's the recent tenant-quality profile in this submarket — average credit score on applications, eviction rate, late-payment / NSF rate, and stable-employment percentage? A property-management company in the area should have these aggregated.
- How much new for-sale + rental construction is in the pipeline within 1–3 miles? Heavy new supply typically softens prices + rents 12–24 months out; constrained supply supports both.
Investment metrics
- 1% rule
- 0.59% ✗
- Cap rate
- 3.57%
- Cash-on-cash
- -9.74%
- DSCR
- 0.57
- GRM
- 14.2
CMA / ARV
- ARV (median comp)
- $326,371
- List price
- $299,000
- Delta
- -14.24%
- Verdict
- UNDERPRICED
- Comps
- 20 within 1.0 mi
Projected returns pro-forma
-3.0% appreciation · 3.0% rent growth · sell at horizon
- IRR
- -33.7%
- Equity multiple
- -0.10×
- Total profit
- $-100,088
- Equity at exit
- $48,663
- IRR
- -41.9%
- Equity multiple
- -0.62×
- Total profit
- $-147,854
- Equity at exit
- $28,219
Cash invested: $91,384 (down + closing). Projections, not guarantees.
Landlord ↔ Tenant lean methodology
- Overall (STATE)
- 87 Strongly Landlord-Friendly
- State Texas
- 87 Strongly Landlord-Friendly · R+5
- County
- — inherits STATE
- City
- — inherits STATE
ZIP-level market 77336
- Home prices YoY
- -1.8%
- Active inventory
- 587
- Price-to-rent
- 13.0×
Monthly cashflow live
- Estimated rent
- $1,916 medium interval (Pro) →
- Mortgage (P&I)
- −$1,712
- Tax est. 1.5%
- −$408 /mo · $4,896/yr
- Insurance
- −$136
- HOA
- −$0
- Vacancy / Maint / Mgmt
- −$402
- Net cashflow
- $-742
Break-even live
Sensitivity live
| Price | -10% $-516 | -5% $-629 | +0% $-742 | +5% $-854 | +10% $-967 |
|---|---|---|---|---|---|
| Rent | -10% $-893 | -5% $-817 | +0% $-742 | +5% $-666 | +10% $-590 |
| Rate | -1.0pp $-577 | -0.5pp $-659 | base $-742 | +0.5pp $-826 | +1.0pp $-912 |
UW: 25.0% down · 7.5% · 30yr · 1.5% tax · 5.0% vac · 8.0% maint · 8.0% mgmt
Financing live
Cash to close
- Down payment
- $81,593
- Closing costs
- $9,791
- Reserves months
- —
- Total cash needed
- —
Loan-product check · same deal, 3 products live
Conventional
25% down · 7.5% · 30yr
- Down + closing
- —
- Monthly P&I
- —
- Monthly cashflow
- —
- DSCR
- —
- Eligible?
- —
Personal DTI + credit; lowest rate.
DSCR
20% down · 8.5% · 30yr
- Down + closing
- —
- Monthly P&I
- —
- Monthly cashflow
- —
- DSCR
- —
- Eligible?
- —
No personal income docs; deal must DSCR.
Hard money
10% down · 12.0% · 12mo
- Down + closing
- —
- Monthly P&I
- —
- Monthly cashflow
- —
- DSCR
- —
- Eligible?
- —
Short-term bridge; refi at stabilization.
Listing history 32 events
-
2026-06-21days on market $299,000 Active 9 DOM
-
2026-06-18days on market $299,000 Active 6 DOM
-
2026-06-17days on market $299,000 Active 5 DOM
-
2026-06-16days on market $299,000 Active 4 DOM
-
2026-06-15days on market $299,000 Active 3 DOM
-
2026-06-13pricedays on market $299,000 Active 1 DOM
-
2026-06-09days on market $279,900 Active 57 DOM
-
2026-06-08days on market $279,900 Active 56 DOM
-
2026-06-07days on market $279,900 Active 55 DOM
-
2026-06-04days on market $279,900 Active 52 DOM
-
2026-06-03days on market $279,900 Active 51 DOM
-
2026-06-02days on market $279,900 Active 50 DOM
-
2026-06-01days on market $279,900 Active 49 DOM
-
2026-05-31days on market $279,900 Active 48 DOM
-
2026-04-13$279,900 Active 992-char remark
-
2026-04-13historical
-
2026-03-20$279,900 Active
-
2026-03-20historical
-
2026-01-16$279,900 Active
-
2026-01-16historical
-
2025-11-21$279,900 Active
-
2025-11-21historical
-
2025-09-12$279,900 Active
-
2023-05-11soldstatus
-
2022-01-14soldstatus Sold
-
2022-01-02status Pending
-
2021-12-24status Option Pending
-
2021-12-04price $19,999
-
2021-11-25price $24,999
-
2021-11-14price $24,900
-
2021-11-08$29,900 Active
-
2020-12-01soldstatus
ⓘ Source: listings_history table (triggers on properties + properties_extension) + one-shot
backfill from property_details.listing_events for pre-trigger history.
Climate risk First Street
- Flood 1/10 Low FEMA zone X (unshaded) · 0% chance over 30 yrs
- Wildfire 3/10 Moderate
- Heat 9/10 Extreme 7 d/yr ≥112°F today · 24 d/yr by 30 yrs out
- Wind 8/10 Severe 99% chance of damaging wind over 30 yrs
- Air quality 2/10 Low 1 unhealthy d/yr today · 2 by 30 yrs out
Nearby sold comps map
Loading sold comps map…
Walkable amenities ~0.75 mi
Loading nearby amenities…
Taxation est. · year 1
- Rental income
- $22,996
- − Mortgage interest
- −$18,282
- − Property taxes
- −$4,896
- − Insurance
- −$1,632
- − Repairs & maintenance
- −$1,840
- − Management
- −$1,840
- − Depreciation
- −$9,494
- Taxable loss
- −$14,987
- Est. tax savings @ 24.0%
- +$3,597
- After-tax cash flow
- $-5,302/yr
For passive investors: Depreciation is non-cash, so a rental often shows a tax loss while cash-flowing — sheltering income. Rental losses are passive: they offset passive income freely, and up to $25,000/yr can offset ordinary (W-2) income if you actively participate and your MAGI is under $100k (phasing out to $0 by $150k); unused losses carry forward. On sale, claimed depreciation is recaptured at up to 25%, and gains may owe capital-gains tax (a 1031 exchange can defer both). Figures are a year-1 estimate at your 24.0% rate — not tax advice; consult a CPA.
Schools (NCES district)
- District
- Huffman ISD
- NCES district ID
- 4823820
- Math proficiency
- 32% ▼ -9.00%
- Reading proficiency
- 35% ▼ -9.00%
- Median HH income
- $65,848
- Composite
- 30.61/100
- National rank
- #6195
- State rank
- #500 of 826 in TX
Livability — Houston
- Score
- 74/100
- State rank
- #184
- US rank
- #4771
Category grades
Schools grade is shown separately in the Schools card above.
Census & demographics
- Census place
- Houston, TX
- County
- Harris County · 4,702,590 people
- City population
- 3,226,434
- Metro
- Houston-The Woodlands-Sugar Land, TX
- Population (ZIP)
- 14,342
- Household income
- $96,404
- Rent vs Own
- Severe rent burden
- 377.0
Population outlook (Harris County) Hauer SSP2
- Today (2025)
- 5,571,493 people
- By 2030
- 6,089,821 · +9.3%
- By 2040
- 7,142,806 · +28.2%
- By 2050
- 8,185,864 · +46.9%
- By 2075
- 10,574,329 · +89.8%
- By 2100
- 12,109,958 · +117.4%
Race, ethnicity, and origin ACS 2023
- Neighborhood character
- Majority White (65%)
- Race & ethnicity
- White 65% Hispanic / Latino 23% Two or more races 9% Black 5% Native American 4%
- Hispanic origin (detail)
- Mexican 20%
- Common ancestry
- Lithuanian 4% Slovak 2% Romanian 2%
- Foreign-born
- 9% · Canada
- Languages at home
- 79% English-only · Spanish 18% Other Indo-European 2%
Political lean MEDSL · Harris
- 2024 margin
- Lean D (+5.5) · D 52.0% · R 46.4% · Other 1.6%
- 2008→2024 swing
- +3.9pp toward D · 2008: 1.6pp · 2024: 5.5pp
- All cycles
- 2024: D+5.5 2020: D+13.3 2016: D+12.4 2012: D+0.1 2008: D+1.6
Not yet ingested
- Civics
- —
Market trends
- HPI YoY
- ▼ -8.59%
- Current HPI
- 472.03
- Rent YoY
- —
- Metro
- Houston-The Woodlands-Sugar Land, TX
- State GDP YoY
- ▲ 3.95%
- F500 in state
- 110
Industry mix (Fortune 500 HQ in TX)
| Industry | F500 HQs | Revenue |
|---|---|---|
| Energy | 16 | $1,198B |
|
||
| Technology | 5 | $198B |
|
||
| Engineering / Construction | 4 | $72B |
|
||
| Energy Services | 3 | $60B |
|
||
| Utilities | 3 | $41B |
|
||
| Healthcare | 2 | $330B |
|
||
Price history
+900.0% since first listed20 events — show timeline
- 2026-06-12 Listing Removed — HARMLS
- 2026-06-12 Listed $299,000 HARMLS
- 2026-04-13 Listing Removed — HARMLS
- 2026-04-13 Listed $279,900 HARMLS
- 2026-03-20 Listing Removed — HARMLS
- 2026-03-20 Listed $279,900 HARMLS
- 2026-01-16 Listing Removed — HARMLS
- 2026-01-16 Listed $279,900 HARMLS
- 2025-11-21 Listing Removed — HARMLS
- 2025-11-21 Listed $279,900 HARMLS
- 2025-09-12 Listed $279,900 HARMLS
- 2023-05-11 Sold (Public Records) — Public Records
- 2022-01-14 Sold (MLS) — HARMLS
- 2022-01-02 Pending — HARMLS
- 2021-12-24 Pending — HARMLS
- 2021-12-04 Price Changed $19,999 HARMLS
- 2021-11-25 Price Changed $24,999 HARMLS
- 2021-11-14 Price Changed $24,900 HARMLS
- 2021-11-08 Listed $29,900 HARMLS
- 2020-12-01 Sold (Public Records) — Public Records
Property tax history
+63.6%/yrLatest (2025): $591 · +0.5% YoY. Source: county tax records.
Cash-flow waterfall
monthlySold comps — $/sqft
last 12 mo · ≤1 miLoading sold comps…