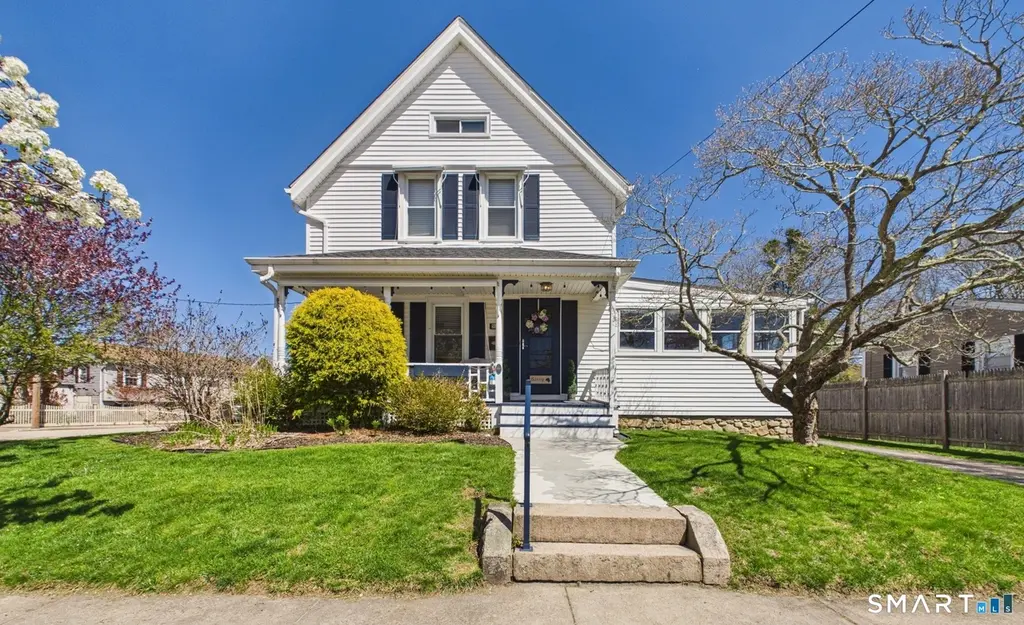
52 Moss St · Pawcatuck, CT
Flood risk 1/10 · Minimal
- FEMA flood zone
- X (unshaded)
- Chance of flooding over 30 yrs
- 0.0%
- Est. flood insurance / yr
- $473 – $860
Fire risk 3/10 · Minor
- Est. fire insurance / yr
- $829 – $1,539
Heat risk 6/10 · Moderate
- Hot days now (above 91°F)
- 7 days/yr
- Hot days in 30 yrs
- 17 days/yr
Wind risk 8/10 · Major
- Chance of severe wind over 30 yrs
- 80.0%
Air-quality risk 3/10 · Minor
- Unhealthy air days now
- 3 days/yr
- Unhealthy air days in 30 yrs
- 4 days/yr
Risk factors via First Street. Map © Google.
Why this score? — see what drove the D grade
The composite is a weighted blend of 9 inputs, each scored 0–100. Each bar is that input's sub-score; the figure is the points it added to the 100-point composite (weight × sub-score).
- ARV discount +14.6/15.0
- Cash flow +9.5/30.0
- Schools +5.5/10.0
- Livability +3.6/5.0
- DSCR +2.7/10.0
- Rent growth +2.5/5.0
- Condition / age +2.5/5.0
- 1% rule +2.2/10.0
- Appreciation +0.0/10.0
$389,900
🖨 Deal sheet (PDF) 📄 Offer letter ✓ Due diligence
Listing remarks MLS
Relax on the traditional front porch of this 3 bedroom 1 1/2 bath Victorian home. Property is located on a corner lot with a fence in yard and detached garage. Original hardwood floors and attached 3 seasons roof off kitchen. New roof. Offering sidewalks to easily walk to Pawcatuck River, Park and to downtown Westerly amenities.
Key facts
- Functional kitchen
- Fenced-in back yard
- Three-season room
Tags
Property features AI
Exterior
- Parking: Detached garage; Driveway and off-street parking (3 spaces total)
- Utilities: Public water connected; Public sewer connected; Oil fuel with tank located in basement
- Home design: Single-family home
- Construction: Frame construction; Vinyl siding; Asphalt shingle roof; White exterior color; Foundation: slab and stone
- Exterior features: Corner lot; Level lot; Partially and fully fenced yard with wood and privacy fencing; Professionally landscaped; Paved driveway
Interior
- Kitchen: Oven/Range; Refrigerator
- Bedrooms: 3 bedrooms
- Bathrooms: 1 full bathroom; 1 half bathroom
- Heating & cooling: Baseboard heating (oil-fired); Window air conditioning unit; Tankless hot water
- Interior features: 6 total rooms; Full, unfinished basement with storage, interior access, walk-out and concrete floor; Attic with pull-down stairs; Laundry room; Workshop
- Laundry & utility: Washer; Dryer
Neighborhood map
What this means for you Summary
Snapshot
- This is a 3-bed/1.5-bath single-family listed at $390k.
Deal economics
- At list price, monthly cash flow is $-269 ($-3k/yr) — negative.
- To cash-flow at today's rent, offer at most $342k (12.2% below list).
- To meet the 1% rule (rent ≥ 1% of price), the offer needs to be $282k (27.8% below list).
- Recommended offer: $282k (27.8% below list) — sets the bar for 1% rule.
Location & tenants
- Location reads 72/100 on livability (#81 in CT) — a middle-class / working-renter tenant base. Strengths: housing A+, crime A, health & safety A; Watch: amenities F, commute F.
- Stonington School District (suburban): math 54% / reading 70% proficiency, ranked #43 of 153 in CT (top 28%) — acceptable for families but not a draw, mixed tenant base, ~2y average lease; only 14% free/reduced lunch — higher-income household profile.
- Zoned schools: West Vine Street School (math 52% / reading 62%, grade C+, #177 of 553 statewide, top 34%, 354 students, 41% FRL); Stonington Middle School (math 51% / reading 71%, grade B+, #41 of 175 statewide, top 25%, 379 students, 26% FRL); Stonington High School (math 47% / reading 77%, grade B-, #40 of 194 statewide, top 21%, 585 students, 21% FRL) — zoned schools average 29% FRL vs 14% district-wide (15 pts higher); higher-poverty schools than district average — tighter screening recommended.
- Market conditions: 26 active listings in the ZIP; 8 comparable units currently listed for rent nearby; rentals leasing fast (median 4d on market — plan ~1-2 weeks tenant-placement turnaround); 487 units permitted in Southeastern Connecticut Planning Region in 2024 (244 in 5+ unit buildings).
Forward outlook
- Local home prices are declining (-3.0%/yr); year-one equity from $3k of loan paydown is wiped out by about $12k of value loss. Plan a longer hold.
Negotiation context
- Only 8 days on market — expect competitive offers; lowballing is unlikely to land.
- 2 sale attempts since 6y ago with the ask held roughly flat each time — persistent listings suggest the price (not the market) is what's stuck; bring a comps-based counter.
Risks & watch-outs
- Watch-outs: built in 1898 — expect roof / HVAC / electrical / plumbing capex.
- Climate carrying-cost: severe wind risk, 80% chance of damaging wind over 30y; extreme-heat days projected 7→17/yr by 2055 (HVAC capex compounding) — expect insurance premiums to compound above CPI over the hold.
Questions for the listing agent
- What do current leases actually rent for vs. the listed asking? Can we see a recent rent roll and the last 12 months of T-12 income?
- Built in 1898 — when were the roof, HVAC, electrical panel, plumbing, and water heater last replaced?
- Is there a deadline driving the sale (1031 exchange, divorce, estate, relocation)? That informs how much negotiation room exists.
- Schools are B-rated — typically a magnet for longer-tenancy family renters. What's the average tenant stay here, and is there a school-zone premium baked into asking?
- The area grade is low — what's the realistic commute time and amenity access for the typical tenant pool here? Any planned neighborhood developments (good or bad) we should know about?
- What's the average days-on-market for RENTAL listings here right now (not sales)? A rising rental-DOM trend means longer vacancies and softer asking-rent achievability than the comps imply.
- What's the recent tenant-quality profile in this submarket — average credit score on applications, eviction rate, late-payment / NSF rate, and stable-employment percentage? A property-management company in the area should have these aggregated.
- How much new for-sale + rental construction is in the pipeline within 1–3 miles? Heavy new supply typically softens prices + rents 12–24 months out; constrained supply supports both.
Investment metrics
- 1% rule
- 0.72% ✗
- Cap rate
- 5.47%
- Cash-on-cash
- -2.95%
- DSCR
- 0.87
- GRM
- 11.5
CMA / ARV
- ARV (median comp)
- $462,690
- List price
- $389,900
- Delta
- -15.73%
- Verdict
- UNDERPRICED
- Comps
- 20 within 1.0 mi
Show comp detail 7 sales within ~0.75 mi
| Address | Dist | Beds/Ba | Sqft | Sold | Price | $/sf | Match |
|---|---|---|---|---|---|---|---|
| 16 Spring St | 0.61mi | 3/2.0 | 1,212 (-1%) | 1mo | $447,000 | $369 | 66 |
| 39 Chester Ave | 0.71mi | 3/1.0 | 1,233 (+0%) | 10mo | $419,900 | $341 | 56 |
| 26 Westminster St | 0.63mi | 3/1.0 | 1,176 (-4%) | 7mo | $459,000 | $390 | 55 |
| 29 John St | 0.61mi | 3/2.0 | 1,100 (-10%) | 7mo | $450,000 | $409 | 46 |
| 1 Jovere Dr | 0.74mi | 3/1.5 | 1,062 (-14%) | 4mo | $435,000 | $410 | 40 |
| 35 John St | 0.65mi | 4/1.0 (+1) | 1,338 (+9%) | 12mo | $400,000 | $299 | 38 |
| 44 George St | 0.67mi | 4/2.0 (+1) | 1,388 (+13%) | 5mo | $565,000 | $407 | 36 |
Match score weights: distance 35% · size 25% · config 20% · recency 20%. Top-matched comps best support the ARV.
Projected returns pro-forma
-3.0% appreciation · 3.0% rent growth · sell at horizon
- IRR
- -21.3%
- Equity multiple
- 0.26×
- Total profit
- $-80,365
- Equity at exit
- $58,135
- IRR
- -14.9%
- Equity multiple
- 0.15×
- Total profit
- $-92,332
- Equity at exit
- $33,711
Cash invested: $109,172 (down + closing). Projections, not guarantees.
Landlord ↔ Tenant lean methodology
- Overall (STATE)
- 27 Tenant-Leaning
- State Connecticut
- 27 Tenant-Leaning · D+7
- County
- — inherits STATE
- City
- — inherits STATE
ZIP-level market 06379
- Active inventory
- 26
- Price-to-rent
- 11.5×
Monthly cashflow live
- Estimated rent
- $2,817 high interval (Pro) →
- Mortgage (P&I)
- −$2,045
- Tax from tax record
- −$287 /mo · $3,439/yr
- Insurance
- −$162
- HOA
- −$0
- Lot rent
- −$0
- Vacancy / Maint / Mgmt
- −$592
- Net cashflow
- $-269
Break-even live
Sensitivity live
| Price | -10% $-48 | -5% $-158 | +0% $-269 | +5% $-379 | +10% $-489 |
|---|---|---|---|---|---|
| Rent | -10% $-491 | -5% $-380 | +0% $-269 | +5% $-157 | +10% $-46 |
| Rate | -1.0pp $-72 | -0.5pp $-169 | base $-269 | +0.5pp $-370 | +1.0pp $-472 |
UW: 25.0% down · 7.5% · 30yr · 1.5% tax · 5.0% vac · 8.0% maint · 8.0% mgmt
Financing live
Cash to close
- Down payment
- $97,475
- Closing costs
- $11,697
- Reserves months
- —
- Total cash needed
- —
Loan-product check · same deal, 3 products live
Conventional
25% down · 7.5% · 30yr
- Down + closing
- —
- Monthly P&I
- —
- Monthly cashflow
- —
- DSCR
- —
- Eligible?
- —
Personal DTI + credit; lowest rate.
DSCR
20% down · 8.5% · 30yr
- Down + closing
- —
- Monthly P&I
- —
- Monthly cashflow
- —
- DSCR
- —
- Eligible?
- —
No personal income docs; deal must DSCR.
Hard money
10% down · 12.0% · 12mo
- Down + closing
- —
- Monthly P&I
- —
- Monthly cashflow
- —
- DSCR
- —
- Eligible?
- —
Short-term bridge; refi at stabilization.
Rent comps 8 comps
| Address | Beds | Baths | Sqft | Rent | $/sqft | DOM | Units | Dist |
|---|---|---|---|---|---|---|---|---|
| 143 W Broad St #2 Pawcatuck, CT | 3.0 | 1.0 | 1115 | $2,250 | $2.02 | 0d | 1 | 0.38mi |
| 9 York Ave Westerly, RI | 2.0 | 1.0 | 1072 | $2,100 | $1.96 | 19d | 1 | 0.69mi |
| 8 Wells Ave Pawcatuck, CT | 3.0 | 2.5 | 1120 | $2,750 | $2.46 | 4d | 1 | 0.76mi |
| 33 Railroad Ave #2 Westerly, RI | 2.0 | 1.0 | 900 | $2,400 | $2.67 | 4d | 1 | 0.84mi |
| 15 Trumbull St Stonington, CT | 3.0 | 2.5 | 1466 | $6,000 | $4.09 | 46d | 1 | 0.90mi |
| 9 Woodlund Ave Westerly, RI | 3.0 | 1.0 | 1347 | $3,200 | $2.38 | 4d | 1 | 1.02mi |
| 9 Woodlund Ave Westerly, RI | 3.0 | 1.0 | 1347 | $3,200 | $2.38 | 13d | 1 | 1.02mi |
| 16 West St Unit 3 Westerly, RI | 2.0 | 1.0 | 1307 | $1,750 | $1.34 | 0d | 1 | 1.04mi |
Listing history 5 events
-
2026-05-08status Under Contract 1163-char remark
-
2026-04-30$389,900 Active 1163-char remark
-
2020-09-30soldstatus $236,000 Closed 330-char remark
Show marketing remark (330 chars)
Relax on the traditional front porch of this 3 bedroom 1 1/2 bath Victorian home. Property is located on a corner lot with a fence in yard and detached garage. Original hardwood floors and attached 3 seasons roof off kitchen. New roof. Offering sidewalks to easily walk to Pawcatuck River, Park and to downtown Westerly amenities.
-
2020-09-30soldstatus $236,000
Show marketing remark (330 chars)
Relax on the traditional front porch of this 3 bedroom 1 1/2 bath Victorian home. Property is located on a corner lot with a fence in yard and detached garage. Original hardwood floors and attached 3 seasons roof off kitchen. New roof. Offering sidewalks to easily walk to Pawcatuck River, Park and to downtown Westerly amenities.
-
2020-08-13$229,900 Active 330-char remark
Show marketing remark (330 chars)
Relax on the traditional front porch of this 3 bedroom 1 1/2 bath Victorian home. Property is located on a corner lot with a fence in yard and detached garage. Original hardwood floors and attached 3 seasons roof off kitchen. New roof. Offering sidewalks to easily walk to Pawcatuck River, Park and to downtown Westerly amenities.
ⓘ Source: listings_history table (triggers on properties + properties_extension) + one-shot
backfill from property_details.listing_events for pre-trigger history.
Tax reassessment forecast CT · Partial reset (capped growth)
- Current annual tax
- $3,439 · $287/mo
- Projected year-2 tax
- $5,891 · $491/mo
- Expected delta
- +$2,452/yr (+$204/mo · 71.3%)
ⓘ Screening estimate from a state-policy table — verify with the county assessor before closing.
Climate risk First Street
- Flood 1/10 Low FEMA zone X (unshaded) · 0% chance over 30 yrs
- Wildfire 3/10 Moderate
- Heat 6/10 Major 7 d/yr ≥91°F today · 17 d/yr by 30 yrs out
- Wind 8/10 Severe 80% chance of damaging wind over 30 yrs
- Air quality 3/10 Moderate 3 unhealthy d/yr today · 4 by 30 yrs out
Nearby sold comps map
Loading sold comps map…
Walkable amenities ~0.75 mi
Loading nearby amenities…
Taxation est. · year 1
- Rental income
- $33,800
- − Mortgage interest
- −$21,840
- − Property taxes
- −$3,439
- − Insurance
- −$1,950
- − Repairs & maintenance
- −$2,704
- − Management
- −$2,704
- − Depreciation
- −$11,343
- Taxable loss
- −$10,179
- Est. tax savings @ 24.0%
- +$2,443
- After-tax cash flow
- $-779/yr
For passive investors: Depreciation is non-cash, so a rental often shows a tax loss while cash-flowing — sheltering income. Rental losses are passive: they offset passive income freely, and up to $25,000/yr can offset ordinary (W-2) income if you actively participate and your MAGI is under $100k (phasing out to $0 by $150k); unused losses carry forward. On sale, claimed depreciation is recaptured at up to 25%, and gains may owe capital-gains tax (a 1031 exchange can defer both). Figures are a year-1 estimate at your 24.0% rate — not tax advice; consult a CPA.
Schools (NCES district)
- District
- Stonington School District
- NCES district ID
- 0904380
- Math proficiency
- 54% ▼ -10.00%
- Reading proficiency
- 70% ▼ -7.00%
- Median HH income
- $75,939
- Composite
- 55.15/100
- National rank
- #1280
- State rank
- #43 of 153 in CT
Livability — Pawcatuck
- Score
- 72/100
- State rank
- #81
- US rank
- #6033
Category grades
Schools grade is shown separately in the Schools card above.
Census & demographics
- Census place
- Pawcatuck, CT
- City population
- 9,003
- Population (ZIP)
- 9,003
Population outlook (Southeastern Connecticut County) Hauer SSP2
- By 2040
- 293,442
Race, ethnicity, and origin ACS 2023
- Neighborhood character
- Predominantly White (84%)
- Race & ethnicity
- White 84% Two or more races 8% Hispanic / Latino 3% Black 3% Asian 2%
- Common ancestry
- Russian 6% Lithuanian 5% Slovak 5%
- Foreign-born
- 5% · Canada
- Languages at home
- 94% English-only · Other Indo-European 3% Spanish 1% French/Haitian/Cajun 0%
Political lean MEDSL · Southeastern Connecticut
- 2024 margin
- D (+13.0) · D 55.6% · R 42.6% · Other 1.8%
- All cycles
- 2024: D+13.0
Not yet ingested
- Civics
- —
Market trends
- HPI YoY
- ▼ -139.18%
- Current HPI
- 187.2421
- Rent YoY
- —
- Metro
- —
- State GDP YoY
- ▲ 1.06%
- F500 in state
- 38
Industry mix (Fortune 500 HQ in CT)
| Industry | F500 HQs | Revenue |
|---|---|---|
| Industrial Machinery | 4 | $38B |
|
||
| Insurance | 3 | $71B |
|
||
| Financial Services | 2 | $25B |
|
||
| Transportation / Logistics | 2 | $18B |
|
||
| Healthcare | 1 | $247B |
|
||
| Telecommunications | 1 | $55B |
|
||
Price history
+82.7% since first listed6 events — show timeline
- 2026-05-29 Sold (MLS) $420,000 Smart MLS
- 2026-05-08 Pending — Smart MLS
- 2026-04-30 Listed $389,900 Smart MLS
- 2020-09-30 Sold (Public Records) $236,000 Public Records
- 2020-09-30 Sold (MLS) $236,000 Smart MLS
- 2020-08-13 Listed $229,900 Smart MLS
Property tax history
+2.8%/yrLatest (2022): $3,439 · -0.2% YoY. Source: county tax records.
Cash-flow waterfall
monthlySold comps — $/sqft
last 12 mo · ≤1 miLoading sold comps…