 Duplex
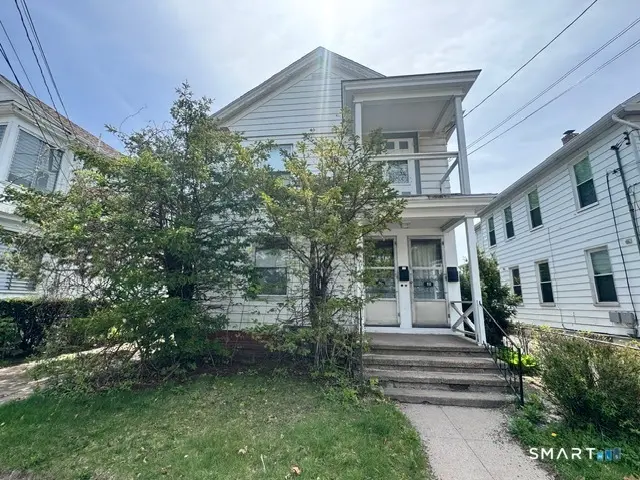
86 Hinman St · West Haven, CT
Flood risk 1/10 · Minimal
- FEMA flood zone
- X (unshaded)
- Chance of flooding over 30 yrs
- 0.0%
- Est. flood insurance / yr
- $473 – $860
Fire risk 1/10 · Minimal
- Est. fire insurance / yr
- $829 – $1,539
Heat risk 7/10 · Major
- Hot days now (above 99°F)
- 7 days/yr
- Hot days in 30 yrs
- 17 days/yr
Wind risk 6/10 · Moderate
- Chance of severe wind over 30 yrs
- 58.0%
Air-quality risk 5/10 · Moderate
- Unhealthy air days now
- 5 days/yr
- Unhealthy air days in 30 yrs
- 8 days/yr
Risk factors via First Street. Map © Google.
Why this score? — see what drove the C- grade
The composite is a weighted blend of 9 inputs, each scored 0–100. Each bar is that input's sub-score; the figure is the points it added to the 100-point composite (weight × sub-score).
- Cash flow +17.9/30.0
- ARV discount +12.7/15.0
- DSCR +5.6/10.0
- 1% rule +4.7/10.0
- Livability +4.2/5.0
- Rent growth +3.5/5.0
- Schools +2.8/10.0
- Condition / age +2.5/5.0
- Appreciation +0.0/10.0
$349,000
🖨 Deal sheet 📄 Offer letter ✓ Due diligence
Multi-family units
County records classify this as Multi-Family (2-4 Unit). Listing-text estimate: 2 units. confirmed
Listing remarks
Stable 2 family property offering a strong opportunity for both investors and owner-occupants in a high-demand location. Each unit features 1 bedroom, 1 full bathroom, a living room, dining room, and an EIK, providing a practical and efficient layout. The first floor unit is in overall good condition and is heated by oil, while the second floor unit, heated by gas, presents an opportunity for updates and future value enhancement. Both units utilize gas for cooking. Additional features include a 2 car detached garage, off-street parking, level yard, and ample storage space in basement. Separate utilities add to the property's long-term investment appeal. Conveniently located near UNH, major
Key facts
- Ample storage space
- Separate utilities
- Level yard
Tags
Property features AI
Exterior
- Parking: Detached garage; 2-car garage
- Utilities: Public water connected; Public sewer connected; Above-ground fuel tank
- Home design: Multi-family property (2-family)
- Construction: Frame construction; Concrete foundation
- Exterior features: Level lot; Aluminum siding; Asphalt shingle roof
Interior
- Bedrooms: 2 bedrooms
- Bathrooms: 2 full bathrooms
- Heating & cooling: Hot water heat; Heat fuel: natural gas and oil; Hot water from natural gas and oil (domestic)
- Interior features: 8 total rooms; Full, unfinished basement
- Laundry & utility: Washer/dryer hook-ups possible (not currently present)
Neighborhood map
What this means for you Summary
Snapshot
- This is a 2 × 1-bed/1.0-bath units multifamily listed at $349k.
Deal economics
- At list price, monthly cash flow is $292 ($4k/yr) — positive. Per door: $146/mo.
- The deal already cash-flows at list — no discount required.
- To meet the 1% rule (rent ≥ 1% of price), the offer needs to be $340k (2.7% below list).
- Recommended offer: $340k (2.7% below list) — sets the bar for 1% rule.
- Cap rate 7.3% vs local median 4.3% in West Haven — top-decile yield for the area; either an underpriced asset or a hidden risk that comps aren't pricing in. Stress-test before assuming the spread holds.
Location & tenants
- Location reads 83/100 on livability (#6 in CT, #915 nationally) — a professional / high-income tenant draw. Strengths: commute A+, housing A+, health & safety A+; Watch: schools D+, amenities D.
- West Haven School District (suburban): math 26% / reading 38% proficiency, ranked #121 of 153 in CT (top 79%) — families likely to look elsewhere, expect single-tenant / working-renter base with shorter leases.
- Market conditions: Rents rising (+3.9%/yr); 146 active listings in the ZIP; 40 comparable units currently listed for rent nearby; rentals at typical pace (median 24d on market — plan ~3-4 weeks tenant-placement turnaround); 1,059 units permitted in South Central Connecticut Planning Region in 2024 (779 in 5+ unit buildings).
- At $3,397/mo this rent would consume 55% of the median local household income ($74k/yr) (locally 2671% of renters already pay >50% of income on rent) — very limited rent-growth headroom before tenants either downsize or default.
Forward outlook
- Local home prices are declining (-3.0%/yr); year-one equity from $2k of loan paydown is wiped out by about $10k of value loss. Plan a longer hold.
Negotiation context
- Only 6 days on market — expect competitive offers; lowballing is unlikely to land.
Risks & watch-outs
- Watch-outs: built in 1925 — expect roof / HVAC / electrical / plumbing capex.
- Climate carrying-cost: major wind risk, 58% chance of damaging wind over 30y; extreme-heat days projected 7→17/yr by 2055 (HVAC capex compounding) — expect insurance premiums to compound above CPI over the hold.
Questions for the listing agent
- Can we see the unit-by-unit rent roll, current vacancy, and any below-market leases? What's the average tenancy length?
- What capital expenditures (roof, boiler, parking lot, exteriors) have been made in the last 5 years, and what's planned in the next 2?
- Built in 1925 — when were the roof, HVAC, electrical panel, plumbing, and water heater last replaced?
- Is there a deadline driving the sale (1031 exchange, divorce, estate, relocation)? That informs how much negotiation room exists.
- Schools are D-rated, which usually means shorter tenancies and higher turnover. Who's the typical renter profile here, and what's been the actual vacancy rate?
- What's the average days-on-market for RENTAL listings here right now (not sales)? A rising rental-DOM trend means longer vacancies and softer asking-rent achievability than the comps imply.
- What's the recent tenant-quality profile in this submarket — average credit score on applications, eviction rate, late-payment / NSF rate, and stable-employment percentage? A property-management company in the area should have these aggregated.
- How much new apartment / multifamily construction is in the pipeline within 1–3 miles? Heavy new supply (>2% of stock underway) typically softens rents 12–24 months out; light construction supports rent growth.
Investment metrics
- 1% rule
- 0.97% ✗
- Cap rate
- 7.30%
- Cash-on-cash
- 3.59%
- DSCR
- 1.16
- GRM
- 8.6
CMA / ARV
- ARV (median comp)
- $394,158
- List price
- $349,000
- Delta
- -11.46%
- Verdict
- UNDERPRICED
- Comps
- 20 within 1.0 mi
Show comp detail 1 sale within ~0.75 mi
| Address | Dist | Beds/Ba | Sqft | Sold | Price | $/sf | Match |
|---|---|---|---|---|---|---|---|
| 86 Hinman St | 0.00mi | 2/2.0 | 1,602 (0%) | 0mo | $375,000 | $234 | 100 |
Match score weights: distance 35% · size 25% · config 20% · recency 20%. Top-matched comps best support the ARV.
Projected returns pro-forma
-3.0% appreciation · 3.9% rent growth · sell at horizon
- IRR
- -9.6%
- Equity multiple
- 0.64×
- Total profit
- $-34,791
- Equity at exit
- $52,037
- IRR
- 1.0%
- Equity multiple
- 1.07×
- Total profit
- $6,809
- Equity at exit
- $30,175
Cash invested: $97,720 (down + closing). Projections, not guarantees.
Landlord ↔ Tenant lean methodology
- Overall (STATE)
- 27 Tenant-Leaning
- State Connecticut
- 27 Tenant-Leaning · D+7
- County
- — inherits STATE
- City
- — inherits STATE
ZIP-level market 06516
- Rents YoY
- 3.9%
- Active inventory
- 146
- Price-to-rent
- 17.1×
Monthly cashflow live
- Estimated rent
- $3,397 high interval (Pro) →
- Mortgage (P&I)
- −$1,830
- Tax from tax record
- −$416 /mo · $4,988/yr
- Insurance
- −$145
- HOA
- −$0
- Vacancy / Maint / Mgmt
- −$713
- Net cashflow
- $292
Break-even live
2-unit breakdown (identical units grouped — click to expand)
| Units | Beds | Baths | Est. rent |
|---|---|---|---|
| 2× units | 1 | 1 | $3,398 |
| #1 | 1 | 1 | $1,699 |
| #2 | 1 | 1 | $1,699 |
| Total (2 units) | $3,397 | ||
UW: 25.0% down · 7.5% · 30yr · 1.5% tax · 5.0% vac · 8.0% maint · 8.0% mgmt
Financing live
Cash to close
- Down payment
- $87,250
- Closing costs
- $10,470
- Reserves months
- —
- Total cash needed
- —
Loan-product check · same deal, 3 products live
Conventional
25% down · 7.5% · 30yr
- Down + closing
- —
- Monthly P&I
- —
- Monthly cashflow
- —
- DSCR
- —
- Eligible?
- —
Personal DTI + credit; lowest rate.
DSCR
20% down · 8.5% · 30yr
- Down + closing
- —
- Monthly P&I
- —
- Monthly cashflow
- —
- DSCR
- —
- Eligible?
- —
No personal income docs; deal must DSCR.
Hard money
10% down · 12.0% · 12mo
- Down + closing
- —
- Monthly P&I
- —
- Monthly cashflow
- —
- DSCR
- —
- Eligible?
- —
Short-term bridge; refi at stabilization.
Rent comps 40 comps
| Address | Beds | Baths | Sqft | Rent | $/sqft | DOM | Units | Dist |
|---|---|---|---|---|---|---|---|---|
| 34 Bristol St Unit 3 West Haven, CT | 3.0 | 1.0 | 1370 | $2,400 | $1.75 | 43d | 1 | 0.07mi |
| 38 Bristol St Unit 3 West Haven, CT | 3.0 | 1.0 | 1200 | $2,400 | $2.00 | 43d | 1 | 0.08mi |
| 64 Lee St Unit 1st floor West Haven, CT | 2.0 | 1.0 | 1200 | $1,950 | $1.62 | 43d | 1 | 0.16mi |
| 32 Cullen Ave West Haven, CT | 3.0 | 2.0 | 1080 | $3,500 | $3.24 | 2d | 1 | 0.45mi |
| 48 Miller St Unit 1 New Haven, CT | 3.0 | 2.0 | 1500 | $2,000 | $1.33 | 43d | 1 | 0.61mi |
| 32 Auburn St Unit 2 New Haven, CT | 3.0 | 1.0 | 1300 | $2,300 | $1.77 | 23d | 1 | 0.71mi |
| 60 Baggott St West Haven, CT | 3.0 | 1.0 | 1242 | $2,300 | $1.85 | 23d | 1 | 0.72mi |
| 185 Winthrop Ave Unit 1 New Haven, CT | 3.0 | 1.0 | 1357 | $2,100 | $1.55 | 3d | 1 | 0.76mi |
| 408 Legion Ave Unit 2 New Haven, CT | 3.0 | 1.0 | 1610 | $2,000 | $1.24 | 43d | 1 | 0.77mi |
| 16 Vine St Unit 2nd New Haven, CT | 2.0 | 1.0 | 1832 | $2,250 | $1.23 | 43d | 1 | 0.81mi |
| 54 Orchard St Unit 52B New Haven, CT | 3.0 | 2.0 | 1200 | $2,600 | $2.17 | 43d | 1 | 0.82mi |
| 46 Orchard St Unit 46B New Haven, CT | 3.0 | 2.0 | 1200 | $2,600 | $2.17 | 23d | 1 | 0.82mi |
| 46 Orchard St Unit 46A New Haven, CT | 3.0 | 2.0 | 1200 | $2,600 | $2.17 | 43d | 1 | 0.82mi |
| 995 Campbell Ave Unit 3 West Haven, CT | 2.0 | 1.0 | 1200 | $1,700 | $1.42 | 14d | 1 | 0.90mi |
| 34 Homeside Ave West Haven, CT | 3.0 | 1.0 | 1264 | $2,700 | $2.14 | 11d | 1 | 0.90mi |
| 79 Rangely St West Haven, CT | 3.0 | 1.0 | 1144 | $2,500 | $2.19 | 2d | 1 | 0.91mi |
| 994 Campbell Ave West Haven, CT | 2.0 | 1.0 | 1050 | $1,950 | $1.86 | 43d | 1 | 0.92mi |
| 29 White St Unit 3 New Haven, CT | 3.0 | 1.0 | 1240 | $1,750 | $1.41 | 23d | 1 | 0.93mi |
| 45 Frank St New Haven, CT | 2.0 | 1.0 | 2120 | $1,650 | $0.78 | 43d | 1 | 0.94mi |
| 45 Frank St Unit 3 New Haven, CT | 1.0 | 1.0 | 2120 | $1,450 | $0.68 | 43d | 1 | 0.94mi |
| 48 Truman St New Haven, CT | 3.0 | 1.0 | 1072 | $1,900 | $1.77 | 14d | 1 | 0.95mi |
| 173 Terrace Ave West Haven, CT | 3.0 | 2.0 | 1392 | $2,800 | $2.01 | 2d | 1 | 1.00mi |
| 43 Rodney St West Haven, CT | 3.0 | 1.0 | 1142 | $3,000 | $2.63 | 2d | 1 | 1.01mi |
| 5 Gilbert Ave Unit 1 New Haven, CT | 3.0 | 1.0 | 1254 | $2,000 | $1.59 | 23d | 1 | 1.03mi |
| 5 Gilbert Ave Unit 1 New Haven, CT | 3.0 | 1.0 | 1254 | $2,000 | $1.59 | 19d | 1 | 1.03mi |
| 123 Morris St Unit 2 New Haven, CT | 3.0 | 1.0 | 1150 | $1,900 | $1.65 | 3d | 1 | 1.03mi |
| 1561 Chapel St New Haven, CT | 3.0 | 1.0 | 1100 | $1,950 | $1.77 | 3d | 1 | 1.04mi |
| 1494 Chapel St Unit 1R New Haven, CT | 3.0 | 1.0 | 1800 | $2,000 | $1.11 | 3d | 1 | 1.04mi |
| 15 Crest St Unit B13 West Haven, CT | 2.0 | 1.5 | 1096 | $2,500 | $2.28 | 43d | 1 | 1.06mi |
| 87 Norton St Apt 2 New Haven, CT | 1.0 | 1.0 | 1117 | $1,150 | $1.03 | 23d | 1 | 1.10mi |
| 87 Norton St Unit 3 New Haven, CT | 1.0 | 1.0 | 1165 | $1,250 | $1.07 | 43d | 1 | 1.10mi |
| 16 Daggett St #1 New Haven, CT | 2.0 | 1.0 | 1515 | $1,800 | $1.19 | 3d | 1 | 1.10mi |
| 542 George St Unit A3 New Haven, CT | 2.0 | 1.0 | 1350 | $1,950 | $1.44 | 2d | 1 | 1.11mi |
| 48 Hurlburt St Unit 3 New Haven, CT | 2.0 | 1.0 | 1250 | $1,650 | $1.32 | 3d | 1 | 1.13mi |
| 22 W Spring St Unit 2 West Haven, CT | 3.0 | 1.0 | 1200 | $2,350 | $1.96 | 2d | 1 | 1.13mi |
| 22 W Spring St Unit 1 West Haven, CT | 3.0 | 1.0 | 1200 | $2,350 | $1.96 | 23d | 1 | 1.13mi |
| 39 Hurlburt St Unit 2ND New Haven, CT | 3.0 | 1.0 | 1200 | $1,650 | $1.38 | 19d | 1 | 1.15mi |
| 1946 Chapel St Unit 2nd Floor New Haven, CT | 3.0 | 1.0 | 1115 | $3,000 | $2.69 | 11d | 1 | 1.17mi |
| 10 Kensington St New Haven, CT | 3.0 | 2.0 | 1150 | $2,195 | $1.91 | 43d | 1 | 1.19mi |
| 19 Howe St New Haven, CT | 2.0 | 1.0 | 1100 | $1,695 | $1.54 | 43d | 3 | 1.19mi |
Listing history 2 events
-
2026-05-05status Under Contract 875-char remark
-
2026-04-28$349,000 Active 875-char remark
ⓘ Source: listings_history table (triggers on properties + properties_extension) + one-shot
backfill from property_details.listing_events for pre-trigger history.
Tax reassessment forecast CT · Partial reset (capped growth)
- Current annual tax
- $4,988 · $416/mo
- Projected year-2 tax
- $6,228 · $519/mo
- Expected delta
- +$1,240/yr (+$103/mo · 24.9%)
ⓘ Screening estimate from a state-policy table — verify with the county assessor before closing.
Climate risk First Street
- Flood 1/10 Low FEMA zone X (unshaded) · 0% chance over 30 yrs
- Wildfire 1/10 Low
- Heat 7/10 Severe 7 d/yr ≥99°F today · 17 d/yr by 30 yrs out
- Wind 6/10 Major 58% chance of damaging wind over 30 yrs
- Air quality 5/10 Major 5 unhealthy d/yr today · 8 by 30 yrs out
Nearby sold comps map
Loading sold comps map…
Walkable amenities ~0.75 mi
Loading nearby amenities…
Taxation est. · year 1
- Rental income
- $40,764
- − Mortgage interest
- −$19,549
- − Property taxes
- −$4,988
- − Insurance
- −$1,745
- − Repairs & maintenance
- −$3,261
- − Management
- −$3,261
- − Depreciation
- −$10,153
- Taxable loss
- −$2,193
- Est. tax savings @ 24.0%
- +$526
- After-tax cash flow
- $4,035/yr
For passive investors: Depreciation is non-cash, so a rental often shows a tax loss while cash-flowing — sheltering income. Rental losses are passive: they offset passive income freely, and up to $25,000/yr can offset ordinary (W-2) income if you actively participate and your MAGI is under $100k (phasing out to $0 by $150k); unused losses carry forward. On sale, claimed depreciation is recaptured at up to 25%, and gains may owe capital-gains tax (a 1031 exchange can defer both). Figures are a year-1 estimate at your 24.0% rate — not tax advice; consult a CPA.
Schools (NCES district)
- District
- West Haven School District
- NCES district ID
- 0904950
- Math proficiency
- 26% ▼ -13.00%
- Reading proficiency
- 38% ▼ -11.00%
- Median HH income
- $52,405
- Composite
- 28.05/100
- National rank
- #6840
- State rank
- #121 of 153 in CT
Livability — West Haven
- Score
- 83/100
- State rank
- #6
- US rank
- #915
Category grades
Schools grade is shown separately in the Schools card above.
Census & demographics
- Census place
- West Haven, CT
- County
- New Haven County · 688,236 people
- City population
- 55,351
- Metro
- New Haven-Milford, CT
- Population (ZIP)
- 55,351
- Household income
- $74,382
- Rent vs Own
- Severe rent burden
- 2671.0
Population outlook (South Central Connecticut County) Hauer SSP2
- By 2040
- 608,362
Race, ethnicity, and origin ACS 2023
- Neighborhood character
- Diverse neighborhood (Simpson 0.68)
- Race & ethnicity
- White 47% Hispanic / Latino 26% Black 18% Two or more races 10% Asian 5%
- Hispanic origin (detail)
- Mexican 3% Puerto Rican 11% Dominican 1%
- Common ancestry
- Romanian 4% Lithuanian 3% Russian 2%
- Foreign-born
- 21% · Canada, Jamaica, China
- Languages at home
- 70% English-only · Spanish 17% Other Indo-European 5% Arabic 3%
Political lean MEDSL · South Central Connecticut
- 2024 margin
- Strong D (+20.1) · D 59.0% · R 38.9% · Other 2.1%
- All cycles
- 2024: D+20.1
Not yet ingested
- Civics
- —
Market trends
- HPI YoY
- ▼ -312.86%
- Current HPI
- 307.0655
- Rent YoY
- ▲ 3.90%
- Metro
- New Haven-Milford, CT
- State GDP YoY
- ▲ 1.06%
- F500 in state
- 38
Industry mix (Fortune 500 HQ in CT)
| Industry | F500 HQs | Revenue |
|---|---|---|
| Industrial Machinery | 4 | $38B |
|
||
| Insurance | 3 | $71B |
|
||
| Financial Services | 2 | $25B |
|
||
| Transportation / Logistics | 2 | $18B |
|
||
| Healthcare | 1 | $247B |
|
||
| Telecommunications | 1 | $55B |
|
||
Price history
+7.4% since first listed3 events — show timeline
- 2026-06-18 Sold (MLS) $375,000 Smart MLS
- 2026-05-05 Pending — Smart MLS
- 2026-04-28 Listed $349,000 Smart MLS
Property tax history
+1.7%/yrLatest (2023): $4,988 · +1.8% YoY. Source: county tax records.
Cash-flow waterfall
monthlySold comps — $/sqft
last 12 mo · ≤1 miLoading sold comps…