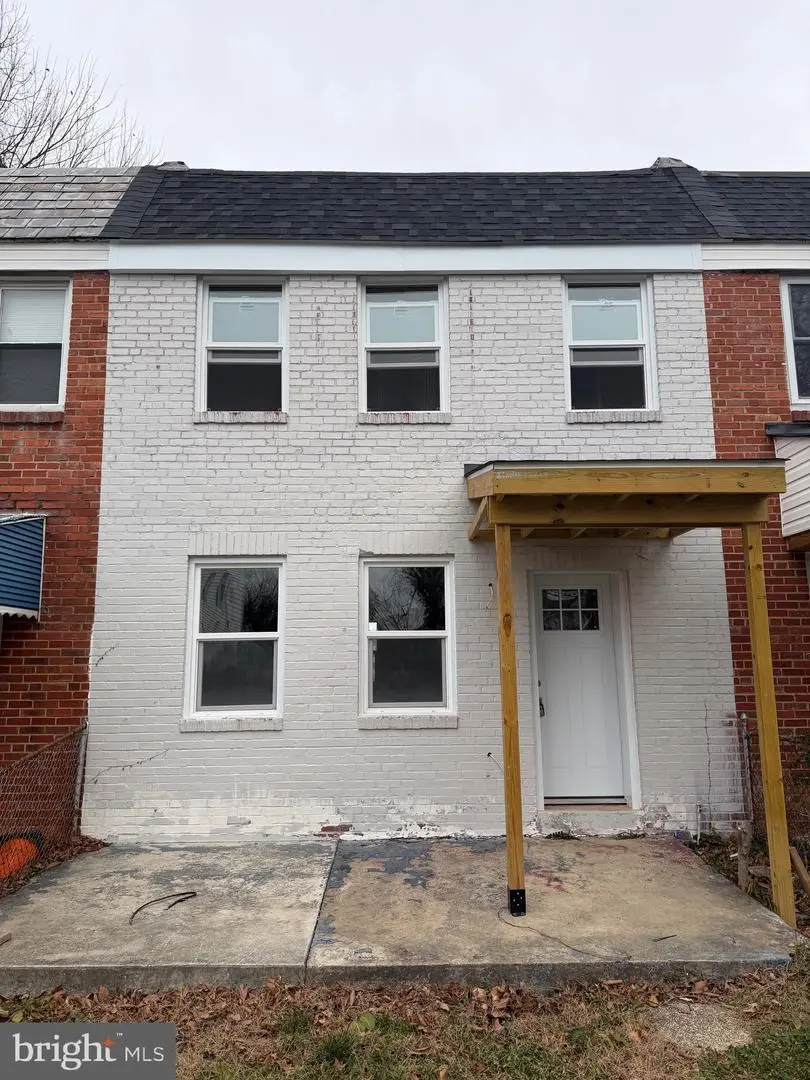
4907 Edgemere Ave · Baltimore, MD
Flood risk 6/10 · Moderate
- FEMA flood zone
- X (unshaded)
- Chance of flooding over 30 yrs
- 0.7%
- Est. flood insurance / yr
- $507 – $1,088
Fire risk 1/10 · Minimal
- Est. fire insurance / yr
- $755 – $1,403
Heat risk 6/10 · Moderate
- Hot days now (above 104°F)
- 7 days/yr
- Hot days in 30 yrs
- 15 days/yr
Wind risk 6/10 · Moderate
- Chance of severe wind over 30 yrs
- 27.0%
Air-quality risk 3/10 · Minor
- Unhealthy air days now
- 3 days/yr
- Unhealthy air days in 30 yrs
- 4 days/yr
Risk factors via First Street. Map © Google.
Why this score? — see what drove the B- grade
The composite is a weighted blend of 9 inputs, each scored 0–100. Each bar is that input's sub-score; the figure is the points it added to the 100-point composite (weight × sub-score).
- Cash flow +30.0/30.0
- 1% rule +10.0/10.0
- DSCR +10.0/10.0
- ARV discount +8.1/15.0
- Livability +3.8/5.0
- Rent growth +3.1/5.0
- Condition / age +2.5/5.0
- Schools +1.0/10.0
- Appreciation +0.0/10.0
$95,000
🖨 Deal sheet (PDF) 📄 Offer letter ✓ Due diligence
Listing remarks MLS
Investor alert! Park heights opportunity - trades roughed in, new roof and new windows installed, easy finish on this rehab with plenty of built in equity! Sold as is
Key facts
- New roof
- New windows
- Built 1920
Tags
Neighborhood map
What this means for you Summary
Snapshot
- This is a 2-bed/1.0-bath townhouse listed at $95k.
Deal economics
- At list price, monthly cash flow is $568 ($7k/yr) — positive.
- The deal already cash-flows at list — no discount required.
- Meets the 1% rule at list price ($1k rent vs $95k).
- Recommended offer: $84k (12.0% below list) — sets the bar for market timing.
Location & tenants
- Location reads 76/100 on livability (#90 in MD, #3,396 nationally) — a middle-class / working-renter tenant base. Strengths: amenities A+, commute A+, housing A+; Watch: crime F.
- Baltimore City Public Schools (urban): math 7% / reading 16% proficiency, ranked #24 of 24 in MD (top 100%) — low school quality limits family demand, transient renter base, plan for 1-2y turnover; 79% free/reduced lunch — lower-income household profile, screen leases tightly.
- Zoned schools: Pimlico Elementary/Middle (math 0% / reading 11%, grade F, #759 of 860 statewide, top 88%, 741 students, 84% FRL, charter); Baltimore Polytechnic Institute (math 71% / reading 84%, grade A-, #22 of 222 statewide, top 10%, 1,555 students, 43% FRL) — zoned schools average 64% FRL vs 79% district-wide (16 pts lower); this property's tenant base skews higher-income than the district average.
- Zoned-school proficiency averages 42% at this address vs 12% district-wide (+30 pts) — the actual schools serving this property are materially stronger than the Baltimore City Public Schools average implies; a family-tenant draw the district grade alone would hide.
- Market conditions: Rents rising (+2.4%/yr); 354 active listings in the ZIP; 40 comparable units currently listed for rent nearby; rentals at typical pace (median 26d on market — plan ~3-4 weeks tenant-placement turnaround); 45% of comp listings sitting > 30 days — soft ceiling on asking rent; 1,273 units permitted in Baltimore city in 2024 (1,104 in 5+ unit buildings).
Forward outlook
- Local home prices are declining (-3.0%/yr); year-one equity from $657 of loan paydown is wiped out by about $3k of value loss. Plan a longer hold.
- Baltimore County population projected to shrink 4% by 2050 — rents likely to lag national; underwrite the cash flow, not the appreciation.
- At projected returns (-3.0% appreciation + 2.4% rent growth), your $27k cash investment doubles in ~5 years — after that, you're playing with house money.
Negotiation context
- It's been on market 144 days — a 12% lower offer ($84k) is reasonable based on typical stale-listing flexibility.
- 5 sale attempts since 21y ago with the ask held roughly flat each time — persistent listings suggest the price (not the market) is what's stuck; bring a comps-based counter.
- Current owner paid $43k; list at $95k implies a 121% gain — meaningful room to come down on a strong offer.
Risks & watch-outs
- Watch-outs: built in 1920 — expect roof / HVAC / electrical / plumbing capex.
- Climate carrying-cost: major flood risk; major wind risk, 27% chance of damaging wind over 30y; extreme-heat days projected 7→15/yr by 2055 (HVAC capex compounding) — expect insurance premiums to compound above CPI over the hold.
Questions for the listing agent
- It's been on market 144 days. Have you received any prior offers? Is the seller open to a 12% concession, seller financing, or rate buy-down credit?
- Built in 1920 — when were the roof, HVAC, electrical panel, plumbing, and water heater last replaced?
- Why hasn't it sold? Are there any deal-killer items the seller is aware of (foundation, flood, title, zoning, code violations)?
- Is there a deadline driving the sale (1031 exchange, divorce, estate, relocation)? That informs how much negotiation room exists.
- Schools are D-rated, which usually means shorter tenancies and higher turnover. Who's the typical renter profile here, and what's been the actual vacancy rate?
- Crime grade is F in this area — have there been break-ins, vandalism, or insurance claims at this property in the last 3 years? What carrier currently insures it and at what premium?
- What's the average days-on-market for RENTAL listings here right now (not sales)? A rising rental-DOM trend means longer vacancies and softer asking-rent achievability than the comps imply.
- What's the recent tenant-quality profile in this submarket — average credit score on applications, eviction rate, late-payment / NSF rate, and stable-employment percentage? A property-management company in the area should have these aggregated.
- How much new for-sale + rental construction is in the pipeline within 1–3 miles? Heavy new supply typically softens prices + rents 12–24 months out; constrained supply supports both.
Investment metrics
- 1% rule
- 1.57% ✓
- Cap rate
- 13.47%
- Cash-on-cash
- 25.63%
- DSCR
- 2.14
- GRM
- 5.3
CMA / ARV
- ARV (median comp)
- $96,365
- List price
- $95,000
- Delta
- -1.42%
- Verdict
- FAIR
- Comps
- 20 within 1.0 mi
Show comp detail 12 sales within ~0.75 mi
| Address | Dist | Beds/Ba | Sqft | Sold | Price | $/sf | Match |
|---|---|---|---|---|---|---|---|
| 4927 Edgemere Ave | 0.03mi | 2/1.0 | 1,080 (0%) | 3mo | $95,000 | $88 | 96 |
| 3824 Beehler Ave | 0.33mi | 3/1.5 (+1) | 1,080 (0%) | 3mo | $88,000 | $81 | 75 |
| 5046 Chalgrove Ave | 0.38mi | 2/1.0 | 1,024 (-5%) | 8mo | $51,400 | $50 | 67 |
| 5329 Cordelia Ave | 0.59mi | 3/1.0 (+1) | 1,080 (0%) | 1mo | $105,000 | $97 | 66 |
| 5010 Chalgrove Ave | 0.35mi | 2/1.0 | 1,190 (+10%) | 5mo | $72,500 | $61 | 63 |
| 2904 Virginia Ave | 0.53mi | 3/1.5 (+1) | 1,116 (+3%) | 2mo | $202,000 | $181 | 61 |
| 3709 Columbus Dr | 0.51mi | 3/1.5 (+1) | 1,200 (+11%) | 0mo | $133,900 | $112 | 50 |
| 2841 Oakford Ave | 0.62mi | 3/2.0 (+1) | 1,044 (-3%) | 8mo | $79,000 | $76 | 50 |
| 3701 Columbus Dr | 0.53mi | 3/1.0 (+1) | 1,200 (+11%) | 4mo | $108,000 | $90 | 49 |
| 3918 Dolfield Ave | 0.55mi | 3/1.5 (+1) | 1,216 (+13%) | 5mo | $200,000 | $164 | 42 |
| 4541 The Strand | 0.74mi | 3/1.5 (+1) | 1,152 (+7%) | 8mo | $110,000 | $95 | 41 |
| 3800 Hayward Ave | 0.55mi | 3/2.0 (+1) | 1,224 (+13%) | 6mo | $80,000 | $65 | 38 |
Match score weights: distance 35% · size 25% · config 20% · recency 20%. Top-matched comps best support the ARV.
Projected returns pro-forma
-3.0% appreciation · 2.41% rent growth · sell at horizon
- IRR
- 18.6%
- Equity multiple
- 1.75×
- Total profit
- $19,900
- Equity at exit
- $14,165
- IRR
- 26.6%
- Equity multiple
- 3.27×
- Total profit
- $60,323
- Equity at exit
- $8,214
Cash invested: $26,600 (down + closing). Projections, not guarantees.
Landlord ↔ Tenant lean methodology
- Overall (CITY)
- 12 Strongly Tenant-Friendly
- State Maryland
- 27 Tenant-Leaning · D+14
- County
- — inherits STATE
- City Baltimore
- 12 Strongly Tenant-Friendly · D+58
ZIP-level market 21215
- Rents YoY
- 2.4%
- Active inventory
- 354
- Price-to-rent
- 5.3×
Monthly cashflow live
- Estimated rent
- $1,491 high interval (Pro) →
- Mortgage (P&I)
- −$498
- Tax from tax record
- −$72 /mo · $861/yr
- Insurance
- −$40
- HOA
- −$0
- Vacancy / Maint / Mgmt
- −$313
- Net cashflow
- $568
Break-even live
Sensitivity live
| Price | -10% $622 | -5% $595 | +0% $568 | +5% $541 | +10% $514 |
|---|---|---|---|---|---|
| Rent | -10% $450 | -5% $509 | +0% $568 | +5% $627 | +10% $686 |
| Rate | -1.0pp $616 | -0.5pp $592 | base $568 | +0.5pp $543 | +1.0pp $518 |
UW: 25.0% down · 7.5% · 30yr · 1.5% tax · 5.0% vac · 8.0% maint · 8.0% mgmt
Financing live
Cash to close
- Down payment
- $23,750
- Closing costs
- $2,850
- Reserves months
- —
- Total cash needed
- —
Loan-product check · same deal, 3 products live
Conventional
25% down · 7.5% · 30yr
- Down + closing
- —
- Monthly P&I
- —
- Monthly cashflow
- —
- DSCR
- —
- Eligible?
- —
Personal DTI + credit; lowest rate.
DSCR
20% down · 8.5% · 30yr
- Down + closing
- —
- Monthly P&I
- —
- Monthly cashflow
- —
- DSCR
- —
- Eligible?
- —
No personal income docs; deal must DSCR.
Hard money
10% down · 12.0% · 12mo
- Down + closing
- —
- Monthly P&I
- —
- Monthly cashflow
- —
- DSCR
- —
- Eligible?
- —
Short-term bridge; refi at stabilization.
Rent comps 40 comps
| Address | Beds | Baths | Sqft | Rent | $/sqft | DOM | Units | Dist |
|---|---|---|---|---|---|---|---|---|
| 4828 Beaufort Ave Baltimore, MD | 2.0 | 2.5 | 1200 | $1,850 | $1.54 | 25d | 1 | 0.12mi |
| 3735 Manchester Ave Baltimore, MD | 2.0 | 1.0 | 1000 | $1,350 | $1.35 | 6d | 1 | 0.22mi |
| 3016 Thorndale Ave Baltimore, MD | 1.0–3.0 | 1.0 | 700 | $1,020 | $1.46 | 6d | 14 | 0.23mi |
| 5000 Litchfield Ave #1 Baltimore, MD | 2.0 | 1.0 | 1100 | $1,100 | $1.00 | 45d | 1 | 0.26mi |
| 5115 Pembridge Ave Baltimore, MD | 3.0 | 2.0 | 1088 | $2,150 | $1.98 | 45d | 1 | 0.46mi |
| 5301 Maple Ave Baltimore, MD | 3.0 | 1.0 | 960 | $1,700 | $1.77 | 45d | 1 | 0.48mi |
| 5340 Maple Ave Baltimore, MD | 2.0 | 1.0 | 1200 | $1,950 | $1.62 | 45d | 1 | 0.53mi |
| 3904 Penhurst Ave Baltimore, MD | 2.0 | 1.0 | 760 | $1,175 | $1.55 | 45d | 1 | 0.59mi |
| 2915 Oakford Ave Baltimore, MD | 3.0 | 2.0 | 1102 | $1,600 | $1.45 | 19d | 1 | 0.62mi |
| 5343 Nelson Ave Baltimore, MD | 2.0 | 1.0 | 1000 | $1,215 | $1.22 | 25d | 1 | 0.64mi |
| 3908 Groveland Ave Apt F Baltimore, MD | 2.0 | 1.0 | 815 | $1,695 | $2.08 | 45d | 1 | 0.65mi |
| 2824 Edgecombe Cir S Baltimore, MD | 2.0 | 2.0 | 950 | $1,475 | $1.55 | 23d | 1 | 0.66mi |
| 4910 Poe Ave Unit 2 Baltimore, MD | 2.0 | 1.0 | 750 | $990 | $1.32 | 25d | 1 | 0.67mi |
| 4230 Towanda Ave Baltimore, MD | 3.0 | 2.0 | 1400 | $1,800 | $1.29 | 19d | 1 | 0.68mi |
| 4936 Lanier Ave Baltimore, MD | 1.0–2.0 | 1.0 | 750 | $1,370 | $1.83 | 4d | 5 | 0.74mi |
| 2619 Loyola Northway Baltimore, MD | 3.0 | 2.0 | 1400 | $1,995 | $1.43 | 25d | 1 | 0.74mi |
| 4714 Greenspring Ave Baltimore, MD | 2.0 | 1.0 | 890 | $1,295 | $1.46 | 45d | 1 | 0.76mi |
| 2454 W Cold Spring Ln Baltimore, MD | 3.0 | 1.0 | 1200 | $1,650 | $1.38 | 25d | 1 | 0.76mi |
| 4010 Fernhill Ave Unit 2 Baltimore, MD | 2.0 | 1.0 | 1100 | $1,500 | $1.36 | 45d | 1 | 0.82mi |
| 4064 Edgewood Rd Unit 1ST FLOOR Baltimore, MD | 1.0 | 1.0 | 1320 | $1,460 | $1.11 | 45d | 1 | 0.87mi |
| 4058 Edgewood Rd Unit 1 Baltimore, MD | 1.0 | 1.0 | 800 | $1,100 | $1.38 | 25d | 1 | 0.87mi |
| 4101 Fernhill Ave Unit 2W Baltimore, MD | 1.0 | 1.0 | 761 | $1,200 | $1.58 | 25d | 1 | 0.88mi |
| 2530 Edgecombe Cir N Baltimore, MD | 2.0–3.0 | 1.0 | 920 | $1,175 | $1.28 | 4d | 4 | 0.89mi |
| 4037 Edgewood Rd Unit 1 Baltimore, MD | 2.0 | 1.0 | 726 | $1,100 | $1.52 | 45d | 1 | 0.91mi |
| 2415 Loyola Southway Baltimore, MD | 3.0 | 1.5 | 1200 | $2,033 | $1.69 | 45d | 1 | 0.96mi |
| 4008 Hilton Rd Unit 1st Fl Baltimore, MD | 2.0 | 1.0 | 750 | $1,295 | $1.73 | 45d | 1 | 0.97mi |
| 3912 Mortimer Ave Baltimore, MD | 3.0 | 2.0 | 1204 | $2,723 | $2.26 | 45d | 1 | 0.98mi |
| 2432 Everton Rd Unit 2435 A Baltimore, MD | 2.0 | 1.5 | 1000 | $1,500 | $1.50 | 25d | 1 | 1.04mi |
| 3701 Garrison Blvd Unit 3 Baltimore, MD | 2.0 | 1.0 | 820 | $1,399 | $1.71 | 25d | 1 | 1.08mi |
| 3822 Pall Mall Rd Baltimore, MD | 3.0 | 1.5 | 1320 | $1,875 | $1.42 | 45d | 1 | 1.11mi |
| 3508 Grantley Rd Baltimore, MD | 2.0 | 1.0 | 1250 | $1,350 | $1.08 | 25d | 1 | 1.15mi |
| 5902 Cross Country Blvd Baltimore, MD | 1.0–2.0 | 1.0–2.0 | 785 | $1,699 | $2.16 | 6d | 6 | 1.15mi |
| 5902 Cross Country Blvd Baltimore, MD | 2.0 | 2.0 | 720 | $1,575 | $2.19 | 25d | 1 | 1.15mi |
| 3600 Garrison Blvd Unit B3 Baltimore, MD | 1.0 | 1.0 | 700 | $1,099 | $1.57 | 45d | 1 | 1.16mi |
| 3600 Garrison Blvd Unit T2 Baltimore, MD | 2.0 | 1.0 | 750 | $1,149 | $1.53 | 25d | 1 | 1.16mi |
| 3600 Garrison Blvd Apt T1 Baltimore, MD | 2.0 | 1.0 | 800 | $1,125 | $1.41 | 4d | 1 | 1.16mi |
| 2310 Sulgrave Ave Unit 3 Baltimore, MD | 2.0 | 1.0 | 978 | $1,700 | $1.74 | 45d | 1 | 1.24mi |
| 2917 Rockrose Ave Unit 1 Baltimore, MD | 1.0 | 1.0 | 938 | $1,225 | $1.31 | 45d | 1 | 1.30mi |
| 2001 W Cold Spring Ln Baltimore, MD | 1.0–3.0 | 1.0–2.0 | 1154 | $2,690 | $2.33 | 3d | 31 | 1.31mi |
| 3617 Mohawk Ave Baltimore, MD | 2.0 | 1.0 | 1000 | $1,595 | $1.59 | 45d | 1 | 1.33mi |
Listing history 25 events
-
2026-06-21days on market $95,000 Active 144 DOM
-
2026-06-18days on market $95,000 Active 141 DOM
-
2026-06-17days on market $95,000 Active 140 DOM
-
2026-06-16days on market $95,000 Active 139 DOM
-
2026-06-15days on market $95,000 Active 138 DOM
-
2026-06-13pricedays on market $95,000 Active 136 DOM
-
2026-06-09days on market $99,900 Active 132 DOM
-
2026-06-08days on market $99,900 Active 131 DOM
-
2026-06-07days on market $99,900 Active 130 DOM
-
2026-06-04days on market $99,900 Active 127 DOM
-
2026-06-03days on market $99,900 Active 126 DOM
-
2026-06-02days on market $99,900 Active 125 DOM
-
2026-06-01days on market $99,900 Active 124 DOM
-
2026-05-31days on market $99,900 Active 123 DOM
-
2026-01-28$99,900 Active 166-char remark
Show marketing remark (166 chars)
Investor alert! Park heights opportunity - trades roughed in, new roof and new windows installed, easy finish on this rehab with plenty of built in equity! Sold as is
-
2009-02-01historical
-
2008-05-01status
-
2008-05-01historical
-
2007-11-13
-
2007-08-25historical
-
2007-03-28
-
2005-06-15soldstatus $43,000
-
2005-04-27historical
-
2005-03-16$44,500
-
1995-09-20soldstatus $10,200
ⓘ Source: listings_history table (triggers on properties + properties_extension) + one-shot
backfill from property_details.listing_events for pre-trigger history.
Tax reassessment forecast MD · Partial reset (capped growth)
- Current annual tax
- $861 · $72/mo
- Projected year-2 tax
- $948 · $79/mo
- Expected delta
- +$87/yr (+$7/mo · 10.1%)
ⓘ Screening estimate from a state-policy table — verify with the county assessor before closing.
Climate risk First Street
- Flood 6/10 Major FEMA zone X (unshaded) · 70% chance over 30 yrs
- Wildfire 1/10 Low
- Heat 6/10 Major 7 d/yr ≥104°F today · 15 d/yr by 30 yrs out
- Wind 6/10 Major 27% chance of damaging wind over 30 yrs
- Air quality 3/10 Moderate 3 unhealthy d/yr today · 4 by 30 yrs out
Nearby sold comps map
Loading sold comps map…
Walkable amenities ~0.75 mi
Loading nearby amenities…
Taxation est. · year 1
- Rental income
- $17,888
- − Mortgage interest
- −$5,321
- − Property taxes
- −$861
- − Insurance
- −$475
- − Repairs & maintenance
- −$1,431
- − Management
- −$1,431
- − Depreciation
- −$2,764
- Taxable income
- $5,604
- Est. tax owed @ 24.0%
- −$1,345
- After-tax cash flow
- $5,472/yr
For passive investors: Depreciation is non-cash, so a rental often shows a tax loss while cash-flowing — sheltering income. Rental losses are passive: they offset passive income freely, and up to $25,000/yr can offset ordinary (W-2) income if you actively participate and your MAGI is under $100k (phasing out to $0 by $150k); unused losses carry forward. On sale, claimed depreciation is recaptured at up to 25%, and gains may owe capital-gains tax (a 1031 exchange can defer both). Figures are a year-1 estimate at your 24.0% rate — not tax advice; consult a CPA.
Schools (NCES district)
- District
- Baltimore City Public Schools
- NCES district ID
- 2400090
- Math proficiency
- 7% ▼ -9.00%
- Reading proficiency
- 16% ▼ -5.00%
- Median HH income
- $42,108
- Composite
- 10.08/100
- National rank
- #9805
- State rank
- #24 of 24 in MD
Livability — Baltimore
- Score
- 76/100
- State rank
- #90
- US rank
- #3396
Category grades
Schools grade is shown separately in the Schools card above.
Census & demographics
- Census place
- Baltimore, MD
- County
- Baltimore City · 558,601 people
- City population
- 588,727
- Metro
- Baltimore-Columbia-Towson, MD
- Population (ZIP)
- 52,229
- Household income
- $51,587
- Rent vs Own
- Severe rent burden
- 3644.0
Population outlook (Baltimore County) Hauer SSP2
- Today (2025)
- 624,249 people
- By 2030
- 621,541 · -0.4%
- By 2040
- 609,756 · -2.3%
- By 2050
- 597,249 · -4.3%
- By 2075
- 552,236 · -11.5%
- By 2100
- 513,934 · -17.7%
Race, ethnicity, and origin ACS 2023
- Neighborhood character
- Predominantly Black (73%)
- Race & ethnicity
- Black 73% White 17% Hispanic / Latino 5% Two or more races 4% Asian 1%
- Common ancestry
- Scotch-Irish 2% Romanian 2% Italian 1%
- Foreign-born
- 9% · Canada, South Korea
- Languages at home
- 91% English-only · Spanish 4% French/Haitian/Cajun 1% Other Indo-European 1%
Political lean MEDSL · Baltimore
- 2024 margin
- Solid D (+73.0) · D 85.2% · R 12.2% · Other 2.6%
- 2008→2024 swing
- -2.5pp toward R · 2008: 75.5pp · 2024: 73.0pp
- All cycles
- 2024: D+73.0 2020: D+76.6 2016: D+74.6 2012: D+76.4 2008: D+75.5
Not yet ingested
- Civics
- —
Market trends
- HPI YoY
- ▼ -318.58%
- Current HPI
- 291.4926
- Rent YoY
- ▲ 2.41%
- Metro
- Baltimore-Columbia-Towson, MD
- State GDP YoY
- ▲ 2.97%
- F500 in state
- 12
Industry mix (Fortune 500 HQ in MD)
| Industry | F500 HQs | Revenue |
|---|---|---|
| Aerospace / Defense | 1 | $71B |
|
||
| Utilities | 1 | $25B |
|
||
| Hotels | 1 | $24B |
|
||
| Consumer Goods | 1 | $7B |
|
||
| Real Estate | 1 | $6B |
|
||
| Chemicals | 1 | $2B |
|
||
Price history
+879.4% since first listed11 events — show timeline
- 2026-01-28 Listed $99,900 BRIGHT MLS
- 2009-02-01 Delisted — MRIS
- 2008-05-01 Relisted — MRIS
- 2008-05-01 Delisted — MRIS
- 2007-11-13 Listed — MRIS
- 2007-08-25 Delisted — MRIS
- 2007-03-28 Listed — MRIS
- 2005-06-15 Sold (MLS) $43,000 MRIS
- 2005-04-27 Delisted — MRIS
- 2005-03-16 Listed $44,500 MRIS
- 1995-09-20 Sold (Public Records) $10,200 Public Records
Property tax history
+6.0%/yrLatest (2025): $861 · +7.8% YoY. Source: county tax records.
Cash-flow waterfall
monthlySold comps — $/sqft
last 12 mo · ≤1 miLoading sold comps…