 Duplex
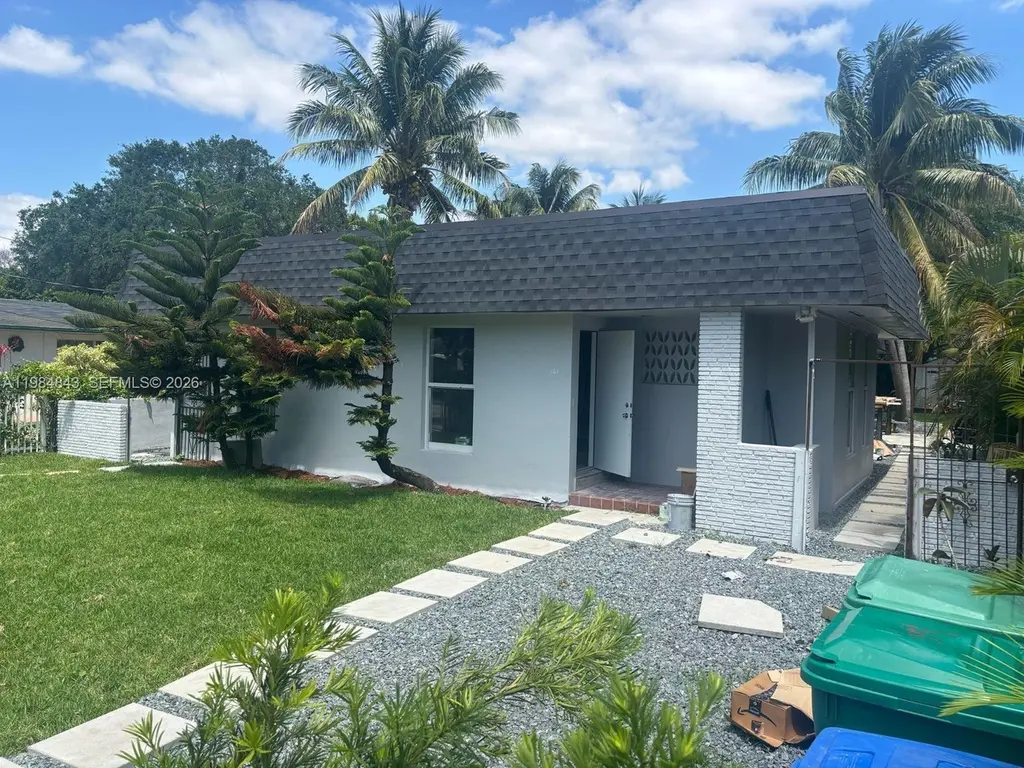
161 NE 117th St · North Miami, FL
Flood risk 1/10 · Minimal
- FEMA flood zone
- X (unshaded)
- Chance of flooding over 30 yrs
- 0.0%
- Est. flood insurance / yr
- $507 – $1,088
Fire risk 1/10 · Minimal
- Est. fire insurance / yr
- $947 – $1,759
Heat risk 10/10 · Severe
- Hot days now (above 104°F)
- 7 days/yr
- Hot days in 30 yrs
- 28 days/yr
Wind risk 10/10 · Severe
- Chance of severe wind over 30 yrs
- 99.0%
Air-quality risk 2/10 · Minimal
- Unhealthy air days now
- 1 days/yr
- Unhealthy air days in 30 yrs
- 2 days/yr
Risk factors via First Street. Map © Google.
Why this score? — see what drove the C grade
The composite is a weighted blend of 9 inputs, each scored 0–100. Each bar is that input's sub-score; the figure is the points it added to the 100-point composite (weight × sub-score).
- Cash flow +24.7/30.0
- DSCR +8.0/10.0
- ARV discount +7.5/15.0
- 1% rule +5.8/10.0
- Schools +4.2/10.0
- Livability +4.2/5.0
- Condition / age +2.5/5.0
- Rent growth +2.3/5.0
- Appreciation +0.0/10.0
$839,000
🖨 Deal sheet (PDF) 📄 Offer letter ✓ Due diligence
Multi-family units
County records classify this as Multi-Family (2-4 Unit). Listing-text estimate: 2 units. confirmed
Listing remarks
Investment Opportunity – NEW ROOF, NEW FLOORS, NEW KITCHENS, NEW BATHROOMS Duplex for Sale This centrally located duplex offers 3-bedroom + two bedroom, 1-Efficiency units with great value-add potential. Both units are just renovated, perfect for investors seeking upside. NEW ROOF, NEW FLOORS, NEW KITCHENS, NEW BATHROOMS
Key facts
- New floors
- New kitchens
- New bathrooms
Tags
Property features AI
Finance
- Other: Zoning description: 5700
- Financial info: Some units are leased; Unit rents noted: studios $1,500; 2-bedrooms $2,000; 3-bedroom $2,500
- HOA & community: No HOA information provided
Exterior
- Parking: Total of 5 parking spaces (open parking)
- Security: No security features provided
- Utilities: Public sewer; Water included in rent for some units; Cable available
- Home design: Single-story building
- Construction: Brick and block construction; Shingle roof; Year built: Unknown
- Exterior features: Open parking; Less than quarter acre lot
Interior
- Kitchen: No specific kitchen appliances listed
- Bedrooms: Two 2-bedroom units; One 3-bedroom unit; Three efficiency (studio) units
- Flooring: Tile
- Bathrooms: Each unit has one full bathroom
- Heating & cooling: Individual air conditioning units in units
- Interior features: Tile flooring; Cable available
- Laundry & utility: No laundry/utility details provided
Neighborhood map
What this means for you Summary
Snapshot
- This is a 2 × 3-bed/1.5-bath units multifamily listed at $839k.
Deal economics
- At list price, monthly cash flow is $2k ($21k/yr) — positive. Per door: $874/mo.
- The deal already cash-flows at list — no discount required.
- Meets the 1% rule at list price ($9k rent vs $839k).
- Recommended offer: $763k (9.0% below list) — sets the bar for market timing.
- Cap rate 8.8% vs local median 4.1% in North Miami — top-decile yield for the area; either an underpriced asset or a hidden risk that comps aren't pricing in. Stress-test before assuming the spread holds.
Location & tenants
- Location reads 83/100 on livability (#51 in FL, #914 nationally) — a professional / high-income tenant draw. Strengths: amenities A+, commute A+, health & safety A+; Watch: schools D+, employment D.
- Miami-Dade (suburban): math 45% / reading 54% proficiency, ranked #40 of 73 in FL (top 55%) — families likely to look elsewhere, expect single-tenant / working-renter base with shorter leases; 64% free/reduced lunch — lower-income household profile, screen leases tightly.
- Market conditions: Rents soft (-0.7%/yr); 338 active listings in the ZIP; 10,051 units permitted in Miami-Dade County in 2024 (7,758 in 5+ unit buildings).
- At $9,083/mo this rent would consume 187% of the median local household income ($58k/yr) (locally 3226% of renters already pay >50% of income on rent) — very limited rent-growth headroom before tenants either downsize or default.
Forward outlook
- Local home prices are declining (-3.0%/yr); year-one equity from $6k of loan paydown is wiped out by about $25k of value loss. Plan a longer hold.
- Miami-Dade County population projected at +28% by 2050 — long-run rental-demand tailwind backs the buy-and-hold thesis.
Negotiation context
- It's been on market 93 days — a 9% lower offer ($763k) is reasonable based on typical stale-listing flexibility.
- 3 sale attempts; this cycle's ask has dropped $60k (7%) from the opening price — seller is motivated, your offer sets the floor, not the list.
- Current owner paid $515k; list at $839k implies a 63% gain — meaningful room to come down on a strong offer.
Risks & watch-outs
- Climate carrying-cost: severe wind risk, 99% chance of damaging wind over 30y; extreme-heat days projected 7→28/yr by 2055 (HVAC capex compounding) — expect insurance premiums to compound above CPI over the hold.
Questions for the listing agent
- It's been on market 93 days. Have you received any prior offers? Is the seller open to a 9% concession, seller financing, or rate buy-down credit?
- Can we see the unit-by-unit rent roll, current vacancy, and any below-market leases? What's the average tenancy length?
- What capital expenditures (roof, boiler, parking lot, exteriors) have been made in the last 5 years, and what's planned in the next 2?
- Built in 1966 — when were the roof, HVAC, electrical panel, plumbing, and water heater last replaced?
- Why hasn't it sold? Are there any deal-killer items the seller is aware of (foundation, flood, title, zoning, code violations)?
- Is there a deadline driving the sale (1031 exchange, divorce, estate, relocation)? That informs how much negotiation room exists.
- Schools are D-rated, which usually means shorter tenancies and higher turnover. Who's the typical renter profile here, and what's been the actual vacancy rate?
- What's the average days-on-market for RENTAL listings here right now (not sales)? A rising rental-DOM trend means longer vacancies and softer asking-rent achievability than the comps imply.
- What's the recent tenant-quality profile in this submarket — average credit score on applications, eviction rate, late-payment / NSF rate, and stable-employment percentage? A property-management company in the area should have these aggregated.
- How much new apartment / multifamily construction is in the pipeline within 1–3 miles? Heavy new supply (>2% of stock underway) typically softens rents 12–24 months out; light construction supports rent growth.
Investment metrics
- 1% rule
- 1.08% ✓
- Cap rate
- 8.79%
- Cash-on-cash
- 8.93%
- DSCR
- 1.40
- GRM
- 7.7
CMA / ARV
No comps found within radius.
Projected returns pro-forma
-3.0% appreciation · 0.0% rent growth · sell at horizon
- IRR
- -6.1%
- Equity multiple
- 0.78×
- Total profit
- $-51,358
- Equity at exit
- $125,098
- IRR
- -0.3%
- Equity multiple
- 0.98×
- Total profit
- $-4,636
- Equity at exit
- $72,541
Cash invested: $234,920 (down + closing). Projections, not guarantees.
Landlord ↔ Tenant lean methodology
- Overall (STATE)
- 87 Strongly Landlord-Friendly
- State Florida
- 87 Strongly Landlord-Friendly · R+3
- County
- — inherits STATE
- City
- — inherits STATE
ZIP-level market 33161
- Rents YoY
- -0.7%
- Active inventory
- 338
- Price-to-rent
- 15.4×
Monthly cashflow live
- Estimated rent
- $9,083 medium interval (Pro) →
- Mortgage (P&I)
- −$4,400
- Tax from tax record
- −$679 /mo · $8,143/yr
- Insurance
- −$350
- HOA
- −$0
- Vacancy / Maint / Mgmt
- −$1,907
- Net cashflow
- $1,748
Break-even live
Sensitivity live
| Price | -10% $2,223 | -5% $1,985 | +0% $1,748 | +5% $1,510 | +10% $1,273 |
|---|---|---|---|---|---|
| Rent | -10% $1,030 | -5% $1,389 | +0% $1,748 | +5% $2,106 | +10% $2,465 |
| Rate | -1.0pp $2,170 | -0.5pp $1,961 | base $1,748 | +0.5pp $1,530 | +1.0pp $1,309 |
2-unit breakdown (identical units grouped — click to expand)
| Units | Beds | Baths | Est. rent |
|---|---|---|---|
| 2× units | 3 | 1.5 | $9,082 |
| #1 | 3 | 1.5 | $4,541 |
| #2 | 3 | 1.5 | $4,541 |
| Total (2 units) | $9,083 | ||
UW: 25.0% down · 7.5% · 30yr · 1.5% tax · 5.0% vac · 8.0% maint · 8.0% mgmt
Financing live
Cash to close
- Down payment
- $209,750
- Closing costs
- $25,170
- Reserves months
- —
- Total cash needed
- —
Loan-product check · same deal, 3 products live
Conventional
25% down · 7.5% · 30yr
- Down + closing
- —
- Monthly P&I
- —
- Monthly cashflow
- —
- DSCR
- —
- Eligible?
- —
Personal DTI + credit; lowest rate.
DSCR
20% down · 8.5% · 30yr
- Down + closing
- —
- Monthly P&I
- —
- Monthly cashflow
- —
- DSCR
- —
- Eligible?
- —
No personal income docs; deal must DSCR.
Hard money
10% down · 12.0% · 12mo
- Down + closing
- —
- Monthly P&I
- —
- Monthly cashflow
- —
- DSCR
- —
- Eligible?
- —
Short-term bridge; refi at stabilization.
Listing history 24 events
-
2026-06-18days on market $839,000 Active 93 DOM
-
2026-06-17days on market $839,000 Active 92 DOM
-
2026-06-16days on market $839,000 Active 91 DOM
-
2026-06-15days on market $839,000 Active 90 DOM
-
2026-06-13days on market $839,000 Active 88 DOM
-
2026-06-09pricedays on market $839,000 Active 84 DOM
-
2026-06-08days on market $849,000 Active 83 DOM
-
2026-06-07days on market $849,000 Active 82 DOM
-
2026-06-04days on market $849,000 Active 79 DOM
-
2026-06-03days on market $849,000 Active 78 DOM
-
2026-06-02days on market $849,000 Active 77 DOM
-
2026-06-01days on market $849,000 Active 76 DOM
-
2026-05-31days on market $849,000 Active 75 DOM
-
2026-05-20price $849,000
-
2026-05-06price $869,000
-
2026-03-17$899,000 Active
-
2025-06-27historical
-
2025-06-03$890,000 Active
-
2025-05-09historical $2,500
-
2025-04-11$2,500
-
2024-11-27soldstatus $515,000
-
2003-12-31soldstatus $175,000
-
2003-09-03soldstatus $151,000
-
1999-04-27soldstatus $114,000
ⓘ Source: listings_history table (triggers on properties + properties_extension) + one-shot
backfill from property_details.listing_events for pre-trigger history.
Tax reassessment forecast FL · Resets to sale price
- Current annual tax
- $8,143 · $679/mo
- Projected year-2 tax
- $8,143 · $679/mo
- Expected delta
- $0/yr ($0/mo · 0.0%)
ⓘ Screening estimate from a state-policy table — verify with the county assessor before closing.
Climate risk First Street
- Flood 1/10 Low FEMA zone X (unshaded) · 0% chance over 30 yrs
- Wildfire 1/10 Low
- Heat 10/10 Extreme 7 d/yr ≥104°F today · 28 d/yr by 30 yrs out
- Wind 10/10 Extreme 99% chance of damaging wind over 30 yrs
- Air quality 2/10 Low 1 unhealthy d/yr today · 2 by 30 yrs out
Nearby sold comps map
Loading sold comps map…
Walkable amenities ~0.75 mi
Loading nearby amenities…
Taxation est. · year 1
- Rental income
- $108,996
- − Mortgage interest
- −$46,997
- − Property taxes
- −$8,143
- − Insurance
- −$4,195
- − Repairs & maintenance
- −$8,720
- − Management
- −$8,720
- − Depreciation
- −$24,407
- Taxable income
- $7,814
- Est. tax owed @ 24.0%
- −$1,875
- After-tax cash flow
- $19,096/yr
For passive investors: Depreciation is non-cash, so a rental often shows a tax loss while cash-flowing — sheltering income. Rental losses are passive: they offset passive income freely, and up to $25,000/yr can offset ordinary (W-2) income if you actively participate and your MAGI is under $100k (phasing out to $0 by $150k); unused losses carry forward. On sale, claimed depreciation is recaptured at up to 25%, and gains may owe capital-gains tax (a 1031 exchange can defer both). Figures are a year-1 estimate at your 24.0% rate — not tax advice; consult a CPA.
Schools (NCES district)
- District
- Miami-Dade
- NCES district ID
- 1200390
- Math proficiency
- 45% ▼ -16.00%
- Reading proficiency
- 54% ▼ -5.00%
- Median HH income
- $43,928
- Composite
- 41.76/100
- National rank
- #3397
- State rank
- #40 of 73 in FL
Livability — North Miami
- Score
- 83/100
- State rank
- #51
- US rank
- #914
Category grades
Schools grade is shown separately in the Schools card above.
Census & demographics
- County
- Miami-Dade County · 2,697,751 people
- City population
- 99,437
- Metro
- Miami-Fort Lauderdale-Pompano Beach, FL
- Population (ZIP)
- 54,814
- Household income
- $58,325
- Rent vs Own
- Severe rent burden
- 3226.0
Population outlook (Miami-Dade County) Hauer SSP2
- Today (2025)
- 3,126,439 people
- By 2030
- 3,325,765 · +6.4%
- By 2040
- 3,697,561 · +18.3%
- By 2050
- 4,012,134 · +28.3%
- By 2075
- 4,605,612 · +47.3%
- By 2100
- 4,866,598 · +55.7%
Race, ethnicity, and origin ACS 2023
- Neighborhood character
- Diverse neighborhood (Simpson 0.58)
- Race & ethnicity
- Black 56% Hispanic / Latino 31% Two or more races 18% White 8% Asian 2%
- Hispanic origin (detail)
- Puerto Rican 4% Cuban 7% Dominican 4% Salvadoran 1%
- Common ancestry
- Hispanic 35% Estonian 1% Lithuanian 1%
- Foreign-born
- 51% · Canada, Jamaica, Dominican Republic
- Languages at home
- 25% English-only · French/Haitian/Cajun 41% Spanish 30% Other Indo-European 2%
Political lean MEDSL · Miami-Dade
- 2024 margin
- R (+11.4) · D 43.9% · R 55.4%
- 2008→2024 swing
- -27.6pp toward R · 2008: 16.1pp · 2024: -11.4pp
- All cycles
- 2024: R+11.4 2020: D+7.3 2016: D+29.6 2012: D+23.7 2008: D+16.1
Not yet ingested
- Civics
- —
Market trends
- HPI YoY
- ▼ -492.86%
- Current HPI
- 630.6932
- Rent YoY
- ▼ -0.73%
- Metro
- Miami-Fort Lauderdale-Pompano Beach, FL
- State GDP YoY
- ▲ 3.28%
- F500 in state
- 36
Industry mix (Fortune 500 HQ in FL)
| Industry | F500 HQs | Revenue |
|---|---|---|
| Industrial Technology | 2 | $29B |
|
||
| Insurance | 2 | $17B |
|
||
| Retail | 1 | $60B |
|
||
| Technology Distribution | 1 | $58B |
|
||
| Homebuilding | 1 | $35B |
|
||
| Technology Manufacturing | 1 | $35B |
|
||
Price history
+644.7% since first listed11 events — show timeline
- 2026-05-20 Price Changed $849,000 MARMLS
- 2026-05-06 Price Changed $869,000 MARMLS
- 2026-03-17 Listed $899,000 MARMLS
- 2025-06-27 Listing Removed — MARMLS
- 2025-06-03 Listed $890,000 MARMLS
- 2025-05-09 Rental Removed $2,500 LISTANZA
- 2025-04-11 Listed for Rent $2,500 LISTANZA
- 2024-11-27 Sold (Public Records) $515,000 Public Records
- 2003-12-31 Sold (Public Records) $175,000 Public Records
- 2003-09-03 Sold (Public Records) $151,000 Public Records
- 1999-04-27 Sold (Public Records) $114,000 Public Records
Property tax history
+9.8%/yrLatest (2025): $8,143 · +95.8% YoY. Source: county tax records.
Cash-flow waterfall
monthlySold comps — $/sqft
last 12 mo · ≤1 miLoading sold comps…