588 N Kimberlite St · Tiffin, IA
Flood risk No data
- FEMA flood zone
- —
- Chance of flooding over 30 yrs
- —
- Est. flood insurance / yr
- —
Fire risk No data
- Est. fire insurance / yr
- —
Heat risk No data
- Hot days now (above threshold)
- —
- Hot days in 30 yrs
- —
Wind risk No data
- Chance of severe wind over 30 yrs
- —
Air-quality risk No data
- Unhealthy air days now
- —
- Unhealthy air days in 30 yrs
- —
Risk factors via First Street. Map © Google.
Why this score? — see what drove the D- grade
The composite is a weighted blend of 9 inputs, each scored 0–100. Each bar is that input's sub-score; the figure is the points it added to the 100-point composite (weight × sub-score).
- Cash flow +10.9/30.0
- Schools +6.4/10.0
- ARV discount +6.1/15.0
- 1% rule +4.2/10.0
- Livability +3.8/5.0
- DSCR +3.2/10.0
- Rent growth +2.5/5.0
- Condition / age +2.5/5.0
- Appreciation +0.0/10.0
$259,990
🖨 Deal sheet (PDF) 📄 Offer letter ✓ Due diligence
Listing remarks
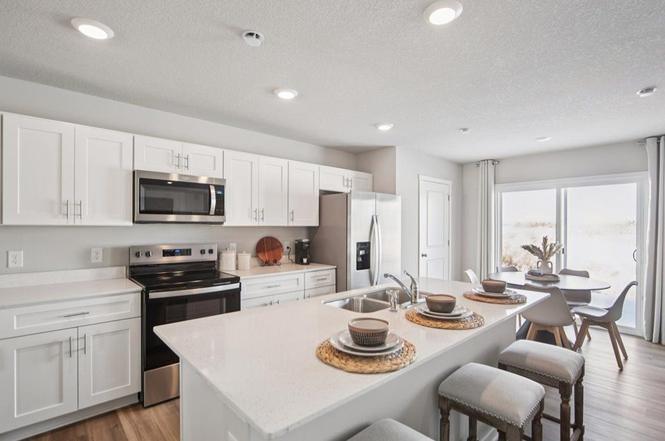
Discover 588 N Kimberlite St in Tiffin, IA. This thoughtfully designed two-story townhome offers 3 bedrooms, 2.5 bathrooms, and 1,511 sq. ft. of comfortable living space. Step inside to a long foyer that leads you to the heart of the home-a bright, open-concept main floor seamlessly connecting the kitchen, dining, and great room, complete with a cozy electric fireplace. The kitchen shines with sleek white cabinetry, stainless steel appliances, and a spacious island, perfect for everyday living and entertaining. Upstairs, all bedrooms are thoughtfully positioned for privacy. At the front of the home, the primary bedroom boasts a generous walk-in closet and an en-suite bathroom with dual vani
Key facts
- Spacious island
- Large walk-in closet
- White cabinetry
Tags
Property features AI
Finance
- Financial info: List price $259,990
Exterior
- Parking: 2 garage spaces (2 total parking spaces)
- Home design: Single-family (spec) — Sydney plan
- Exterior features: Living area approximately 1511; Located at 588 N Kimberlite St, Tiffin, IA
Interior
- Bedrooms: 3 bedrooms
- Bathrooms: 2 full bathrooms and 1 half bathroom
- Interior features: Spec home (Sydney plan); Active listing
Neighborhood map
What this means for you Summary
Snapshot
- This is a 3-bed/2.5-bath townhouse listed at $260k.
Deal economics
- At list price, monthly cash flow is $-112 ($-1k/yr) — negative.
- To cash-flow at today's rent, offer at most $244k (6.2% below list).
- To meet the 1% rule (rent ≥ 1% of price), the offer needs to be $239k (8.2% below list).
- Recommended offer: $239k (8.2% below list) — sets the bar for 1% rule.
- Cap rate 5.8% vs local median 4.2% in Tiffin — top-decile yield for the area; either an underpriced asset or a hidden risk that comps aren't pricing in. Stress-test before assuming the spread holds.
Location & tenants
- Location reads 75/100 on livability (#220 in IA, #4,085 nationally) — a middle-class / working-renter tenant base. Strengths: crime A+, employment A+, cost of living A+; Watch: health & safety D, amenities F, commute F.
- Clear Creek Amana Community School District (rural): math 73% / reading 75% proficiency, ranked #72 of 289 in IA (top 25%) — strong family-tenant draw, lease renewals of 3-5y typical; only 17% free/reduced lunch — higher-income household profile.
- Zoned schools: Tiffin Elementary (math 67% / reading 52%, grade B-, #390 of 616 statewide, top 69%, 400 students, 30% FRL); Clear Creek Amana Middle School (math 76% / reading 76%, grade A, #59 of 246 statewide, top 26%, 640 students, 29% FRL); Clear Creek Amana High School (math 71% / reading 85%, grade A-, #53 of 336 statewide, top 16%, 728 students, 23% FRL).
- Market conditions: 216 active listings in the ZIP; 3 comparable units currently listed for rent nearby; rentals at typical pace (median 15d on market — plan ~3-4 weeks tenant-placement turnaround); solid renter incomes; 714 units permitted in Johnson County in 2024 (158 in 5+ unit buildings).
Forward outlook
- Local home prices are declining (-3.0%/yr); year-one equity from $2k of loan paydown is wiped out by about $8k of value loss. Plan a longer hold.
- Johnson County population projected at +60% by 2050 — long-run rental-demand tailwind backs the buy-and-hold thesis.
Negotiation context
- It's been on market 63 days — a 6% lower offer ($244k) is reasonable based on typical stale-listing flexibility.
Questions for the listing agent
- What do current leases actually rent for vs. the listed asking? Can we see a recent rent roll and the last 12 months of T-12 income?
- It's been on market 63 days. Have you received any prior offers? Is the seller open to a 8% concession, seller financing, or rate buy-down credit?
- What does the HOA fee cover, when was the last increase, and are there any pending special assessments or reserve-fund shortfalls?
- Why hasn't it sold? Are there any deal-killer items the seller is aware of (foundation, flood, title, zoning, code violations)?
- Is there a deadline driving the sale (1031 exchange, divorce, estate, relocation)? That informs how much negotiation room exists.
- Schools are A-rated — typically a magnet for longer-tenancy family renters. What's the average tenant stay here, and is there a school-zone premium baked into asking?
- The area grade is low — what's the realistic commute time and amenity access for the typical tenant pool here? Any planned neighborhood developments (good or bad) we should know about?
- What's the average days-on-market for RENTAL listings here right now (not sales)? A rising rental-DOM trend means longer vacancies and softer asking-rent achievability than the comps imply.
- What's the recent tenant-quality profile in this submarket — average credit score on applications, eviction rate, late-payment / NSF rate, and stable-employment percentage? A property-management company in the area should have these aggregated.
- How much new for-sale + rental construction is in the pipeline within 1–3 miles? Heavy new supply typically softens prices + rents 12–24 months out; constrained supply supports both.
Investment metrics
- 1% rule
- 0.92% ✗
- Cap rate
- 5.78%
- Cash-on-cash
- -1.85%
- DSCR
- 0.92
- GRM
- 9.1
CMA / ARV
- ARV (on-the-fly)
- $252,337
- Comps found
- 12
Show comp detail 12 sales within ~0.75 mi
| Address | Dist | Beds/Ba | Sqft | Sold | Price | $/sf | Match |
|---|---|---|---|---|---|---|---|
| 566 N Kimberlite St | 0.03mi | 3/2.5 | 1,511 (0%) | 1mo | $253,990 | $168 | 98 |
| 568 N Kimberlite St | 0.02mi | 3/2.5 | 1,511 (0%) | 1mo | $252,990 | $167 | 98 |
| 560 N Kimberlite St | 0.04mi | 3/2.5 | 1,511 (0%) | 2mo | $264,990 | $175 | 97 |
| 564 N Kimberlite St | 0.03mi | 3/2.5 | 1,511 (0%) | 3mo | $251,990 | $167 | 96 |
| 562 N Kimberlite St | 0.04mi | 3/2.5 | 1,511 (0%) | 4mo | $249,990 | $165 | 95 |
| 555 Bluestem St | 0.07mi | 3/2.5 | 1,511 (0%) | 3mo | $244,990 | $162 | 94 |
| 549 Bluestem St | 0.07mi | 3/2.5 | 1,511 (0%) | 6mo | $264,990 | $175 | 92 |
| 530 Bluestem St | 0.05mi | 3/2.5 | 1,511 (0%) | 7mo | $244,990 | $162 | 91 |
| 553 Bluestem St | 0.07mi | 3/2.5 | 1,511 (0%) | 6mo | $243,990 | $161 | 91 |
| 559 Bluestem St | 0.07mi | 3/2.5 | 1,511 (0%) | 7mo | $269,990 | $179 | 91 |
| 189 Stephans St St | 0.44mi | 2/2.0 (-1) | 1,540 (+2%) | 3mo | $269,000 | $175 | 67 |
| 515 Potter St | 0.39mi | 2/2.5 (-1) | 1,592 (+5%) | 7mo | $160,000 | $101 | 62 |
Match score weights: distance 35% · size 25% · config 20% · recency 20%. Top-matched comps best support the ARV.
Projected returns pro-forma
-3.0% appreciation · 3.0% rent growth · sell at horizon
- IRR
- -19.3%
- Equity multiple
- 0.33×
- Total profit
- $-49,117
- Equity at exit
- $38,765
- IRR
- -11.8%
- Equity multiple
- 0.29×
- Total profit
- $-51,328
- Equity at exit
- $22,479
Cash invested: $72,797 (down + closing). Projections, not guarantees.
Landlord ↔ Tenant lean methodology
- Overall (STATE)
- 83 Strongly Landlord-Friendly
- State Iowa
- 83 Strongly Landlord-Friendly · R+6
- County
- — inherits STATE
- City
- — inherits STATE
ZIP-level market 52340
- Home prices YoY
- -8.8%
- Active inventory
- 216
- Price-to-rent
- 9.1×
Monthly cashflow live
- Estimated rent
- $2,385 medium interval (Pro) →
- Mortgage (P&I)
- −$1,363
- Tax est. 1.5%
- −$325 /mo · $3,900/yr
- Insurance
- −$108
- HOA
- −$200
- Vacancy / Maint / Mgmt
- −$501
- Net cashflow
- $-112
Break-even live
Sensitivity live
| Price | -10% $67 | -5% $-22 | +0% $-112 | +5% $-202 | +10% $-292 |
|---|---|---|---|---|---|
| Rent | -10% $-301 | -5% $-206 | +0% $-112 | +5% $-18 | +10% $76 |
| Rate | -1.0pp $19 | -0.5pp $-46 | base $-112 | +0.5pp $-180 | +1.0pp $-248 |
UW: 25.0% down · 7.5% · 30yr · 1.5% tax · 5.0% vac · 8.0% maint · 8.0% mgmt
Financing live
Cash to close
- Down payment
- $64,998
- Closing costs
- $7,800
- Reserves months
- —
- Total cash needed
- —
Loan-product check · same deal, 3 products live
Conventional
25% down · 7.5% · 30yr
- Down + closing
- —
- Monthly P&I
- —
- Monthly cashflow
- —
- DSCR
- —
- Eligible?
- —
Personal DTI + credit; lowest rate.
DSCR
20% down · 8.5% · 30yr
- Down + closing
- —
- Monthly P&I
- —
- Monthly cashflow
- —
- DSCR
- —
- Eligible?
- —
No personal income docs; deal must DSCR.
Hard money
10% down · 12.0% · 12mo
- Down + closing
- —
- Monthly P&I
- —
- Monthly cashflow
- —
- DSCR
- —
- Eligible?
- —
Short-term bridge; refi at stabilization.
Rent comps 3 comps
| Address | Beds | Baths | Sqft | Rent | $/sqft | DOM | Units | Dist |
|---|---|---|---|---|---|---|---|---|
| 630 Catherine Dr Tiffin, IA | 3.0 | 3.5 | 1795 | $2,350 | $1.31 | 15d | 1 | 0.49mi |
| 628 Catherine Dr Tiffin, IA | 3.0 | 3.5 | 1795 | $2,350 | $1.31 | 15d | 1 | 0.49mi |
| 425 Bainberry St Tiffin, IA | 3.0 | 2.5 | 1750 | $2,045 | $1.17 | 45d | 2 | 1.37mi |
HOA detail
- Monthly dues
- $200 · $2,400/yr
- Likely covers
- electric
Listing history 18 events
-
2026-06-22days on market $259,990 Active 63 DOM
-
2026-06-19days on market $259,990 Active 61 DOM
-
2026-06-18days on market $259,990 Active 60 DOM
-
2026-06-17days on market $259,990 Active 59 DOM
-
2026-06-16days on market $259,990 Active 58 DOM
-
2026-06-15days on market $259,990 Active 57 DOM
-
2026-06-14days on market $259,990 Active 55 DOM
-
2026-06-13days on market $259,990 Active 54 DOM
-
2026-06-10days on market $259,990 Active 52 DOM
-
2026-06-09days on market $259,990 Active 51 DOM
-
2026-06-08days on market $259,990 Active 50 DOM
-
2026-06-07days on market $259,990 Active 49 DOM
-
2026-06-05days on market $259,990 Active 46 DOM
-
2026-06-03days on market $259,990 Active 45 DOM
-
2026-06-02days on market $259,990 Active 44 DOM
-
2026-06-01days on market $259,990 Active 43 DOM
-
2026-05-31days on market $259,990 Active 42 DOM
-
2026-05-30days on market $259,990 Active 58 DOM
ⓘ Source: listings_history table (triggers on properties + properties_extension) + one-shot
backfill from property_details.listing_events for pre-trigger history.
Nearby sold comps map
Loading sold comps map…
Walkable amenities ~0.75 mi
Loading nearby amenities…
Taxation est. · year 1
- Rental income
- $28,626
- − Mortgage interest
- −$14,563
- − Property taxes
- −$3,900
- − Insurance
- −$1,300
- − Repairs & maintenance
- −$2,290
- − Management
- −$2,290
- − HOA
- −$2,400
- − Depreciation
- −$7,563
- Taxable loss
- −$5,681
- Est. tax savings @ 24.0%
- +$1,363
- After-tax cash flow
- $17/yr
For passive investors: Depreciation is non-cash, so a rental often shows a tax loss while cash-flowing — sheltering income. Rental losses are passive: they offset passive income freely, and up to $25,000/yr can offset ordinary (W-2) income if you actively participate and your MAGI is under $100k (phasing out to $0 by $150k); unused losses carry forward. On sale, claimed depreciation is recaptured at up to 25%, and gains may owe capital-gains tax (a 1031 exchange can defer both). Figures are a year-1 estimate at your 24.0% rate — not tax advice; consult a CPA.
Schools (NCES district)
- District
- Clear Creek Amana Community School District
- NCES district ID
- 1907590
- Math proficiency
- 73% ▼ -6.00%
- Reading proficiency
- 75% ▼ -1.00%
- Median HH income
- $62,915
- Composite
- 63.92/100
- National rank
- #586
- State rank
- #72 of 289 in IA
Livability — Tiffin
- Score
- 75/100
- State rank
- #220
- US rank
- #4085
Category grades
Schools grade is shown separately in the Schools card above.
Census & demographics
- Census place
- Tiffin, IA
- County
- Johnson County · 132,710 people
- City population
- 6,128
- Metro
- Iowa City, IA
- Population (ZIP)
- 6,128
- Household income
- $98,393
- Rent vs Own
- Severe rent burden
- 149.0
Population outlook (Johnson County) Hauer SSP2
- Today (2025)
- 180,405 people
- By 2030
- 200,014 · +10.9%
- By 2040
- 241,428 · +33.8%
- By 2050
- 288,144 · +59.7%
- By 2075
- 420,009 · +132.8%
- By 2100
- 546,596 · +203.0%
Race, ethnicity, and origin ACS 2023
- Neighborhood character
- Predominantly White (80%)
- Race & ethnicity
- White 80% Two or more races 7% Black 5% Hispanic / Latino 5% Asian 3%
- Common ancestry
- Italian 7% Portuguese 5% Romanian 3%
- Foreign-born
- 4% · China, United Kingdom, Canada
- Languages at home
- 95% English-only · Chinese 1% Spanish 1% French/Haitian/Cajun 1%
Political lean MEDSL · Johnson
- 2024 margin
- Solid D (+38.1) · D 68.4% · R 30.3% · Other 1.3%
- 2008→2024 swing
- -3.4pp toward R · 2008: 41.5pp · 2024: 38.1pp
- All cycles
- 2024: D+38.1 2020: D+43.2 2016: D+38.3 2012: D+35.4 2008: D+41.5
Not yet ingested
- Civics
- —
Market trends
- HPI YoY
- ▼ -16.59%
- Current HPI
- 172.251
- Rent YoY
- —
- Metro
- Iowa City, IA
- State GDP YoY
- ▲ 2.48%
- F500 in state
- 4
Industry mix (Fortune 500 HQ in IA)
| Industry | F500 HQs | Revenue |
|---|---|---|
| Financial Services | 1 | $16B |
|
||
| Retail / Convenience | 1 | $15B |
|
||
Cash-flow waterfall
monthlySold comps — $/sqft
last 12 mo · ≤1 miLoading sold comps…