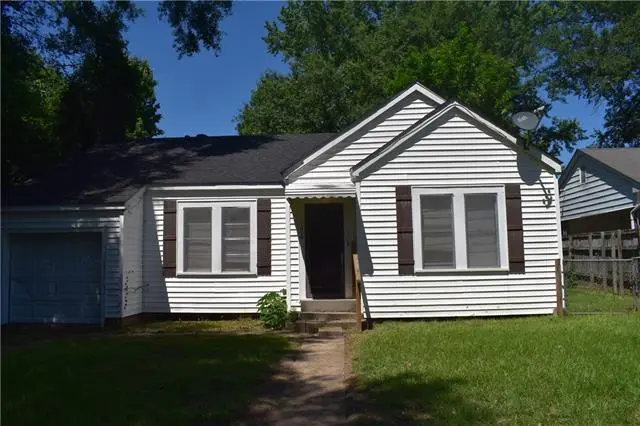
1556 Berry St · Natchitoches, LA
Flood risk 1/10 · Minimal
- FEMA flood zone
- X (unshaded)
- Chance of flooding over 30 yrs
- 0.0%
- Est. flood insurance / yr
- $507 – $1,088
Fire risk 3/10 · Minor
- Est. fire insurance / yr
- $1,269 – $2,357
Heat risk 8/10 · Major
- Hot days now (above 111°F)
- 7 days/yr
- Hot days in 30 yrs
- 21 days/yr
Wind risk 8/10 · Major
- Chance of severe wind over 30 yrs
- 80.0%
Air-quality risk 1/10 · Minimal
- Unhealthy air days now
- 0 days/yr
- Unhealthy air days in 30 yrs
- 0 days/yr
Risk factors via First Street. Map © Google.
Why this score? — see what drove the C+ grade
The composite is a weighted blend of 9 inputs, each scored 0–100. Each bar is that input's sub-score; the figure is the points it added to the 100-point composite (weight × sub-score).
- Cash flow +26.1/30.0
- ARV discount +10.7/15.0
- DSCR +8.8/10.0
- 1% rule +6.2/10.0
- Livability +2.7/5.0
- Schools +2.6/10.0
- Rent growth +2.5/5.0
- Condition / age +2.5/5.0
- Appreciation +0.0/10.0
$95,000
🖨 Deal sheet 📄 Offer letter ✓ Due diligence
Listing remarks
Charming Southern Cottage located just minutes from Downtown, would make a good Investment property. Property is in good condition. Property has two nice size bedrooms and two working bathrooms. One with tub and shower the other with just shower. Property has original hard wood floors and they are in good condition. Fridge and stove come with property and working fine. There is a small shed out back and yard is fenced in back. Call for your showing today, won't be on market long.
Key facts
- Fenced yard
- Small shed
- Good condition
Tags
Property features AI
Exterior
- Parking: Attached parking; Carport
- Home design: Single family residence
- Construction: Vinyl siding; Composition roof
- Exterior features: Chain link, wood, and other fencing; Workshop on the property; Acreage
Interior
- Kitchen: Refrigerator included
- Bedrooms: Two bedrooms (Bedroom 1, Bedroom 2)
- Bathrooms: 2 full bathrooms
- Heating & cooling: Central heating; Central air conditioning
- Interior features: Living room; Dining room; Kitchen; Bedroom 1; Bedroom 2
Neighborhood map
What this means for you Summary
Snapshot
- This is a 2-bed/2.0-bath single-family listed at $95k.
Deal economics
- At list price, monthly cash flow is $240 ($3k/yr) — positive.
- The deal already cash-flows at list — no discount required.
- Meets the 1% rule at list price ($1k rent vs $95k).
- Recommended offer: $92k (3.0% below list) — sets the bar for market timing.
- Cap rate 9.3% vs local median 3.6% in Natchitoches — top-decile yield for the area; either an underpriced asset or a hidden risk that comps aren't pricing in. Stress-test before assuming the spread holds.
Location & tenants
- Location reads 54/100 on livability (#382 in LA) — a working-class tenant base; expect higher turnover. Strengths: cost of living A+; Watch: schools C-, health & safety C-, housing D+.
- Natchitoches Parish (town): math 29% / reading 36% proficiency, ranked #41 of 98 in LA (top 42%) — families likely to look elsewhere, expect single-tenant / working-renter base with shorter leases; 69% free/reduced lunch — lower-income household profile, screen leases tightly.
- Market conditions: 158 active listings in the ZIP; 95 units permitted in Natchitoches Parish in 2024 (0 in 5+ unit buildings).
Forward outlook
- Local home prices are declining (-3.0%/yr); year-one equity from $657 of loan paydown is wiped out by about $3k of value loss. Plan a longer hold.
- Natchitoches County population projected at -12% by 2050 — secular population decline; favor cash flow + early exit over multi-decade hold.
Negotiation context
- It's been on market 35 days — a 3% lower offer ($92k) is reasonable based on typical stale-listing flexibility.
- 2 sale attempts since 16y ago with the ask held roughly flat each time — persistent listings suggest the price (not the market) is what's stuck; bring a comps-based counter.
Risks & watch-outs
- Watch-outs: built in 1959 — expect roof / HVAC / electrical / plumbing capex.
- Climate carrying-cost: severe wind risk, 80% chance of damaging wind over 30y; extreme-heat days projected 7→21/yr by 2055 (HVAC capex compounding) — expect insurance premiums to compound above CPI over the hold.
Questions for the listing agent
- It's been on market 35 days. Have you received any prior offers? Is the seller open to a 3% concession, seller financing, or rate buy-down credit?
- Built in 1959 — when were the roof, HVAC, electrical panel, plumbing, and water heater last replaced?
- Is there a deadline driving the sale (1031 exchange, divorce, estate, relocation)? That informs how much negotiation room exists.
- Crime grade is F in this area — have there been break-ins, vandalism, or insurance claims at this property in the last 3 years? What carrier currently insures it and at what premium?
- What's the average days-on-market for RENTAL listings here right now (not sales)? A rising rental-DOM trend means longer vacancies and softer asking-rent achievability than the comps imply.
- What's the recent tenant-quality profile in this submarket — average credit score on applications, eviction rate, late-payment / NSF rate, and stable-employment percentage? A property-management company in the area should have these aggregated.
- How much new for-sale + rental construction is in the pipeline within 1–3 miles? Heavy new supply typically softens prices + rents 12–24 months out; constrained supply supports both.
Investment metrics
- 1% rule
- 1.12% ✓
- Cap rate
- 9.32%
- Cash-on-cash
- 10.83%
- DSCR
- 1.48
- GRM
- 7.4
CMA / ARV
- ARV (median comp)
- $102,268
- List price
- $95,000
- Delta
- -7.11%
- Verdict
- FAIR
- Comps
- 2 within 1.0 mi
Show comp detail 1 sale within ~0.75 mi
| Address | Dist | Beds/Ba | Sqft | Sold | Price | $/sf | Match |
|---|---|---|---|---|---|---|---|
| 816 Dixie St | 0.43mi | 3/1.0 (+1) | 1,100 (-11%) | 7mo | $34,900 | $32 | 46 |
Match score weights: distance 35% · size 25% · config 20% · recency 20%. Top-matched comps best support the ARV.
Projected returns pro-forma
-3.0% appreciation · 3.0% rent growth · sell at horizon
- IRR
- -0.1%
- Equity multiple
- 1.00×
- Total profit
- $-123
- Equity at exit
- $14,165
- IRR
- 9.5%
- Equity multiple
- 1.73×
- Total profit
- $19,511
- Equity at exit
- $8,214
Cash invested: $26,600 (down + closing). Projections, not guarantees.
Landlord ↔ Tenant lean methodology
- Overall (STATE)
- 90 Strongly Landlord-Friendly
- State Louisiana
- 90 Strongly Landlord-Friendly · R+12
- County
- — inherits STATE
- City
- — inherits STATE
ZIP-level market 71457
- Active inventory
- 158
- Price-to-rent
- 7.4×
Monthly cashflow live
- Estimated rent
- $1,068 medium interval (Pro) →
- Mortgage (P&I)
- −$498
- Tax from tax record
- −$66 /mo · $793/yr
- Insurance
- −$40
- HOA
- −$0
- Vacancy / Maint / Mgmt
- −$224
- Net cashflow
- $240
Break-even live
UW: 25.0% down · 7.5% · 30yr · 1.5% tax · 5.0% vac · 8.0% maint · 8.0% mgmt
Financing live
Cash to close
- Down payment
- $23,750
- Closing costs
- $2,850
- Reserves months
- —
- Total cash needed
- —
Loan-product check · same deal, 3 products live
Conventional
25% down · 7.5% · 30yr
- Down + closing
- —
- Monthly P&I
- —
- Monthly cashflow
- —
- DSCR
- —
- Eligible?
- —
Personal DTI + credit; lowest rate.
DSCR
20% down · 8.5% · 30yr
- Down + closing
- —
- Monthly P&I
- —
- Monthly cashflow
- —
- DSCR
- —
- Eligible?
- —
No personal income docs; deal must DSCR.
Hard money
10% down · 12.0% · 12mo
- Down + closing
- —
- Monthly P&I
- —
- Monthly cashflow
- —
- DSCR
- —
- Eligible?
- —
Short-term bridge; refi at stabilization.
Listing history 18 events
-
2026-06-19days on market $95,000 Active 35 DOM
-
2026-06-18days on market $95,000 Active 34 DOM
-
2026-06-17days on market $95,000 Active 33 DOM
-
2026-06-16days on market $95,000 Active 32 DOM
-
2026-06-15days on market $95,000 Active 31 DOM
-
2026-06-14days on market $95,000 Active 29 DOM
-
2026-06-12days on market $95,000 Active 28 DOM
-
2026-06-09days on market $95,000 Active 25 DOM
-
2026-06-08days on market $95,000 Active 24 DOM
-
2026-06-07days on market $95,000 Active 23 DOM
-
2026-06-07days on market $95,000 Active 22 DOM
-
2026-06-04days on market $95,000 Active 19 DOM
-
2026-06-02days on market $95,000 Active 18 DOM
-
2026-06-01days on market $95,000 Active 17 DOM
-
2026-05-31days on market $95,000 Active 16 DOM
-
2026-05-31days on market $95,000 Active 15 DOM
-
2026-05-15$95,000 Active 484-char remark
-
2010-02-19$84,500
ⓘ Source: listings_history table (triggers on properties + properties_extension) + one-shot
backfill from property_details.listing_events for pre-trigger history.
Tax reassessment forecast LA · Resets to sale price
- Current annual tax
- $793 · $66/mo
- Projected year-2 tax
- $793 · $66/mo
- Expected delta
- $0/yr ($0/mo · -0.0%)
ⓘ Screening estimate from a state-policy table — verify with the county assessor before closing.
Climate risk First Street
- Flood 1/10 Low FEMA zone X (unshaded) · 0% chance over 30 yrs
- Wildfire 3/10 Moderate
- Heat 8/10 Severe 7 d/yr ≥111°F today · 21 d/yr by 30 yrs out
- Wind 8/10 Severe 80% chance of damaging wind over 30 yrs
- Air quality 1/10 Low 0 unhealthy d/yr today · 0 by 30 yrs out
Nearby sold comps map
Loading sold comps map…
Walkable amenities ~0.75 mi
Loading nearby amenities…
Taxation est. · year 1
- Rental income
- $12,819
- − Mortgage interest
- −$5,321
- − Property taxes
- −$793
- − Insurance
- −$475
- − Repairs & maintenance
- −$1,026
- − Management
- −$1,026
- − Depreciation
- −$2,764
- Taxable income
- $1,414
- Est. tax owed @ 24.0%
- −$339
- After-tax cash flow
- $2,541/yr
For passive investors: Depreciation is non-cash, so a rental often shows a tax loss while cash-flowing — sheltering income. Rental losses are passive: they offset passive income freely, and up to $25,000/yr can offset ordinary (W-2) income if you actively participate and your MAGI is under $100k (phasing out to $0 by $150k); unused losses carry forward. On sale, claimed depreciation is recaptured at up to 25%, and gains may owe capital-gains tax (a 1031 exchange can defer both). Figures are a year-1 estimate at your 24.0% rate — not tax advice; consult a CPA.
Schools (NCES district)
- District
- Natchitoches Parish
- NCES district ID
- 2201140
- Math proficiency
- 29% ▼ -27.00%
- Reading proficiency
- 36% ▼ -27.00%
- Median HH income
- $30,204
- Composite
- 26.36/100
- National rank
- #7235
- State rank
- #41 of 98 in LA
Livability — Natchitoches
- Score
- 54/100
- State rank
- #382
- US rank
- #23935
Category grades
Schools grade is shown separately in the Schools card above.
Census & demographics
- Census place
- Natchitoches, LA
- City population
- 27,214
- Population (ZIP)
- 25,485
Population outlook (Natchitoches County) Hauer SSP2
- Today (2025)
- 38,130 people
- By 2030
- 37,412 · -1.9%
- By 2040
- 35,550 · -6.8%
- By 2050
- 33,580 · -11.9%
- By 2075
- 29,268 · -23.2%
- By 2100
- 23,909 · -37.3%
Race, ethnicity, and origin ACS 2023
- Neighborhood character
- Diverse neighborhood (Simpson 0.58)
- Race & ethnicity
- Black 47% White 45% Two or more races 5% Hispanic / Latino 3%
- Common ancestry
- Lithuanian 5% Italian 1% Serbian 1%
- Foreign-born
- 2% · Canada
- Languages at home
- 97% English-only · Spanish 2% French/Haitian/Cajun 1%
Political lean MEDSL · Natchitoches
- 2024 margin
- Strong R (+22.4) · D 38.2% · R 60.5% · Other 1.3%
- 2008→2024 swing
- -15.0pp toward R · 2008: -7.3pp · 2024: -22.4pp
- All cycles
- 2024: R+22.4 2020: R+14.9 2016: R+11.0 2012: R+6.6 2008: R+7.3
Not yet ingested
- Civics
- —
Market trends
- HPI YoY
- ▼ -121.84%
- Current HPI
- 103.9202
- Rent YoY
- —
- Metro
- —
- State GDP YoY
- ▲ 3.29%
- F500 in state
- 10
Industry mix (Fortune 500 HQ in LA)
| Industry | F500 HQs | Revenue |
|---|---|---|
| Telecommunications | 2 | $23B |
|
||
| Utilities | 1 | $12B |
|
||
| Wholesale / Distribution | 1 | $5B |
|
||
| Advertising | 1 | $2B |
|
||
Price history
+12.4% since first listed2 events — show timeline
- 2026-05-15 Listed $95,000 AcadianaMLS
- 2010-02-19 Listed $84,500 AcadianaMLS
Property tax history
+0.4%/yrLatest (2025): $793 · +0.1% YoY. Source: county tax records.
Cash-flow waterfall
monthlySold comps — $/sqft
last 12 mo · ≤1 miLoading sold comps…