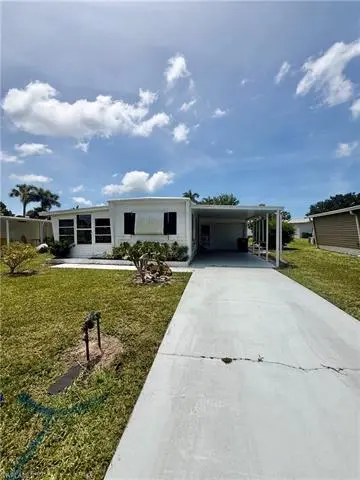
514 Monte Carlo Ln · Lely, FL
Flood risk 9/10 · Severe
- FEMA flood zone
- AE
- Chance of flooding over 30 yrs
- 0.98%
- Est. flood insurance / yr
- $1,737 – $8,500
Fire risk 3/10 · Minor
- Est. fire insurance / yr
- $947 – $1,759
Heat risk 9/10 · Severe
- Hot days now (above 107°F)
- 5 days/yr
- Hot days in 30 yrs
- 19 days/yr
Wind risk 10/10 · Severe
- Chance of severe wind over 30 yrs
- 99.0%
Air-quality risk 2/10 · Minimal
- Unhealthy air days now
- 2 days/yr
- Unhealthy air days in 30 yrs
- 2 days/yr
Risk factors via First Street. Map © Google.
Why this score? — see what drove the B grade
The composite is a weighted blend of 9 inputs, each scored 0–100. Each bar is that input's sub-score; the figure is the points it added to the 100-point composite (weight × sub-score).
- Cash flow +30.0/30.0
- 1% rule +10.0/10.0
- DSCR +10.0/10.0
- ARV discount +7.5/15.0
- Schools +5.0/10.0
- Livability +3.3/5.0
- Condition / age +2.5/5.0
- Rent growth +2.1/5.0
- Appreciation +0.0/10.0
$129,999
🖨 Deal sheet 📄 Offer letter ✓ Due diligence
Listing remarks
Welcome to this beautifully maintained 2-bedroom+den, 2 bath mobile home located on a peaceful and private lot in the highly sought-after Riviera Colony. This inviting residence offers comfortable, low-maintenance living in a quiet, friendly, and active 55+ community—all at an affordable price. Best of all, you own the land, which means no land lease fees. The home features a NEW ROOF from 2023, a functional layout, plenty of natural light, and comfortable space to relax or entertain. With a quarterly fee of just $395, residents enjoy a well-kept neighborhood where pride of ownership truly shines. Ideally located just 6 miles from Naples’ beautiful white sandy beaches and close
Key facts
- Peaceful lot
- Own the land
- New roof
Tags
Property features AI
Finance
- Other: No commercial use allowed (restrictions)
- HOA & community: Mandatory HOA; Quarterly master HOA fee of $135 ($540 annually); HOA covers insurance, legal/accounting, and management; Professional management; Community amenities include clubhouse, community pool, and shuffleboard
Exterior
- Parking: Attached carport (1 space)
- Utilities: Central water; Central sewer; Electric service (central)
- Home design: Manufactured residential home; Split level design; Built in 1969; Rear exposure faces south; Located in Riviera Colony (non-gated mobile/manufactured community)
- Construction: Vinyl siding exterior; Metal roof; Manufactured construction
- Exterior features: Room for a pool; Shutters for storm protection; Single-hung windows; Landscaped view; Central irrigation
Interior
- Kitchen: Electric cooktop; Microwave; Refrigerator
- Bedrooms: 2 bedrooms plus den; Split bedroom floor plan
- Flooring: Carpet; Vinyl
- Bathrooms: 2 full bathrooms; Master bathroom with combo tub and shower
- Heating & cooling: Central electric heat; Central electric cooling
- Interior features: Cable prewire; Eat-in kitchen; Den/Study; Florida room; Laundry in garage; Unfurnished
- Laundry & utility: Washer/dryer hookup; Laundry area in garage
Neighborhood map
What this means for you Summary
Snapshot
- This is a 2-bed/2.0-bath manufactured listed at $130k.
Deal economics
- At list price, monthly cash flow is $526 ($6k/yr) — positive.
- The deal already cash-flows at list — no discount required.
- Meets the 1% rule at list price ($2k rent vs $130k).
- Recommended offer: $126k (3.0% below list) — sets the bar for market timing.
Location & tenants
- Location reads 66/100 on livability (#586 in FL) — a middle-class / working-renter tenant base. Strengths: crime A+, housing A+; Watch: schools D+, health & safety D, amenities F.
- Collier (suburban): math 60% / reading 56% proficiency, ranked #16 of 73 in FL (top 22%) — acceptable for families but not a draw, mixed tenant base, ~2y average lease.
- Market conditions: Rents soft (-1.7%/yr); 771 active listings in the ZIP; 2 comparable units currently listed for rent nearby; 3,520 units permitted in Collier County in 2024 (959 in 5+ unit buildings).
- This rent runs 40% of the median local income ($70k/yr) — at the standard rent-burdened threshold; future hikes will face affordability resistance.
Forward outlook
- Local home prices are declining (-3.0%/yr); year-one equity from $899 of loan paydown is wiped out by about $4k of value loss. Plan a longer hold.
- Collier County population projected at +30% by 2050 — long-run rental-demand tailwind backs the buy-and-hold thesis.
Negotiation context
- It's been on market 38 days — a 3% lower offer ($126k) is reasonable based on typical stale-listing flexibility.
- Current owner paid $33k; list at $130k implies a 294% gain — meaningful room to come down on a strong offer.
Risks & watch-outs
- Watch-outs: flood insurance adds $427/mo.
- Climate carrying-cost: in FEMA flood zone AE (mandatory federal flood insurance); severe wind risk, 99% chance of damaging wind over 30y; extreme-heat days projected 5→19/yr by 2055 (HVAC capex compounding) — expect insurance premiums to compound above CPI over the hold.
Questions for the listing agent
- It's been on market 38 days. Have you received any prior offers? Is the seller open to a 3% concession, seller financing, or rate buy-down credit?
- Built in 1969 — when were the roof, HVAC, electrical panel, plumbing, and water heater last replaced?
- What's the actual annual flood-insurance premium (NFIP or private), and is the property in a SFHA with mandatory coverage?
- What does the HOA fee cover, when was the last increase, and are there any pending special assessments or reserve-fund shortfalls?
- Is there a deadline driving the sale (1031 exchange, divorce, estate, relocation)? That informs how much negotiation room exists.
- Schools are D-rated, which usually means shorter tenancies and higher turnover. Who's the typical renter profile here, and what's been the actual vacancy rate?
- What's the average days-on-market for RENTAL listings here right now (not sales)? A rising rental-DOM trend means longer vacancies and softer asking-rent achievability than the comps imply.
- What's the recent tenant-quality profile in this submarket — average credit score on applications, eviction rate, late-payment / NSF rate, and stable-employment percentage? A property-management company in the area should have these aggregated.
- How much new for-sale + rental construction is in the pipeline within 1–3 miles? Heavy new supply typically softens prices + rents 12–24 months out; constrained supply supports both.
Investment metrics
- 1% rule
- 1.79% ✓
- Cap rate
- 15.08%
- Cash-on-cash
- 31.40%
- DSCR
- 2.40
- GRM
- 4.6
CMA / ARV
No comps found within radius.
Projected returns pro-forma
-3.0% appreciation · 0.0% rent growth · sell at horizon
- IRR
- 4.4%
- Equity multiple
- 1.16×
- Total profit
- $5,884
- Equity at exit
- $19,383
- IRR
- 9.9%
- Equity multiple
- 1.63×
- Total profit
- $23,022
- Equity at exit
- $11,240
Cash invested: $36,400 (down + closing). Projections, not guarantees.
Landlord ↔ Tenant lean methodology
- Overall (STATE)
- 87 Strongly Landlord-Friendly
- State Florida
- 87 Strongly Landlord-Friendly · R+3
- County
- — inherits STATE
- City
- — inherits STATE
ZIP-level market 34112
- Rents YoY
- -1.7%
- Active inventory
- 771
- Price-to-rent
- 4.6×
Monthly cashflow live
- Estimated rent
- $2,332 medium interval (Pro) →
- Mortgage (P&I)
- −$682
- Tax from tax record
- −$109 /mo · $1,311/yr
- Insurance
- −$54
- Flood insurance flood zone
- −$427 /mo · $5,118/yr
- HOA
- −$45
- Vacancy / Maint / Mgmt
- −$490
- Net cashflow
- $526
Break-even live
UW: 25.0% down · 7.5% · 30yr · 1.5% tax · 5.0% vac · 8.0% maint · 8.0% mgmt
Financing live
Cash to close
- Down payment
- $32,500
- Closing costs
- $3,900
- Reserves months
- —
- Total cash needed
- —
Loan-product check · same deal, 3 products live
Conventional
25% down · 7.5% · 30yr
- Down + closing
- —
- Monthly P&I
- —
- Monthly cashflow
- —
- DSCR
- —
- Eligible?
- —
Personal DTI + credit; lowest rate.
DSCR
20% down · 8.5% · 30yr
- Down + closing
- —
- Monthly P&I
- —
- Monthly cashflow
- —
- DSCR
- —
- Eligible?
- —
No personal income docs; deal must DSCR.
Hard money
10% down · 12.0% · 12mo
- Down + closing
- —
- Monthly P&I
- —
- Monthly cashflow
- —
- DSCR
- —
- Eligible?
- —
Short-term bridge; refi at stabilization.
Rent comps 2 comps
| Address | Beds | Baths | Sqft | Rent | $/sqft | DOM | Units | Dist |
|---|---|---|---|---|---|---|---|---|
| 4360 Petal Dr Naples, FL | 3.0 | 1.0–2.0 | 1018 | $2,566 | $2.52 | 13d | 37 | 0.86mi |
| 4719 Alladin Ln Naples, FL | 1.0–2.0 | 1.0–2.0 | 671 | $1,895 | $2.82 | 23d | 2 | 1.48mi |
HOA detail
- Monthly dues
- $45 · $540/yr
Listing history 17 events
-
2026-06-18days on market $129,999 Active 38 DOM
-
2026-06-17days on market $129,999 Active 37 DOM
-
2026-06-16days on market $129,999 Active 36 DOM
-
2026-06-15days on market $129,999 Active 35 DOM
-
2026-06-14days on market $129,999 Active 33 DOM
-
2026-06-10days on market $129,999 Active 30 DOM
-
2026-06-09days on market $129,999 Active 29 DOM
-
2026-06-08days on market $129,999 Active 28 DOM
-
2026-06-07pricedays on market $129,999 Active 27 DOM
-
2026-06-03days on market $139,999 Active 23 DOM
-
2026-06-02days on market $139,999 Active 22 DOM
-
2026-06-01days on market $139,999 Active 21 DOM
-
2026-05-31days on market $139,999 Active 20 DOM
-
2026-05-30days on market $139,999 Active 19 DOM
-
2026-05-11$139,999 Active
-
1995-02-14soldstatus $33,000
-
1987-04-01soldstatus $28,000
ⓘ Source: listings_history table (triggers on properties + properties_extension) + one-shot
backfill from property_details.listing_events for pre-trigger history.
Tax reassessment forecast FL · Resets to sale price
- Current annual tax
- $1,311 · $109/mo
- Projected year-2 tax
- $1,311 · $109/mo
- Expected delta
- $0/yr ($0/mo · 0.0%)
ⓘ Screening estimate from a state-policy table — verify with the county assessor before closing.
Climate risk First Street
- Flood 9/10 Extreme FEMA zone AE · 98% chance over 30 yrs
- Wildfire 3/10 Moderate
- Heat 9/10 Extreme 5 d/yr ≥107°F today · 19 d/yr by 30 yrs out
- Wind 10/10 Extreme 99% chance of damaging wind over 30 yrs
- Air quality 2/10 Low 2 unhealthy d/yr today · 2 by 30 yrs out
Nearby sold comps map
Loading sold comps map…
Walkable amenities ~0.75 mi
Loading nearby amenities…
Taxation est. · year 1
- Rental income
- $27,989
- − Mortgage interest
- −$7,282
- − Property taxes
- −$1,311
- − Insurance
- −$5,768
- − Repairs & maintenance
- −$2,239
- − Management
- −$2,239
- − HOA
- −$540
- − Depreciation
- −$3,782
- Taxable income
- $4,827
- Est. tax owed @ 24.0%
- −$1,158
- After-tax cash flow
- $5,152/yr
For passive investors: Depreciation is non-cash, so a rental often shows a tax loss while cash-flowing — sheltering income. Rental losses are passive: they offset passive income freely, and up to $25,000/yr can offset ordinary (W-2) income if you actively participate and your MAGI is under $100k (phasing out to $0 by $150k); unused losses carry forward. On sale, claimed depreciation is recaptured at up to 25%, and gains may owe capital-gains tax (a 1031 exchange can defer both). Figures are a year-1 estimate at your 24.0% rate — not tax advice; consult a CPA.
Schools (NCES district)
- District
- Collier
- NCES district ID
- 1200330
- Math proficiency
- 60% ▼ -4.00%
- Reading proficiency
- 56% ▼ -2.00%
- Median HH income
- $58,275
- Composite
- 50.23/100
- National rank
- #1892
- State rank
- #16 of 73 in FL
Livability — Lely
- Score
- 66/100
- State rank
- #586
- US rank
- #11224
Category grades
Schools grade is shown separately in the Schools card above.
Census & demographics
- County
- Collier County · 396,295 people
- Metro
- Naples-Marco Island, FL
- Population (ZIP)
- 27,193
- Household income
- $69,842
- Rent vs Own
- Severe rent burden
- 980.0
Population outlook (Collier County) Hauer SSP2
- Today (2025)
- 420,858 people
- By 2030
- 450,054 · +6.9%
- By 2040
- 502,232 · +19.3%
- By 2050
- 544,932 · +29.5%
- By 2075
- 627,203 · +49.0%
- By 2100
- 659,015 · +56.6%
Race, ethnicity, and origin ACS 2023
- Neighborhood character
- Predominantly White (74%)
- Race & ethnicity
- White 74% Hispanic / Latino 18% Two or more races 9% Black 6% Native American 2% Asian 1%
- Hispanic origin (detail)
- Mexican 7% Puerto Rican 2% Cuban 4% Dominican 1%
- Common ancestry
- Hispanic 4% Romanian 3% Portuguese 2%
- Foreign-born
- 19% · Canada, Jamaica
- Languages at home
- 75% English-only · Spanish 17% French/Haitian/Cajun 4% German/W. Germanic 1%
Political lean MEDSL · Collier
- 2024 margin
- Solid R (+33.1) · D 33.1% · R 66.2%
- 2008→2024 swing
- -10.6pp toward R · 2008: -22.5pp · 2024: -33.1pp
- All cycles
- 2024: R+33.1 2020: R+24.7 2016: R+26.0 2012: R+30.1 2008: R+22.5
Not yet ingested
- Civics
- —
Market trends
- HPI YoY
- ▼ -235.10%
- Current HPI
- 256.9182
- Rent YoY
- ▼ -1.69%
- Metro
- Naples-Marco Island, FL
- State GDP YoY
- ▲ 3.28%
- F500 in state
- 36
Industry mix (Fortune 500 HQ in FL)
| Industry | F500 HQs | Revenue |
|---|---|---|
| Industrial Technology | 2 | $29B |
|
||
| Insurance | 2 | $17B |
|
||
| Retail | 1 | $60B |
|
||
| Technology Distribution | 1 | $58B |
|
||
| Homebuilding | 1 | $35B |
|
||
| Technology Manufacturing | 1 | $35B |
|
||
Price history
+400.0% since first listed3 events — show timeline
- 2026-05-11 Listed $139,999 NAPLESMLS
- 1995-02-14 Sold (Public Records) $33,000 Public Records
- 1987-04-01 Sold (Public Records) $28,000 Public Records
Property tax history
+9.8%/yrLatest (2025): $1,311 · +6.1% YoY. Source: county tax records.
Cash-flow waterfall
monthlySold comps — $/sqft
last 12 mo · ≤1 miLoading sold comps…