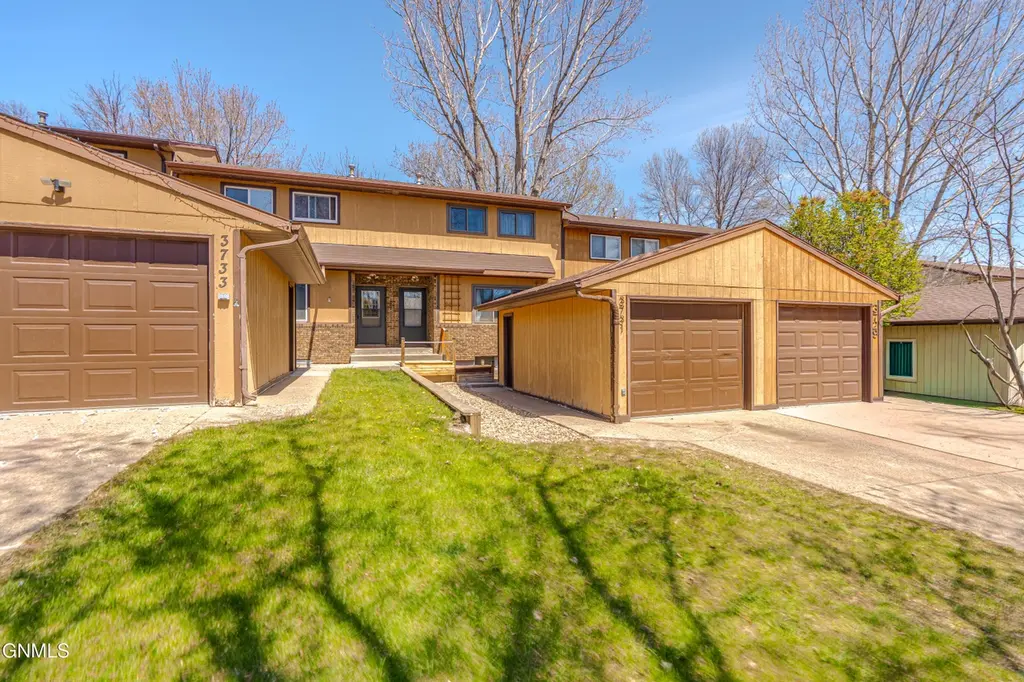
3731 Renee Dr · Bismarck, ND
Flood risk 1/10 · Minimal
- FEMA flood zone
- X (unshaded)
- Chance of flooding over 30 yrs
- 0.0%
- Est. flood insurance / yr
- $473 – $860
Fire risk 4/10 · Minor
- Est. fire insurance / yr
- $1,289 – $2,393
Heat risk 2/10 · Minimal
- Hot days now (above 97°F)
- 7 days/yr
- Hot days in 30 yrs
- 12 days/yr
Wind risk 2/10 · Minimal
- Chance of severe wind over 30 yrs
- —
Air-quality risk 4/10 · Minor
- Unhealthy air days now
- 5 days/yr
- Unhealthy air days in 30 yrs
- 5 days/yr
Risk factors via First Street. Map © Google.
Why this score? — see what drove the D grade
The composite is a weighted blend of 9 inputs, each scored 0–100. Each bar is that input's sub-score; the figure is the points it added to the 100-point composite (weight × sub-score).
- Cash flow +13.8/30.0
- ARV discount +7.3/15.0
- Rent growth +5.0/5.0
- DSCR +4.2/10.0
- Livability +4.0/5.0
- Schools +3.7/10.0
- 1% rule +2.5/10.0
- Condition / age +2.5/5.0
- Appreciation +0.0/10.0
$269,900
🖨 Deal sheet (PDF) 📄 Offer letter ✓ Due diligence
Listing remarks MLS
* AS PER OWNER LOTS OFBLT IN STORAGE-SUPER CLEAN-EXCLUDE SWINGSET, KENNEL, MATCHINGCURTAINS TO BEDSPREADS-SHINGLED '95-NO CONDO FEES. Fenced Yard. Basement - FULL.
Key facts
- Updated townhouse
- Tiled backsplash
- Walk-in closet
Tags
Property features AI
Finance
- Other: Property listed by BIANCO REALTY, INC.
Exterior
- Parking: Detached garage (1 car); Driveway with concrete surface
- Utilities: Public water; Public sewer; Natural gas available; Cable available; Other utilities available
- Home design: Residential townhouse; Three or more levels
- Construction: Masonite exterior
- Exterior features: Garden; Deck; Full fenced yard; Irregular lot with dimensions approximately 20 x 20 x 163
Interior
- Kitchen: Dishwasher; Range; Refrigerator
- Bedrooms: Total of 10 rooms (bedroom count not specified)
- Bathrooms: 1 full bathroom; 1 half bathroom
- Heating & cooling: Central air conditioning; Forced air heating (natural gas)
- Interior features: Window treatments; Finished full basement
Neighborhood map
What this means for you Summary
Snapshot
- This is a 3-bed/1.5-bath townhouse listed at $270k.
Deal economics
- At list price, monthly cash flow is $22 ($269/yr) — positive.
- The deal already cash-flows at list — no discount required.
- To meet the 1% rule (rent ≥ 1% of price), the offer needs to be $204k (24.6% below list).
- Recommended offer: $204k (24.6% below list) — sets the bar for 1% rule.
- Cap rate 6.4% vs local median 3.1% in Bismarck — top-decile yield for the area; either an underpriced asset or a hidden risk that comps aren't pricing in. Stress-test before assuming the spread holds.
Location & tenants
- Location reads 79/100 on livability (#5 in ND, #2,213 nationally) — a middle-class / working-renter tenant base. Strengths: housing A+, health & safety A+, cost of living A; Watch: crime C-, amenities D+, commute F.
- Bismarck 1 (urban): math 41% / reading 42% proficiency, ranked #25 of 53 in ND (top 47%) — families likely to look elsewhere, expect single-tenant / working-renter base with shorter leases; only 19% free/reduced lunch — higher-income household profile.
- Zoned schools: Northridge Elementary School (math 56% / reading 43%, grade D, #65 of 236 statewide, top 37%, 425 students, 31% FRL); Horizon Middle School (math 42% / reading 50%, grade D+, #13 of 35 statewide, top 35%, 1,044 students, 14% FRL); Century High School (math 43% / reading 63%, grade C-, #14 of 144 statewide, top 9%, 1,427 students, 12% FRL) — zoned schools at 19% FRL track the district average.
- Market conditions: Rents rising fast (+11.8%/yr); 486 active listings in the ZIP; 9 comparable units currently listed for rent nearby; rentals at typical pace (median 23d on market — plan ~3-4 weeks tenant-placement turnaround); solid renter incomes; 259 units permitted in Burleigh County in 2024 (0 in 5+ unit buildings).
Forward outlook
- Local home prices are declining (-3.0%/yr); year-one equity from $2k of loan paydown is wiped out by about $8k of value loss. Plan a longer hold.
- Burleigh County population projected at +61% by 2050 — long-run rental-demand tailwind backs the buy-and-hold thesis.
Negotiation context
- Only 3 days on market — expect competitive offers; lowballing is unlikely to land.
- 2 sale attempts since 31y ago with the ask held roughly flat each time — persistent listings suggest the price (not the market) is what's stuck; bring a comps-based counter.
- Current owner paid $150k; list at $270k implies a 80% gain — meaningful room to come down on a strong offer.
Questions for the listing agent
- Is there a deadline driving the sale (1031 exchange, divorce, estate, relocation)? That informs how much negotiation room exists.
- Schools are B-rated — typically a magnet for longer-tenancy family renters. What's the average tenant stay here, and is there a school-zone premium baked into asking?
- The area grade is low — what's the realistic commute time and amenity access for the typical tenant pool here? Any planned neighborhood developments (good or bad) we should know about?
- What's the average days-on-market for RENTAL listings here right now (not sales)? A rising rental-DOM trend means longer vacancies and softer asking-rent achievability than the comps imply.
- What's the recent tenant-quality profile in this submarket — average credit score on applications, eviction rate, late-payment / NSF rate, and stable-employment percentage? A property-management company in the area should have these aggregated.
- How much new for-sale + rental construction is in the pipeline within 1–3 miles? Heavy new supply typically softens prices + rents 12–24 months out; constrained supply supports both.
Investment metrics
- 1% rule
- 0.75% ✗
- Cap rate
- 6.39%
- Cash-on-cash
- 0.36%
- DSCR
- 1.02
- GRM
- 11.0
CMA / ARV
- ARV (on-the-fly)
- $268,800
- Comps found
- 12
Show comp detail 12 sales within ~0.75 mi
| Address | Dist | Beds/Ba | Sqft | Sold | Price | $/sf | Match |
|---|---|---|---|---|---|---|---|
| 3806 Montreal St N | 0.05mi | 3/2.0 | 1,890 (+12%) | 6mo | $259,000 | $137 | 70 |
| 2976 Ontario Ln | 0.49mi | 3/2.0 | 1,735 (+3%) | 6mo | $245,000 | $141 | 65 |
| 3005 Ontario Ln | 0.52mi | 3/2.0 | 1,724 (+3%) | 6mo | $290,000 | $168 | 64 |
| 221 Colt Ave | 0.40mi | 3/2.0 | 1,830 (+9%) | 0mo | $550,000 | $301 | 64 |
| 432 Brandon Dr E | 0.30mi | 2/2.0 (-1) | 1,773 (+6%) | 8mo | $229,900 | $130 | 64 |
| 4101 Coleman St #2 | 0.55mi | 3/2.0 | 1,593 (-5%) | 1mo | $292,500 | $184 | 63 |
| 3333 Montreal St #201 | 0.37mi | 2/2.0 (-1) | 1,553 (-8%) | 3mo | $249,000 | $160 | 60 |
| 3305 Montreal St #202 | 0.41mi | 2/2.0 (-1) | 1,553 (-8%) | 4mo | $239,900 | $154 | 58 |
| 3333 Montreal St | 0.37mi | 2/2.0 (-1) | 1,553 (-8%) | 7mo | $242,400 | $156 | 57 |
| 2966 Ontario Ln | 0.53mi | 2/2.5 (-1) | 1,788 (+6%) | 4mo | $279,900 | $157 | 53 |
| 4115 Normandy St | 0.41mi | 3/2.5 | 1,906 (+14%) | 6mo | $345,000 | $181 | 49 |
| 3333 Montreal St #305 | 0.37mi | 2/2.0 (-1) | 1,445 (-14%) | 7mo | $244,900 | $169 | 47 |
Match score weights: distance 35% · size 25% · config 20% · recency 20%. Top-matched comps best support the ARV.
Projected returns pro-forma
-3.0% appreciation · 8.0% rent growth · sell at horizon
- IRR
- -11.1%
- Equity multiple
- 0.58×
- Total profit
- $-31,689
- Equity at exit
- $40,243
- IRR
- 3.5%
- Equity multiple
- 1.30×
- Total profit
- $22,647
- Equity at exit
- $23,336
Cash invested: $75,572 (down + closing). Projections, not guarantees.
Landlord ↔ Tenant lean methodology
- Overall (STATE)
- 82 Strongly Landlord-Friendly
- State North Dakota
- 82 Strongly Landlord-Friendly · R+20
- County
- — inherits STATE
- City
- — inherits STATE
ZIP-level market 58503
- Home prices YoY
- -25.6%
- Rents YoY
- 11.8%
- Active inventory
- 486
- Price-to-rent
- 11.0×
Monthly cashflow live
- Estimated rent
- $2,036 high interval (Pro) →
- Mortgage (P&I)
- −$1,415
- Tax from tax record
- −$58 /mo · $699/yr
- Insurance
- −$112
- HOA
- −$0
- Vacancy / Maint / Mgmt
- −$428
- Net cashflow
- $22
Break-even live
Sensitivity live
| Price | -10% $175 | -5% $99 | +0% $22 | +5% $-54 | +10% $-130 |
|---|---|---|---|---|---|
| Rent | -10% $-138 | -5% $-58 | +0% $22 | +5% $103 | +10% $183 |
| Rate | -1.0pp $158 | -0.5pp $91 | base $22 | +0.5pp $-48 | +1.0pp $-119 |
UW: 25.0% down · 7.5% · 30yr · 1.5% tax · 5.0% vac · 8.0% maint · 8.0% mgmt
Financing live
Cash to close
- Down payment
- $67,475
- Closing costs
- $8,097
- Reserves months
- —
- Total cash needed
- —
Loan-product check · same deal, 3 products live
Conventional
25% down · 7.5% · 30yr
- Down + closing
- —
- Monthly P&I
- —
- Monthly cashflow
- —
- DSCR
- —
- Eligible?
- —
Personal DTI + credit; lowest rate.
DSCR
20% down · 8.5% · 30yr
- Down + closing
- —
- Monthly P&I
- —
- Monthly cashflow
- —
- DSCR
- —
- Eligible?
- —
No personal income docs; deal must DSCR.
Hard money
10% down · 12.0% · 12mo
- Down + closing
- —
- Monthly P&I
- —
- Monthly cashflow
- —
- DSCR
- —
- Eligible?
- —
Short-term bridge; refi at stabilization.
Rent comps 9 comps
| Address | Beds | Baths | Sqft | Rent | $/sqft | DOM | Units | Dist |
|---|---|---|---|---|---|---|---|---|
| 4201 Montreal St Bismarck, ND | 1.0–3.0 | 1.0–2.0 | 1092 | $1,886 | $1.73 | 23d | 15 | 0.31mi |
| 4126A Normandy St Bismarck, ND | 2.0 | 1.5 | 1468 | $1,750 | $1.19 | 23d | 1 | 0.39mi |
| 4227 Serenity Ct Bismarck, ND | 3.0 | 2.5 | 1562 | $2,395 | $1.53 | 23d | 1 | 0.45mi |
| 4231 Serenity Ct Bismarck, ND | 3.0 | 2.5 | 1562 | $2,395 | $1.53 | 23d | 1 | 0.45mi |
| 4442 Serenity Ct Bismarck, ND | 3.0 | 2.5 | 1544 | $2,395 | $1.55 | 23d | 1 | 0.49mi |
| 1600 Mapleton Ave Unit 104 Bismarck, ND | 3.0 | 2.0 | 1456 | $1,600 | $1.10 | 23d | 1 | 1.20mi |
| 2113 Grimsrud Dr Bismarck, ND | 1.0–3.0 | 1.0–2.0 | 948 | $1,595 | $1.68 | 23d | 10 | 1.35mi |
| 2141 Xavier St Unit 312 Bismarck, ND | 2.0 | 2.0 | 1065 | $1,215 | $1.14 | 23d | 1 | 1.40mi |
| 4309 N 19th St Bismarck, ND | 2.0 | 2.0 | 1100 | $1,955 | $1.78 | 23d | 1 | 1.45mi |
Listing history 6 events
-
2026-05-24status Pending
-
2026-05-20$269,900 Active
-
2016-05-04soldstatus $150,000
-
2015-10-27soldstatus
-
1995-10-13soldstatus 163-char remark
Show marketing remark (163 chars)
* AS PER OWNER LOTS OFBLT IN STORAGE-SUPER CLEAN-EXCLUDE SWINGSET, KENNEL, MATCHINGCURTAINS TO BEDSPREADS-SHINGLED '95-NO CONDO FEES. Fenced Yard. Basement - FULL.
-
1995-07-12$59,900 163-char remark
Show marketing remark (163 chars)
* AS PER OWNER LOTS OFBLT IN STORAGE-SUPER CLEAN-EXCLUDE SWINGSET, KENNEL, MATCHINGCURTAINS TO BEDSPREADS-SHINGLED '95-NO CONDO FEES. Fenced Yard. Basement - FULL.
ⓘ Source: listings_history table (triggers on properties + properties_extension) + one-shot
backfill from property_details.listing_events for pre-trigger history.
Tax reassessment forecast ND · Resets to sale price
- Current annual tax
- $699 · $58/mo
- Projected year-2 tax
- $2,645 · $220/mo
- Expected delta
- +$1,946/yr (+$162/mo · 278.2%)
ⓘ Screening estimate from a state-policy table — verify with the county assessor before closing.
Climate risk First Street
- Flood 1/10 Low FEMA zone X (unshaded) · 0% chance over 30 yrs
- Wildfire 4/10 Moderate
- Heat 2/10 Low 7 d/yr ≥97°F today · 12 d/yr by 30 yrs out
- Wind 2/10 Low
- Air quality 4/10 Moderate 5 unhealthy d/yr today · 5 by 30 yrs out
Nearby sold comps map
Loading sold comps map…
Walkable amenities ~0.75 mi
Loading nearby amenities…
Taxation est. · year 1
- Rental income
- $24,433
- − Mortgage interest
- −$15,119
- − Property taxes
- −$699
- − Insurance
- −$1,350
- − Repairs & maintenance
- −$1,955
- − Management
- −$1,955
- − Depreciation
- −$7,852
- Taxable loss
- −$4,495
- Est. tax savings @ 24.0%
- +$1,079
- After-tax cash flow
- $1,348/yr
For passive investors: Depreciation is non-cash, so a rental often shows a tax loss while cash-flowing — sheltering income. Rental losses are passive: they offset passive income freely, and up to $25,000/yr can offset ordinary (W-2) income if you actively participate and your MAGI is under $100k (phasing out to $0 by $150k); unused losses carry forward. On sale, claimed depreciation is recaptured at up to 25%, and gains may owe capital-gains tax (a 1031 exchange can defer both). Figures are a year-1 estimate at your 24.0% rate — not tax advice; consult a CPA.
Schools (NCES district)
- District
- Bismarck 1
- NCES district ID
- 3800014
- Math proficiency
- 41% ▼ -5.00%
- Reading proficiency
- 42% ▼ -6.00%
- Median HH income
- $60,649
- Composite
- 36.76/100
- National rank
- #4577
- State rank
- #25 of 53 in ND
Livability — Bismarck
- Score
- 79/100
- State rank
- #5
- US rank
- #2213
Category grades
Schools grade is shown separately in the Schools card above.
Census & demographics
- Census place
- Bismarck, ND
- County
- Burleigh County · 97,300 people
- City population
- 97,300
- Metro
- Bismarck, ND
- Population (ZIP)
- 37,683
- Household income
- $102,333
- Rent vs Own
- Severe rent burden
- 814.0
Population outlook (Burleigh County) Hauer SSP2
- Today (2025)
- 119,359 people
- By 2030
- 133,047 · +11.5%
- By 2040
- 161,545 · +35.3%
- By 2050
- 191,960 · +60.8%
- By 2075
- 274,569 · +130.0%
- By 2100
- 350,910 · +194.0%
Race, ethnicity, and origin ACS 2023
- Neighborhood character
- Predominantly White (89%)
- Race & ethnicity
- White 89% Two or more races 6% Hispanic / Latino 2% Asian 2% Black 1%
- Common ancestry
- Portuguese 17% Scotch-Irish 4% Scottish 2%
- Foreign-born
- 3% · Canada
- Languages at home
- 95% English-only · German/W. Germanic 2% Spanish 1% Tagalog/Filipino 1%
Political lean MEDSL · Burleigh
- 2024 margin
- Solid R (+43.2) · D 27.5% · R 70.7% · Other 1.8%
- 2008→2024 swing
- -19.7pp toward R · 2008: -23.6pp · 2024: -43.2pp
- All cycles
- 2024: R+43.2 2020: R+40.2 2016: R+46.1 2012: R+32.1 2008: R+23.6
Not yet ingested
- Civics
- —
Market trends
- HPI YoY
- ▼ -76.96%
- Current HPI
- 223.9683
- Rent YoY
- ▲ 11.79%
- Metro
- Bismarck, ND
- State GDP YoY
- ▲ 2.09%
- F500 in state
- 2
Industry mix (Fortune 500 HQ in ND)
| Industry | F500 HQs | Revenue |
|---|---|---|
| Utilities / Construction | 1 | $6B |
|
||
Price history
+350.6% since first listed6 events — show timeline
- 2026-05-24 Pending — GNMLS
- 2026-05-20 Listed $269,900 GNMLS
- 2016-05-04 Sold (Public Records) $150,000 Public Records
- 2015-10-27 Sold (Public Records) — Public Records
- 1995-10-13 Sold (MLS) — GNMLS
- 1995-07-12 Listed $59,900 GNMLS
Property tax history
-5.1%/yrLatest (2025): $699 · -65.2% YoY. Source: county tax records.
Cash-flow waterfall
monthlySold comps — $/sqft
last 12 mo · ≤1 miLoading sold comps…