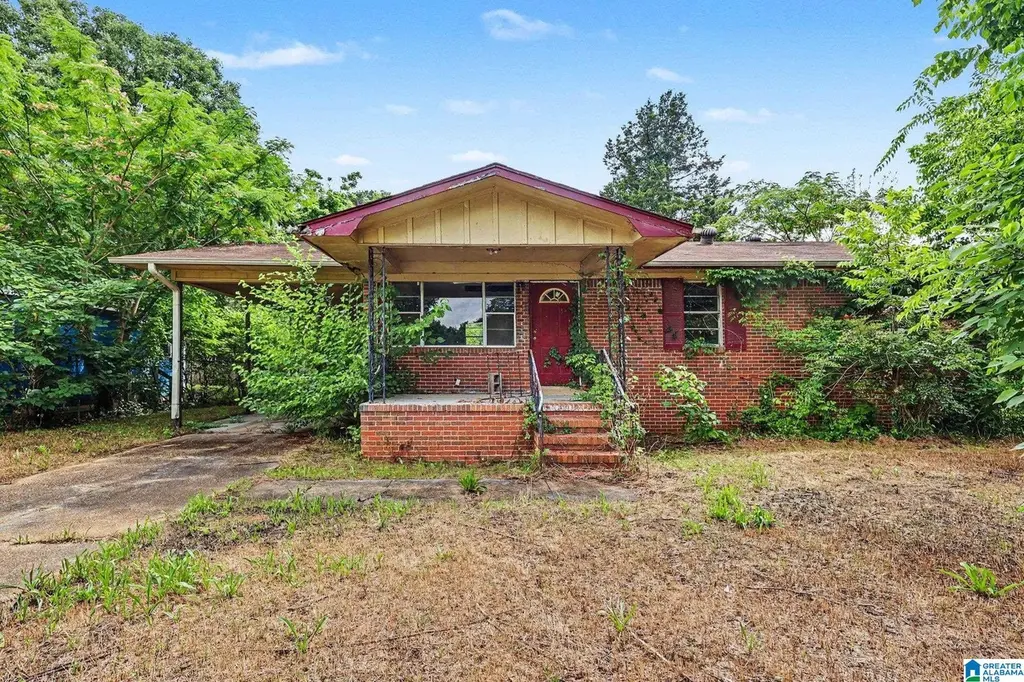
2204 Short 14th St N · Bessemer, AL
Flood risk 8/10 · Major
- FEMA flood zone
- AE
- Chance of flooding over 30 yrs
- 0.99%
- Est. flood insurance / yr
- $1,737 – $8,500
Fire risk 1/10 · Minimal
- Est. fire insurance / yr
- $916 – $1,700
Heat risk 6/10 · Moderate
- Hot days now (above 109°F)
- 7 days/yr
- Hot days in 30 yrs
- 19 days/yr
Wind risk 6/10 · Moderate
- Chance of severe wind over 30 yrs
- 44.0%
Air-quality risk 3/10 · Minor
- Unhealthy air days now
- 2 days/yr
- Unhealthy air days in 30 yrs
- 5 days/yr
Risk factors via First Street. Map © Google.
Why this score? — see what drove the B grade
The composite is a weighted blend of 9 inputs, each scored 0–100. Each bar is that input's sub-score; the figure is the points it added to the 100-point composite (weight × sub-score).
- Cash flow +30.0/30.0
- ARV discount +15.0/15.0
- 1% rule +10.0/10.0
- DSCR +10.0/10.0
- Livability +3.0/5.0
- Condition / age +2.5/5.0
- Rent growth +1.7/5.0
- Schools +0.8/10.0
- Appreciation +0.0/10.0
$55,000
🖨 Deal sheet (PDF) 📄 Offer letter ✓ Due diligence
Listing remarks
Investor & handyman special! This home features driveway to carport. Large front porch leads into the living area. Galley kitchen features wood cabiniets. Dining room or den for additional living area. There are 3 bedrooms, & 1 full bathroom with a tub shower combo. Flat yard.
Key facts
- Large front porch
- Galley kitchen
- Dining room
Tags
Property features AI
Exterior
- Parking: Driveway and off-street parking; One carport space
- Utilities: Public water; Connected sewer; Internet service available
- Home design: Existing construction; 4-sided brick and other siding exterior
- Construction: Crawl space foundation
- Exterior features: Front porch; Interior lot with some trees; Located in a flood plain
Interior
- Kitchen: Laminate countertops
- Bedrooms: Three bedrooms, all on main level
- Flooring: Carpet; Hardwood; Vinyl
- Bathrooms: One full bathroom with tub/shower combo and shared bath layout
- Heating & cooling: No heat; No air conditioning
- Interior features: Ceilings noted as 'Other' (see remarks); Some window treatments to remain; No additional interior features listed
- Laundry & utility: No specific laundry or utility equipment listed
Neighborhood map
What this means for you Summary
Snapshot
- This is a 3-bed/1.0-bath single-family listed at $55k.
Deal economics
- At list price, monthly cash flow is $170 ($2k/yr) — positive.
- The deal already cash-flows at list — no discount required.
- Meets the 1% rule at list price ($1k rent vs $55k).
- Cap rate 19.3% vs local median 5.9% in Bessemer — top-decile yield for the area; either an underpriced asset or a hidden risk that comps aren't pricing in. Stress-test before assuming the spread holds.
Location & tenants
- Location reads 59/100 on livability (#331 in AL) — a working-class tenant base; expect higher turnover. Strengths: commute A+, cost of living A+, housing A; Watch: crime F, amenities F, employment F.
- Bessemer City (suburban): math 3% / reading 19% proficiency, ranked #120 of 129 in AL (top 93%) — low school quality limits family demand, transient renter base, plan for 1-2y turnover; 87% free/reduced lunch — lower-income household profile, screen leases tightly.
- Zoned schools: Abrams Elementary School (math 2% / reading 17%, grade F, #568 of 627 statewide, top 94%, 254 students, 78% FRL); Bessemer City High School (math 2% / reading 8%, grade F, #276 of 305 statewide, top 95%, 850 students, 61% FRL) — zoned schools average 69% FRL vs 87% district-wide (18 pts lower); this property's tenant base skews higher-income than the district average.
- Market conditions: Rents falling (-3.1%/yr); 115 active listings in the ZIP; 17 comparable units currently listed for rent nearby; rentals at typical pace (median 17d on market — plan ~3-4 weeks tenant-placement turnaround); lower-income renter base — watch delinquency; 2,114 units permitted in Jefferson County in 2024 (556 in 5+ unit buildings).
- This rent runs 43% of the median local income ($35k/yr) — at the standard rent-burdened threshold; future hikes will face affordability resistance.
Forward outlook
- Local home prices are declining (-3.0%/yr); year-one equity from $380 of loan paydown is wiped out by about $2k of value loss. Plan a longer hold.
- Jefferson County population projected to shrink 4% by 2050 — rents likely to lag national; underwrite the cash flow, not the appreciation.
Negotiation context
- Only 6 days on market — expect competitive offers; lowballing is unlikely to land.
Risks & watch-outs
- Watch-outs: flood insurance adds $427/mo.
- Climate carrying-cost: in FEMA flood zone AE (mandatory federal flood insurance); major wind risk, 44% chance of damaging wind over 30y; extreme-heat days projected 7→19/yr by 2055 (HVAC capex compounding) — expect insurance premiums to compound above CPI over the hold.
Questions for the listing agent
- Built in 1969 — when were the roof, HVAC, electrical panel, plumbing, and water heater last replaced?
- What's the actual annual flood-insurance premium (NFIP or private), and is the property in a SFHA with mandatory coverage?
- Is there a deadline driving the sale (1031 exchange, divorce, estate, relocation)? That informs how much negotiation room exists.
- Schools are D-rated, which usually means shorter tenancies and higher turnover. Who's the typical renter profile here, and what's been the actual vacancy rate?
- Crime grade is F in this area — have there been break-ins, vandalism, or insurance claims at this property in the last 3 years? What carrier currently insures it and at what premium?
- What's the average days-on-market for RENTAL listings here right now (not sales)? A rising rental-DOM trend means longer vacancies and softer asking-rent achievability than the comps imply.
- What's the recent tenant-quality profile in this submarket — average credit score on applications, eviction rate, late-payment / NSF rate, and stable-employment percentage? A property-management company in the area should have these aggregated.
- How much new for-sale + rental construction is in the pipeline within 1–3 miles? Heavy new supply typically softens prices + rents 12–24 months out; constrained supply supports both.
Investment metrics
- 1% rule
- 2.29% ✓
- Cap rate
- 19.30%
- Cash-on-cash
- 46.45%
- DSCR
- 3.07
- GRM
- 3.6
CMA / ARV
- ARV (on-the-fly)
- $108,000
- Comps found
- 12
Show comp detail 12 sales within ~0.75 mi
| Address | Dist | Beds/Ba | Sqft | Sold | Price | $/sf | Match |
|---|---|---|---|---|---|---|---|
| 2221 Short 14th St N | 0.05mi | 3/1.0 | 1,075 (-0%) | 11mo | $40,000 | $37 | 87 |
| 1321 25th Ave N | 0.39mi | 3/1.0 | 1,080 (0%) | 4mo | $108,000 | $100 | 79 |
| 1308 22nd Ave | 0.20mi | 3/1.0 | 1,000 (-7%) | 10mo | $79,000 | $79 | 70 |
| 2008 Short 14th St N | 0.17mi | 3/1.0 | 1,225 (+13%) | 2mo | $100,000 | $82 | 68 |
| 1926 Long 12th St N | 0.38mi | 3/1.0 | 1,144 (+6%) | 7mo | $145,000 | $127 | 66 |
| 1822 Short 18th St N | 0.53mi | 3/2.0 | 1,100 (+2%) | 4mo | $146,000 | $133 | 65 |
| 103 Greenridge Rd | 0.47mi | 3/1.0 | 1,008 (-7%) | 6mo | $118,000 | $117 | 62 |
| 1712 Long 14th St N | 0.44mi | 3/1.0 | 959 (-11%) | 2mo | $47,000 | $49 | 59 |
| 2313 N 20th St | 0.61mi | 2/1.0 (-1) | 1,064 (-2%) | 13mo | $45,000 | $42 | 53 |
| 1103 26th Ave N | 0.58mi | 3/1.5 | 1,232 (+14%) | 1mo | $175,900 | $143 | 47 |
| 1500 Long 14th St | 0.64mi | 2/1.0 (-1) | 960 (-11%) | 2mo | $80,000 | $83 | 45 |
| 1523 15th Ave N | 0.70mi | 3/2.0 | 1,154 (+7%) | 12mo | $142,500 | $123 | 42 |
Match score weights: distance 35% · size 25% · config 20% · recency 20%. Top-matched comps best support the ARV.
Projected returns pro-forma
-3.0% appreciation · 0.0% rent growth · sell at horizon
- IRR
- -2.8%
- Equity multiple
- 0.90×
- Total profit
- $-1,508
- Equity at exit
- $8,201
- IRR
- -0.6%
- Equity multiple
- 0.97×
- Total profit
- $-478
- Equity at exit
- $4,755
Cash invested: $15,400 (down + closing). Projections, not guarantees.
Landlord ↔ Tenant lean methodology
- Overall (STATE)
- 90 Strongly Landlord-Friendly
- State Alabama
- 90 Strongly Landlord-Friendly · R+15
- County
- — inherits STATE
- City
- — inherits STATE
ZIP-level market 35020
- Home prices YoY
- -24.2%
- Rents YoY
- -3.1%
- Active inventory
- 115
- Price-to-rent
- 3.6×
Monthly cashflow live
- Estimated rent
- $1,259 high interval (Pro) →
- Mortgage (P&I)
- −$288
- Tax from tax record
- −$87 /mo · $1,048/yr
- Insurance
- −$23
- Flood insurance flood zone
- −$427 /mo · $5,118/yr
- HOA
- −$0
- Vacancy / Maint / Mgmt
- −$264
- Net cashflow
- $170
Break-even live
Sensitivity live
| Price | -10% $201 | -5% $185 | +0% $170 | +5% $154 | +10% $138 |
|---|---|---|---|---|---|
| Rent | -10% $70 | -5% $120 | +0% $170 | +5% $219 | +10% $269 |
| Rate | -1.0pp $197 | -0.5pp $184 | base $170 | +0.5pp $155 | +1.0pp $141 |
UW: 25.0% down · 7.5% · 30yr · 1.5% tax · 5.0% vac · 8.0% maint · 8.0% mgmt
Financing live
Cash to close
- Down payment
- $13,750
- Closing costs
- $1,650
- Reserves months
- —
- Total cash needed
- —
Loan-product check · same deal, 3 products live
Conventional
25% down · 7.5% · 30yr
- Down + closing
- —
- Monthly P&I
- —
- Monthly cashflow
- —
- DSCR
- —
- Eligible?
- —
Personal DTI + credit; lowest rate.
DSCR
20% down · 8.5% · 30yr
- Down + closing
- —
- Monthly P&I
- —
- Monthly cashflow
- —
- DSCR
- —
- Eligible?
- —
No personal income docs; deal must DSCR.
Hard money
10% down · 12.0% · 12mo
- Down + closing
- —
- Monthly P&I
- —
- Monthly cashflow
- —
- DSCR
- —
- Eligible?
- —
Short-term bridge; refi at stabilization.
Rent comps 17 comps
| Address | Beds | Baths | Sqft | Rent | $/sqft | DOM | Units | Dist |
|---|---|---|---|---|---|---|---|---|
| 1314 22nd Ave N Bessemer, AL | 3.0 | 1.0 | 1038 | $1,000 | $0.96 | 44d | 1 | 0.13mi |
| 2129 13th St N Bessemer, AL | 4.0 | 1.0 | 1378 | $1,445 | $1.05 | 15d | 1 | 0.20mi |
| 2028 13th St N Bessemer, AL | 3.0 | 2.0 | 1372 | $1,073 | $0.78 | 24d | 1 | 0.24mi |
| 1929 15th St N Bessemer, AL | 3.0 | 2.0 | 1140 | $1,250 | $1.10 | 20d | 1 | 0.27mi |
| 428 Willow Ln Bessemer, AL | 4.0 | 2.0 | 1375 | $1,620 | $1.18 | 15d | 1 | 0.41mi |
| 2234 19th St N Bessemer, AL | 2.0 | 1.0 | 1106 | $975 | $0.88 | 44d | 1 | 0.52mi |
| 1623 26th Ave N Bessemer, AL | 2.0 | 1.0 | 1004 | $1,095 | $1.09 | 11d | 1 | 0.57mi |
| 1013 25th Ave N Bessemer, AL | 3.0 | 2.0 | 1144 | $1,546 | $1.35 | 16d | 1 | 0.60mi |
| 1036 Rose Hill Cir Bessemer, AL | 3.0 | 2.0 | 1277 | $1,300 | $1.02 | 21d | 1 | 0.67mi |
| 3447 Jeanne Ln Bessemer, AL | 3.0 | 2.0 | 1460 | $1,850 | $1.27 | 2d | 1 | 0.70mi |
| 905 26th Ave N Bessemer, AL | 4.0 | 2.0 | 1218 | $1,200 | $0.99 | 2d | 1 | 0.84mi |
| 1015 11th St N Bessemer, AL | 2.0 | 1.0 | 876 | $975 | $1.11 | 12d | 1 | 1.07mi |
| 2423 Circle Dr Bessemer, AL | 2.0 | 1.0 | 732 | $1,050 | $1.43 | 44d | 1 | 1.12mi |
| 2109 29th Ave N Bessemer, AL | 4.0 | 2.0 | 1217 | $1,323 | $1.09 | 3d | 1 | 1.20mi |
| 817 15th St N Bessemer, AL | 3.0 | 2.0 | 1116 | $1,125 | $1.01 | 3d | 1 | 1.24mi |
| 719 16th St N Bessemer, AL | 3.0 | 1.5 | 1085 | $1,075 | $0.99 | 24d | 1 | 1.34mi |
| 116 Avalon Ave Bessemer, AL | 4.0 | 1.0 | 1207 | $1,200 | $0.99 | 44d | 1 | 1.49mi |
Listing history 5 events
-
2026-06-05statusdays on market $55,000 Pending 6 DOM
-
2026-06-03days on market $55,000 Active 5 DOM
-
2026-06-02days on market $55,000 Active 4 DOM
-
2026-06-01days on market $55,000 Active 3 DOM
-
2026-05-31days on market $55,000 Active 2 DOM
ⓘ Source: listings_history table (triggers on properties + properties_extension) + one-shot
backfill from property_details.listing_events for pre-trigger history.
Tax reassessment forecast AL · Resets to sale price
- Current annual tax
- $1,048 · $87/mo
- Projected year-2 tax
- $1,048 · $87/mo
- Expected delta
- $0/yr ($0/mo · 0.0%)
ⓘ Screening estimate from a state-policy table — verify with the county assessor before closing.
Climate risk First Street
- Flood 8/10 Severe FEMA zone AE · 99% chance over 30 yrs
- Wildfire 1/10 Low
- Heat 6/10 Major 7 d/yr ≥109°F today · 19 d/yr by 30 yrs out
- Wind 6/10 Major 44% chance of damaging wind over 30 yrs
- Air quality 3/10 Moderate 2 unhealthy d/yr today · 5 by 30 yrs out
Nearby sold comps map
Loading sold comps map…
Walkable amenities ~0.75 mi
Loading nearby amenities…
Taxation est. · year 1
- Rental income
- $15,112
- − Mortgage interest
- −$3,081
- − Property taxes
- −$1,048
- − Insurance
- −$5,394
- − Repairs & maintenance
- −$1,209
- − Management
- −$1,209
- − Depreciation
- −$1,600
- Taxable income
- $1,571
- Est. tax owed @ 24.0%
- −$377
- After-tax cash flow
- $1,658/yr
For passive investors: Depreciation is non-cash, so a rental often shows a tax loss while cash-flowing — sheltering income. Rental losses are passive: they offset passive income freely, and up to $25,000/yr can offset ordinary (W-2) income if you actively participate and your MAGI is under $100k (phasing out to $0 by $150k); unused losses carry forward. On sale, claimed depreciation is recaptured at up to 25%, and gains may owe capital-gains tax (a 1031 exchange can defer both). Figures are a year-1 estimate at your 24.0% rate — not tax advice; consult a CPA.
Schools (NCES district)
- District
- Bessemer City
- NCES district ID
- 0100330
- Math proficiency
- 3% ▼ -18.00%
- Reading proficiency
- 19% ▼ -3.00%
- Median HH income
- $29,721
- Composite
- 8.45/100
- National rank
- #9905
- State rank
- #120 of 129 in AL
Livability — Bessemer
- Score
- 59/100
- State rank
- #331
- US rank
- #20078
Category grades
Schools grade is shown separately in the Schools card above.
Census & demographics
- Census place
- Bessemer, AL
- County
- Jefferson County · 527,445 people
- City population
- 48,018
- Metro
- Birmingham-Hoover, AL
- Population (ZIP)
- 24,892
- Household income
- $35,362
- Rent vs Own
- Severe rent burden
- 1001.0
Population outlook (Jefferson County) Hauer SSP2
- Today (2025)
- 669,185 people
- By 2030
- 669,694 · +0.1%
- By 2040
- 661,388 · -1.2%
- By 2050
- 643,086 · -3.9%
- By 2075
- 577,267 · -13.7%
- By 2100
- 474,758 · -29.1%
Race, ethnicity, and origin ACS 2023
- Neighborhood character
- Predominantly Black (74%)
- Race & ethnicity
- Black 74% Hispanic / Latino 13% White 11% Two or more races 6%
- Hispanic origin (detail)
- Mexican 10%
- Foreign-born
- 5% · Canada
- Languages at home
- 89% English-only · Spanish 11%
Political lean MEDSL · Jefferson
- 2024 margin
- D (+10.4) · D 54.6% · R 44.2% · Other 1.2%
- 2008→2024 swing
- +5.4pp toward D · 2008: 5.1pp · 2024: 10.4pp
- All cycles
- 2024: D+10.4 2020: D+13.2 2016: D+7.2 2012: D+6.0 2008: D+5.1
Not yet ingested
- Civics
- —
Market trends
- HPI YoY
- ▼ -57.54%
- Current HPI
- 179.7702
- Rent YoY
- ▼ -3.12%
- Metro
- Birmingham-Hoover, AL
- State GDP YoY
- ▲ 2.94%
- F500 in state
- 4
Industry mix (Fortune 500 HQ in AL)
| Industry | F500 HQs | Revenue |
|---|---|---|
| Financial Services | 1 | $8B |
|
||
| Healthcare | 1 | $5B |
|
||
Price history
1 event — show timeline
- 2026-05-29 Listed $55,000 Greater Alabama MLS
Property tax history
+0.4%/yrLatest (2025): $1,048 · +0.0% YoY. Source: county tax records.
Cash-flow waterfall
monthlySold comps — $/sqft
last 12 mo · ≤1 miLoading sold comps…