 🏗️ New Construction
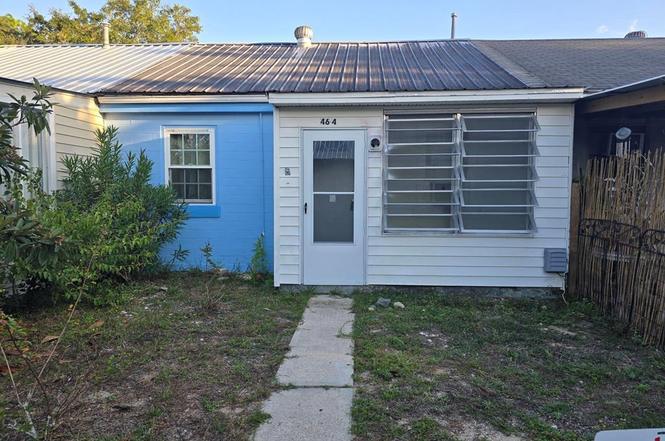
46 Carlton Ave #4 · Carrabelle, FL
Flood risk 1/10 · Minimal
- FEMA flood zone
- X (unshaded)
- Chance of flooding over 30 yrs
- 0.0%
- Est. flood insurance / yr
- $507 – $1,088
Fire risk 4/10 · Minor
- Est. fire insurance / yr
- $947 – $1,759
Heat risk 10/10 · Severe
- Hot days now (above 108°F)
- 7 days/yr
- Hot days in 30 yrs
- 22 days/yr
Wind risk 10/10 · Severe
- Chance of severe wind over 30 yrs
- 99.0%
Air-quality risk 2/10 · Minimal
- Unhealthy air days now
- 1 days/yr
- Unhealthy air days in 30 yrs
- 1 days/yr
Risk factors via First Street. Map © Google.
Why this score? — see what drove the D grade
The composite is a weighted blend of 9 inputs, each scored 0–100. Each bar is that input's sub-score; the figure is the points it added to the 100-point composite (weight × sub-score).
- Cash flow +10.5/30.0
- ARV discount +7.5/15.0
- Appreciation +5.6/10.0
- Livability +3.5/5.0
- 1% rule +3.1/10.0
- DSCR +3.0/10.0
- Schools +3.0/10.0
- Rent growth +2.5/5.0
- Condition / age +2.5/5.0
$92,000
🖨 Deal sheet 📄 Offer letter ✓ Due diligence
Listing remarks
Discover your charming coastal retreat! This cozy 2-bedroom, 1-bathroom cottage in Lanark Village is perfectly located near the Lanark Golf Course and is only about a half-mile from the water and the convenient Lanark boat ramp. It's the ideal spot for a perfect weekend getaway or a peaceful permanent home on the beautiful Forgotten Coast.
Key facts
- Coastal retreat
- Half-mile from water
- Lanark boat ramp
Tags
Property features AI
Exterior
- Parking: 2 parking spaces; On-street parking
- Utilities: Public water; Public sewer; Electricity available; Cable available; Phone service available; Water available; Sewer available
- Home design: Attached single-family townhouse; Residential property; New construction
- Construction: Block construction; Slab foundation
- Exterior features: Metal roof; Interior lot; Sidewalks (community)
Interior
- Kitchen: Refrigerator
- Flooring: Vinyl
- Bathrooms: 1 full bathroom
- Heating & cooling: Wall furnace heating; Wall/window air conditioning units
- Interior features: Refrigerator included; Vinyl flooring
Neighborhood map
What this means for you Summary
Snapshot
- This is a 2-bed/1.0-bath townhouse listed at $92k.
Deal economics
- At list price, monthly cash flow is $-58 ($-698/yr) — negative.
- The deal already cash-flows at list — no discount required.
- Meets the 1% rule at list price ($920 rent vs $92k).
- Recommended offer: $84k (9.0% below list) — sets the bar for market timing.
- Cap rate 5.7% vs local median 1.9% in Carrabelle — top-decile yield for the area; either an underpriced asset or a hidden risk that comps aren't pricing in. Stress-test before assuming the spread holds.
Location & tenants
- Location reads 69/100 on livability (#466 in FL) — a middle-class / working-renter tenant base. Strengths: cost of living A+, housing A+, health & safety A+; Watch: employment D, schools F, amenities F.
- Franklin (rural): math 33% / reading 38% proficiency, ranked #67 of 73 in FL (top 92%) — families likely to look elsewhere, expect single-tenant / working-renter base with shorter leases; 84% free/reduced lunch — lower-income household profile, screen leases tightly.
- Market conditions: 73 active listings in the ZIP; 113 units permitted in Franklin County in 2024 (0 in 5+ unit buildings).
Forward outlook
- In year one you build about $2k of equity ($786 loan paydown + $1k appreciation (1.2% local appreciation)).
- Franklin County population projected to shrink 5% by 2050 — rents likely to lag national; underwrite the cash flow, not the appreciation.
Negotiation context
- It's been on market 105 days — a 9% lower offer ($84k) is reasonable based on typical stale-listing flexibility.
- 2 sale attempts with the ask held roughly flat each time — persistent listings suggest the price (not the market) is what's stuck; bring a comps-based counter.
Risks & watch-outs
- Watch-outs: built in 1943 — expect roof / HVAC / electrical / plumbing capex.
- Climate carrying-cost: severe wind risk, 99% chance of damaging wind over 30y; extreme-heat days projected 7→22/yr by 2055 (HVAC capex compounding) — expect insurance premiums to compound above CPI over the hold.
Questions for the listing agent
- What do current leases actually rent for vs. the listed asking? Can we see a recent rent roll and the last 12 months of T-12 income?
- It's been on market 105 days. Have you received any prior offers? Is the seller open to a 9% concession, seller financing, or rate buy-down credit?
- Built in 1943 — when were the roof, HVAC, electrical panel, plumbing, and water heater last replaced?
- Why hasn't it sold? Are there any deal-killer items the seller is aware of (foundation, flood, title, zoning, code violations)?
- Is there a deadline driving the sale (1031 exchange, divorce, estate, relocation)? That informs how much negotiation room exists.
- Schools are F-rated, which usually means shorter tenancies and higher turnover. Who's the typical renter profile here, and what's been the actual vacancy rate?
- The area grade is low — what's the realistic commute time and amenity access for the typical tenant pool here? Any planned neighborhood developments (good or bad) we should know about?
- What's the average days-on-market for RENTAL listings here right now (not sales)? A rising rental-DOM trend means longer vacancies and softer asking-rent achievability than the comps imply.
- What's the recent tenant-quality profile in this submarket — average credit score on applications, eviction rate, late-payment / NSF rate, and stable-employment percentage? A property-management company in the area should have these aggregated.
- How much new for-sale + rental construction is in the pipeline within 1–3 miles? Heavy new supply typically softens prices + rents 12–24 months out; constrained supply supports both.
Investment metrics
- 1% rule
- 0.81% ✗
- Cap rate
- 5.68%
- Cash-on-cash
- -2.19%
- DSCR
- 0.90
- GRM
- 10.3
CMA / ARV
- ARV (on-the-fly)
- $113,590
- Comps found
- 11
Show comp detail 11 sales within ~0.75 mi
| Address | Dist | Beds/Ba | Sqft | Sold | Price | $/sf | Match |
|---|---|---|---|---|---|---|---|
| 52-6 Parker Ave | 0.18mi | 2/1.0 | 630 (+3%) | 2mo | $165,000 | $262 | 86 |
| 50-1 E Pine St | 0.05mi | 2/1.0 | 578 (-6%) | 4mo | $148,000 | $256 | 84 |
| 30-3 Parker Ave | 0.18mi | 1/1.0 (-1) | 610 (-1%) | 7mo | $100,000 | $164 | 80 |
| 30 Parker Ave #3 | 0.19mi | 1/1.0 (-1) | 610 (-1%) | 7mo | $100,000 | $164 | 79 |
| 30-5 Heffernan Dr | 0.20mi | 2/1.0 | 550 (-10%) | 1mo | $90,000 | $164 | 73 |
| 49-3 E Pine St | 0.07mi | 1/1.0 (-1) | 662 (+8%) | 8mo | $134,500 | $203 | 72 |
| 54-5 Parker Ave | 0.22mi | 2/1.0 | 565 (-8%) | 7mo | $104,500 | $185 | 70 |
| 10 Pine St #7 | 0.20mi | 1/1.0 (-1) | 654 (+6%) | 13mo | $55,000 | $84 | 64 |
| 20-3 Collins St | 0.30mi | 2/1.0 | 658 (+7%) | 14mo | $128,000 | $195 | 62 |
| 22-6 W Pine St #6 | 0.28mi | 1/1.0 (-1) | 620 (+1%) | 22mo | $114,000 | $184 | 62 |
| 12-3 Parker Ave | 0.21mi | 2/1.0 | 525 (-14%) | 13mo | $130,000 | $248 | 55 |
Match score weights: distance 35% · size 25% · config 20% · recency 20%. Top-matched comps best support the ARV.
Projected returns pro-forma
1.24% appreciation · 3.0% rent growth · sell at horizon
- IRR
- -0.2%
- Equity multiple
- 0.99×
- Total profit
- $-252
- Equity at exit
- $40,175
- IRR
- 4.5%
- Equity multiple
- 1.57×
- Total profit
- $18,032
- Equity at exit
- $54,486
Cash invested: $31,805 (down + closing). Projections, not guarantees.
Landlord ↔ Tenant lean methodology
- Overall (STATE)
- 87 Strongly Landlord-Friendly
- State Florida
- 87 Strongly Landlord-Friendly · R+3
- County
- — inherits STATE
- City
- — inherits STATE
ZIP-level market 32323
- Home prices YoY
- 0.9%
- Active inventory
- 73
- Price-to-rent
- 8.3×
Monthly cashflow live
- Estimated rent
- $920 medium interval (Pro) →
- Mortgage (P&I)
- −$596
- Tax est. 1.5%
- −$142 /mo · $1,704/yr
- Insurance
- −$47
- HOA
- −$0
- Vacancy / Maint / Mgmt
- −$193
- Net cashflow
- $-58
Break-even live
UW: 25.0% down · 7.5% · 30yr · 1.5% tax · 5.0% vac · 8.0% maint · 8.0% mgmt
Financing live
Cash to close
- Down payment
- $28,398
- Closing costs
- $3,408
- Reserves months
- —
- Total cash needed
- —
Loan-product check · same deal, 3 products live
Conventional
25% down · 7.5% · 30yr
- Down + closing
- —
- Monthly P&I
- —
- Monthly cashflow
- —
- DSCR
- —
- Eligible?
- —
Personal DTI + credit; lowest rate.
DSCR
20% down · 8.5% · 30yr
- Down + closing
- —
- Monthly P&I
- —
- Monthly cashflow
- —
- DSCR
- —
- Eligible?
- —
No personal income docs; deal must DSCR.
Hard money
10% down · 12.0% · 12mo
- Down + closing
- —
- Monthly P&I
- —
- Monthly cashflow
- —
- DSCR
- —
- Eligible?
- —
Short-term bridge; refi at stabilization.
Listing history 20 events
-
2026-06-19days on market $92,000 Active 105 DOM
-
2026-06-18days on market $92,000 Active 104 DOM
-
2026-06-17days on market $92,000 Active 103 DOM
-
2026-06-16days on market $92,000 Active 102 DOM
-
2026-06-15days on market $92,000 Active 101 DOM
-
2026-06-14days on market $92,000 Active 99 DOM
-
2026-06-13days on market $92,000 Active 98 DOM
-
2026-06-10days on market $92,000 Active 96 DOM
-
2026-06-09days on market $92,000 Active 95 DOM
-
2026-06-08days on market $92,000 Active 94 DOM
-
2026-06-07days on market $92,000 Active 93 DOM
-
2026-06-05days on market $92,000 Active 90 DOM
-
2026-06-03days on market $92,000 Active 89 DOM
-
2026-06-02days on market $92,000 Active 88 DOM
-
2026-06-01days on market $92,000 Active 87 DOM
-
2026-05-31days on market $92,000 Active 86 DOM
-
2026-05-30days on market $92,000 Active 85 DOM
-
2026-05-05status Active
-
2026-03-30historical Active Under Contract
-
2026-03-06$92,000 Active
ⓘ Source: listings_history table (triggers on properties + properties_extension) + one-shot
backfill from property_details.listing_events for pre-trigger history.
Climate risk First Street
- Flood 1/10 Low FEMA zone X (unshaded) · 0% chance over 30 yrs
- Wildfire 4/10 Moderate
- Heat 10/10 Extreme 7 d/yr ≥108°F today · 22 d/yr by 30 yrs out
- Wind 10/10 Extreme 99% chance of damaging wind over 30 yrs
- Air quality 2/10 Low 1 unhealthy d/yr today · 1 by 30 yrs out
Nearby sold comps map
Loading sold comps map…
Walkable amenities ~0.75 mi
Loading nearby amenities…
Taxation est. · year 1
- Rental income
- $11,041
- − Mortgage interest
- −$6,363
- − Property taxes
- −$1,704
- − Insurance
- −$568
- − Repairs & maintenance
- −$883
- − Management
- −$883
- − Depreciation
- −$3,304
- Taxable loss
- −$2,665
- Est. tax savings @ 24.0%
- +$640
- After-tax cash flow
- $-58/yr
For passive investors: Depreciation is non-cash, so a rental often shows a tax loss while cash-flowing — sheltering income. Rental losses are passive: they offset passive income freely, and up to $25,000/yr can offset ordinary (W-2) income if you actively participate and your MAGI is under $100k (phasing out to $0 by $150k); unused losses carry forward. On sale, claimed depreciation is recaptured at up to 25%, and gains may owe capital-gains tax (a 1031 exchange can defer both). Figures are a year-1 estimate at your 24.0% rate — not tax advice; consult a CPA.
Schools (NCES district)
- District
- Franklin
- NCES district ID
- 1200570
- Math proficiency
- 33% ▼ -9.00%
- Reading proficiency
- 38% ▼ -4.00%
- Median HH income
- $39,084
- Composite
- 29.7/100
- National rank
- #6454
- State rank
- #67 of 73 in FL
Livability — Carrabelle
- Score
- 69/100
- State rank
- #466
- US rank
- #8398
Category grades
Schools grade is shown separately in the Schools card above.
Census & demographics
- Population (ZIP)
- 28
Population outlook (Franklin County) Hauer SSP2
- Today (2025)
- 11,827 people
- By 2030
- 11,839 · +0.1%
- By 2040
- 11,707 · -1.0%
- By 2050
- 11,218 · -5.1%
- By 2075
- 9,849 · -16.7%
- By 2100
- 7,286 · -38.4%
Race, ethnicity, and origin ACS 2023
- Neighborhood character
- Predominantly White (100%)
- Race & ethnicity
- White 100%
Political lean MEDSL · Franklin
- 2024 margin
- Solid R (+43.8) · D 27.7% · R 71.5%
- 2008→2024 swing
- -15.9pp toward R · 2008: -27.9pp · 2024: -43.8pp
- All cycles
- 2024: R+43.8 2020: R+37.3 2016: R+39.7 2012: R+31.5 2008: R+27.9
Not yet ingested
- Civics
- —
Market trends
- HPI YoY
- ▲ 1.24%
- Current HPI
- 143.9448
- Rent YoY
- —
- Metro
- —
- State GDP YoY
- ▲ 3.28%
- F500 in state
- 36
Industry mix (Fortune 500 HQ in FL)
| Industry | F500 HQs | Revenue |
|---|---|---|
| Industrial Technology | 2 | $29B |
|
||
| Insurance | 2 | $17B |
|
||
| Retail | 1 | $60B |
|
||
| Technology Distribution | 1 | $58B |
|
||
| Homebuilding | 1 | $35B |
|
||
| Technology Manufacturing | 1 | $35B |
|
||
Price history
3 events — show timeline
- 2026-05-05 Relisted — RAFGC
- 2026-03-30 Contingent — RAFGC
- 2026-03-06 Listed $92,000 RAFGC
Cash-flow waterfall
monthlySold comps — $/sqft
last 12 mo · ≤1 miLoading sold comps…