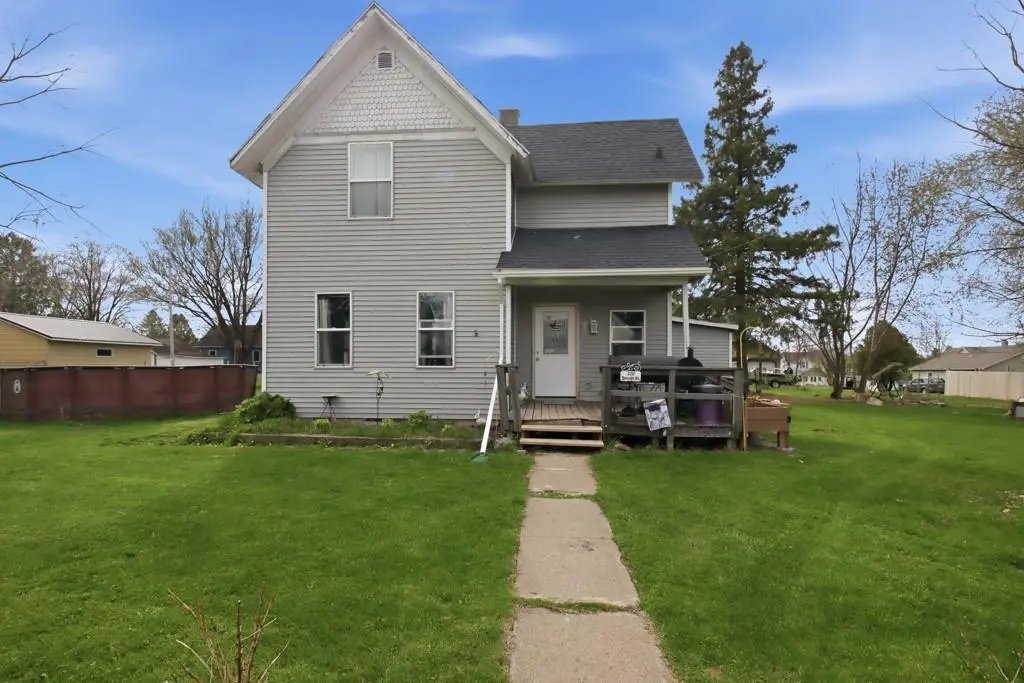
228 Lincoln St · Stanley, WI
Flood risk 1/10 · Minimal
- FEMA flood zone
- X (unshaded)
- Chance of flooding over 30 yrs
- 0.0%
- Est. flood insurance / yr
- $507 – $1,088
Fire risk 1/10 · Minimal
- Est. fire insurance / yr
- $636 – $1,182
Heat risk 1/10 · Minimal
- Hot days now (above 96°F)
- 7 days/yr
- Hot days in 30 yrs
- 14 days/yr
Wind risk 1/10 · Minimal
- Chance of severe wind over 30 yrs
- —
Air-quality risk 2/10 · Minimal
- Unhealthy air days now
- 1 days/yr
- Unhealthy air days in 30 yrs
- 1 days/yr
Risk factors via First Street. Map © Google.
Why this score? — see what drove the C+ grade
The composite is a weighted blend of 9 inputs, each scored 0–100. Each bar is that input's sub-score; the figure is the points it added to the 100-point composite (weight × sub-score).
- Cash flow +21.5/30.0
- ARV discount +15.0/15.0
- DSCR +6.9/10.0
- 1% rule +5.2/10.0
- Schools +3.9/10.0
- Livability +3.2/5.0
- Rent growth +2.5/5.0
- Condition / age +2.5/5.0
- Appreciation +0.0/10.0
$146,500
🖨 Deal sheet (PDF) 📄 Offer letter ✓ Due diligence
Listing remarks
This 3-bedroom, 1.5-bath property is ideally located within walking distance to local shops, parks, and everyday conveniences. Over the years, the home has seen numerous improvements, including updated windows and some upgraded plumbing and electrical. Situated on a spacious lot just shy of half an acre, the outdoor space is a rare find for in-town living. Whether you envision a large garden, play area, additional outbuildings, or building the garage of your dreams, this property offers plenty of room to bring your ideas to life. The generous lot provides endless possibilities while still being conveniently located close to town amenities. While the home still needs finishing touches and ad
Key facts
- Upgraded plumbing
- Updated windows
- Upgraded electrical
Tags
Property features AI
Exterior
- Parking: Attached 1-car garage
- Utilities: Municipal water; Municipal sewer
- Home design: Two-story single-family home; Less than 1/2 acre lot (approximately 0.43 acre)
- Construction: Vinyl exterior; Partial basement with stone and other materials
- Exterior features: Deck; Enclosed porch; Open porch; Fenced yard
Interior
- Bathrooms: One full bathroom; One half bathroom
- Heating & cooling: Baseboard heating; Forced air heating; Natural gas heat
- Interior features: Circuit breakers
- Laundry & utility: Washer and dryer included
Neighborhood map
What this means for you Summary
Snapshot
- This is a 3-bed/1.5-bath single-family listed at $146k.
Deal economics
- At list price, monthly cash flow is $219 ($3k/yr) — positive.
- The deal already cash-flows at list — no discount required.
- Meets the 1% rule at list price ($1k rent vs $146k).
- Recommended offer: $142k (3.0% below list) — sets the bar for market timing.
- Cap rate 8.1% vs local median 2.5% in Stanley — top-decile yield for the area; either an underpriced asset or a hidden risk that comps aren't pricing in. Stress-test before assuming the spread holds.
Location & tenants
- Location reads 65/100 on livability (#492 in WI) — a middle-class / working-renter tenant base. Strengths: cost of living A+, housing A+; Watch: employment C-, health & safety D, schools F.
- Stanley-Boyd Area School District (town): math 50% / reading 43% proficiency, ranked #93 of 342 in WI (top 27%) — families likely to look elsewhere, expect single-tenant / working-renter base with shorter leases.
- Market conditions: 11 active listings in the ZIP; 1 comparable units currently listed for rent nearby; 368 units permitted in Chippewa County in 2024 (142 in 5+ unit buildings).
Forward outlook
- Local home prices are declining (-3.0%/yr); year-one equity from $1k of loan paydown is wiped out by about $4k of value loss. Plan a longer hold.
- Chippewa County population projected to shrink 5% by 2050 — rents likely to lag national; underwrite the cash flow, not the appreciation.
Negotiation context
- It's been on market 35 days — a 3% lower offer ($142k) is reasonable based on typical stale-listing flexibility.
- Current owner paid $27k; list at $146k implies a 437% gain — meaningful room to come down on a strong offer.
Risks & watch-outs
- Watch-outs: built in 1900 — expect roof / HVAC / electrical / plumbing capex.
Questions for the listing agent
- It's been on market 35 days. Have you received any prior offers? Is the seller open to a 3% concession, seller financing, or rate buy-down credit?
- Built in 1900 — when were the roof, HVAC, electrical panel, plumbing, and water heater last replaced?
- Is there a deadline driving the sale (1031 exchange, divorce, estate, relocation)? That informs how much negotiation room exists.
- Schools are F-rated, which usually means shorter tenancies and higher turnover. Who's the typical renter profile here, and what's been the actual vacancy rate?
- What's the average days-on-market for RENTAL listings here right now (not sales)? A rising rental-DOM trend means longer vacancies and softer asking-rent achievability than the comps imply.
- What's the recent tenant-quality profile in this submarket — average credit score on applications, eviction rate, late-payment / NSF rate, and stable-employment percentage? A property-management company in the area should have these aggregated.
- How much new for-sale + rental construction is in the pipeline within 1–3 miles? Heavy new supply typically softens prices + rents 12–24 months out; constrained supply supports both.
Investment metrics
- 1% rule
- 1.02% ✓
- Cap rate
- 8.09%
- Cash-on-cash
- 6.41%
- DSCR
- 1.29
- GRM
- 8.2
CMA / ARV
- ARV (median comp)
- $191,655
- List price
- $146,500
- Delta
- -23.56%
- Verdict
- UNDERPRICED
- Comps
- 20 within 1.0 mi
Show comp detail 9 sales within ~0.75 mi
| Address | Dist | Beds/Ba | Sqft | Sold | Price | $/sf | Match |
|---|---|---|---|---|---|---|---|
| 237 Garfield St | 0.04mi | 3/2.0 | 1,702 (-8%) | 1mo | $164,000 | $96 | 82 |
| 329 S Broadway St | 0.20mi | 4/1.5 (+1) | 1,874 (+2%) | 5mo | $185,000 | $99 | 79 |
| 212 Lincoln St | 0.05mi | 3/2.0 | 1,680 (-9%) | 11mo | $282,000 | $168 | 72 |
| 523 Madison St | 0.45mi | 3/1.5 | 1,873 (+2%) | 8mo | $219,900 | $117 | 70 |
| 225 S Franklin St | 0.09mi | 4/1.5 (+1) | 2,000 (+8%) | 18mo | $240,000 | $120 | 62 |
| 638 Madison St | 0.58mi | 4/1.5 (+1) | 1,811 (-2%) | 9mo | $180,000 | $99 | 57 |
| 136 E 6th Ave | 0.44mi | 3/2.0 | 1,700 (-8%) | 14mo | $257,000 | $151 | 53 |
| 324 E 6th Ave | 0.47mi | 4/2.0 (+1) | 2,100 (+14%) | 1mo | $290,000 | $138 | 47 |
| 417 Mckenzie St | 0.67mi | 3/2.0 | 2,065 (+12%) | 3mo | $237,000 | $115 | 45 |
Match score weights: distance 35% · size 25% · config 20% · recency 20%. Top-matched comps best support the ARV.
Projected returns pro-forma
-3.0% appreciation · 3.0% rent growth · sell at horizon
- IRR
- -6.4%
- Equity multiple
- 0.76×
- Total profit
- $-9,794
- Equity at exit
- $21,844
- IRR
- 3.2%
- Equity multiple
- 1.23×
- Total profit
- $9,405
- Equity at exit
- $12,667
Cash invested: $41,020 (down + closing). Projections, not guarantees.
Landlord ↔ Tenant lean methodology
- Overall (STATE)
- 73 Landlord-Friendly
- State Wisconsin
- 73 Landlord-Friendly · R+2
- County
- — inherits STATE
- City
- — inherits STATE
ZIP-level market 54768
- Home prices YoY
- -15.9%
- Active inventory
- 11
- Price-to-rent
- 8.2×
Monthly cashflow live
- Estimated rent
- $1,495 medium interval (Pro) →
- Mortgage (P&I)
- −$768
- Tax from tax record
- −$133 /mo · $1,592/yr
- Insurance
- −$61
- HOA
- −$0
- Vacancy / Maint / Mgmt
- −$314
- Net cashflow
- $219
Break-even live
Sensitivity live
| Price | -10% $302 | -5% $261 | +0% $219 | +5% $178 | +10% $136 |
|---|---|---|---|---|---|
| Rent | -10% $101 | -5% $160 | +0% $219 | +5% $278 | +10% $337 |
| Rate | -1.0pp $293 | -0.5pp $256 | base $219 | +0.5pp $181 | +1.0pp $143 |
UW: 25.0% down · 7.5% · 30yr · 1.5% tax · 5.0% vac · 8.0% maint · 8.0% mgmt
Financing live
Cash to close
- Down payment
- $36,625
- Closing costs
- $4,395
- Reserves months
- —
- Total cash needed
- —
Loan-product check · same deal, 3 products live
Conventional
25% down · 7.5% · 30yr
- Down + closing
- —
- Monthly P&I
- —
- Monthly cashflow
- —
- DSCR
- —
- Eligible?
- —
Personal DTI + credit; lowest rate.
DSCR
20% down · 8.5% · 30yr
- Down + closing
- —
- Monthly P&I
- —
- Monthly cashflow
- —
- DSCR
- —
- Eligible?
- —
No personal income docs; deal must DSCR.
Hard money
10% down · 12.0% · 12mo
- Down + closing
- —
- Monthly P&I
- —
- Monthly cashflow
- —
- DSCR
- —
- Eligible?
- —
Short-term bridge; refi at stabilization.
Rent comps 1 comps
| Address | Beds | Baths | Sqft | Rent | $/sqft | DOM | Units | Dist |
|---|---|---|---|---|---|---|---|---|
| 335 E 3rd Ave Unit TH335X Stanley, WI | 3.0 | 2.0 | 1863 | $1,495 | $0.80 | 44d | 1 | 0.32mi |
Listing history 11 events
-
2026-06-05days on market $146,500 Active 35 DOM
-
2026-06-04days on market $146,500 Active 34 DOM
-
2026-06-03days on market $146,500 Active 33 DOM
-
2026-06-02remarks 699-char remark
-
2026-06-02pricedays on market $146,500 Active 32 DOM
-
2026-06-01days on market $157,900 Active 31 DOM
-
2026-05-31days on market $157,900 Active 30 DOM
-
2026-05-12price $172,900 529-char remark
-
2026-05-01$180,000 Active 529-char remark
-
2019-03-28soldstatus $27,300
-
2015-08-10soldstatus $35,000
ⓘ Source: listings_history table (triggers on properties + properties_extension) + one-shot
backfill from property_details.listing_events for pre-trigger history.
Tax reassessment forecast WI · Partial reset (capped growth)
- Current annual tax
- $1,592 · $133/mo
- Projected year-2 tax
- $2,151 · $179/mo
- Expected delta
- +$559/yr (+$47/mo · 35.1%)
ⓘ Screening estimate from a state-policy table — verify with the county assessor before closing.
Climate risk First Street
- Flood 1/10 Low FEMA zone X (unshaded) · 0% chance over 30 yrs
- Wildfire 1/10 Low
- Heat 1/10 Low 7 d/yr ≥96°F today · 14 d/yr by 30 yrs out
- Wind 1/10 Low
- Air quality 2/10 Low 1 unhealthy d/yr today · 1 by 30 yrs out
Nearby sold comps map
Loading sold comps map…
Walkable amenities ~0.75 mi
Loading nearby amenities…
Taxation est. · year 1
- Rental income
- $17,940
- − Mortgage interest
- −$8,206
- − Property taxes
- −$1,592
- − Insurance
- −$732
- − Repairs & maintenance
- −$1,435
- − Management
- −$1,435
- − Depreciation
- −$4,262
- Taxable income
- $277
- Est. tax owed @ 24.0%
- −$67
- After-tax cash flow
- $2,563/yr
For passive investors: Depreciation is non-cash, so a rental often shows a tax loss while cash-flowing — sheltering income. Rental losses are passive: they offset passive income freely, and up to $25,000/yr can offset ordinary (W-2) income if you actively participate and your MAGI is under $100k (phasing out to $0 by $150k); unused losses carry forward. On sale, claimed depreciation is recaptured at up to 25%, and gains may owe capital-gains tax (a 1031 exchange can defer both). Figures are a year-1 estimate at your 24.0% rate — not tax advice; consult a CPA.
Schools (NCES district)
- District
- Stanley-Boyd Area School District
- NCES district ID
- 5514430
- Math proficiency
- 50% ▼ -2.00%
- Reading proficiency
- 43% ▼ -3.00%
- Median HH income
- $42,868
- Composite
- 39.24/100
- National rank
- #4007
- State rank
- #93 of 342 in WI
Livability — Stanley
- Score
- 65/100
- State rank
- #492
- US rank
- #12459
Category grades
Schools grade is shown separately in the Schools card above.
Census & demographics
- Census place
- Stanley, WI
- City population
- 6,588
- Population (ZIP)
- 6,588
Population outlook (Chippewa County) Hauer SSP2
- Today (2025)
- 64,601 people
- By 2030
- 64,743 · +0.2%
- By 2040
- 63,950 · -1.0%
- By 2050
- 61,359 · -5.0%
- By 2075
- 53,265 · -17.5%
- By 2100
- 40,534 · -37.3%
Race, ethnicity, and origin ACS 2023
- Neighborhood character
- Predominantly White (85%)
- Race & ethnicity
- White 85% Black 8% Two or more races 4% Hispanic / Latino 3% Native American 1%
- Common ancestry
- Romanian 10% Portuguese 8% Lithuanian 2%
- Foreign-born
- 2% · Canada
- Languages at home
- 88% English-only · German/W. Germanic 7% Spanish 2% Other Asian/Pacific 1%
Political lean MEDSL · Chippewa
- 2024 margin
- Strong R (+23.0) · D 38.0% · R 60.9% · Other 1.1%
- 2008→2024 swing
- -32.1pp toward R · 2008: 9.1pp · 2024: -23.0pp
- All cycles
- 2024: R+23.0 2020: R+20.4 2016: R+19.2 2012: R+0.5 2008: D+9.1
Not yet ingested
- Civics
- —
Market trends
- HPI YoY
- ▼ -46.11%
- Current HPI
- 244.3593
- Rent YoY
- —
- Metro
- —
- State GDP YoY
- ▲ 2.10%
- F500 in state
- 20
Industry mix (Fortune 500 HQ in WI)
| Industry | F500 HQs | Revenue |
|---|---|---|
| Industrial Machinery | 4 | $23B |
|
||
| Industrial Technology | 2 | $36B |
|
||
| Insurance | 1 | $36B |
|
||
| Professional Services | 1 | $19B |
|
||
| Utilities | 1 | $9B |
|
||
| Consumer Goods | 1 | $3B |
|
||
Price history
+318.6% since first listed7 events — show timeline
- 2026-06-07 Listing Removed — RANWW
- 2026-06-02 Price Changed $146,500 RANWW
- 2026-05-23 Price Changed $157,900 RANWW
- 2026-05-12 Price Changed $172,900 RANWW
- 2026-05-01 Listed $180,000 RANWW
- 2019-03-28 Sold (Public Records) $27,300 Public Records
- 2015-08-10 Sold (Public Records) $35,000 Public Records
Property tax history
+1.4%/yrLatest (2025): $1,592 · -7.0% YoY. Source: county tax records.
Cash-flow waterfall
monthlySold comps — $/sqft
last 12 mo · ≤1 miLoading sold comps…