None · Miami Beach, FL
Flood risk No data
- FEMA flood zone
- —
- Chance of flooding over 30 yrs
- —
- Est. flood insurance / yr
- —
Fire risk No data
- Est. fire insurance / yr
- —
Heat risk No data
- Hot days now (above threshold)
- —
- Hot days in 30 yrs
- —
Wind risk No data
- Chance of severe wind over 30 yrs
- —
Air-quality risk No data
- Unhealthy air days now
- —
- Unhealthy air days in 30 yrs
- —
Risk factors via First Street. Map © Google.
Why this score? — see what drove the D grade
The composite is a weighted blend of 9 inputs, each scored 0–100. Each bar is that input's sub-score; the figure is the points it added to the 100-point composite (weight × sub-score).
- Cash flow +11.1/30.0
- ARV discount +7.5/15.0
- 1% rule +5.4/10.0
- Schools +5.0/10.0
- Livability +4.0/5.0
- Condition / age +4.0/5.0
- DSCR +3.2/10.0
- Rent growth +2.6/5.0
- Appreciation +0.0/10.0
$350,000
🖨 Deal sheet 📄 Offer letter ✓ Due diligence
Listing remarks
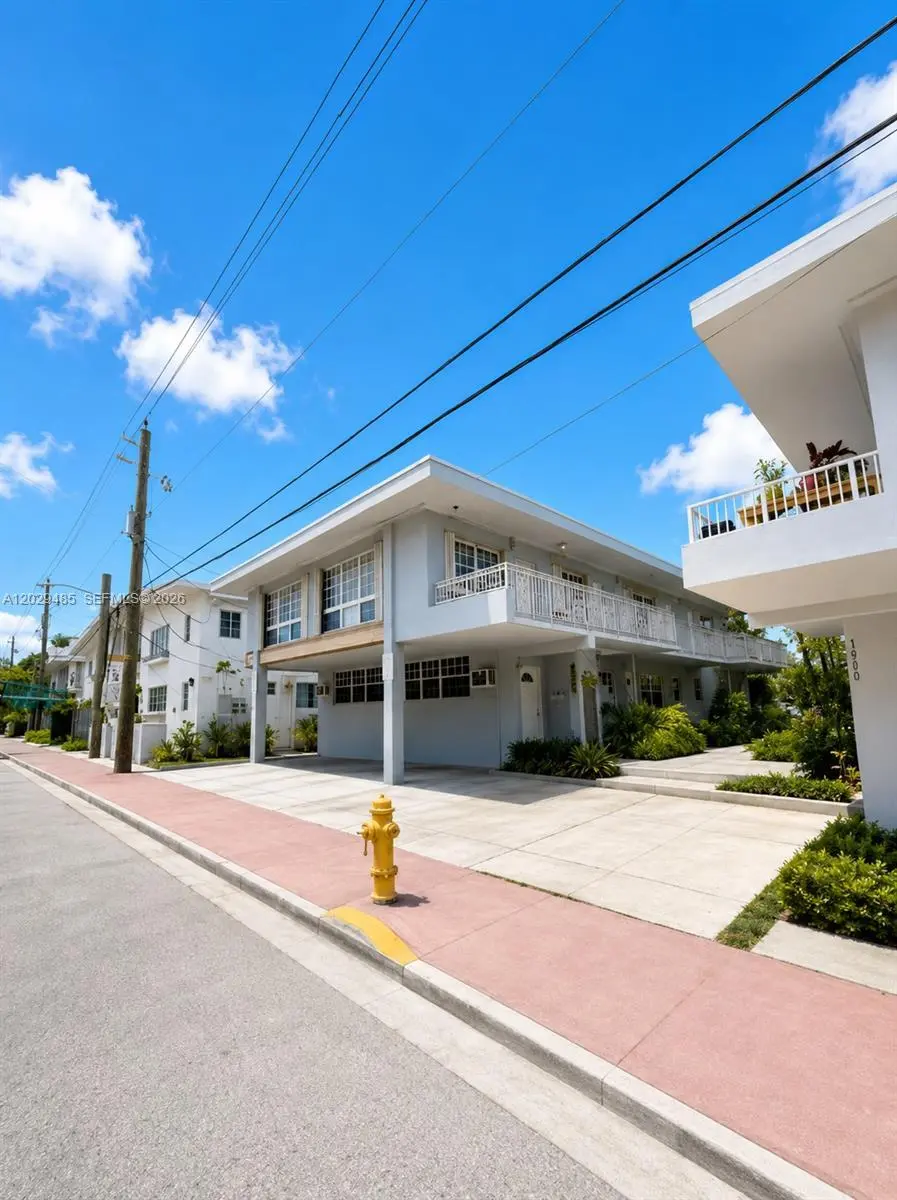
Welcome to a beautifully bright and spacious 2-bedroom, 2-bath condo in the heart of Miami Beach. Filled with natural light, this inviting home features an open and airy layout, generously sized living areas, and well-proportioned bedrooms designed for comfortable everyday living. Large windows throughout create a bright and welcoming atmosphere, while the functional floor plan offers plenty of space for relaxing, entertaining, or working from home. Ideally located near beaches, parks, shopping, dining, and all that Miami Beach has to offer, this residence presents an excellent opportunity for a homeowner or investor! Highlights:2 Bedrooms | 2 BathroomsBright, sun-filled interiorsSpaciou
Key facts
- Access to shopping
- Waterfront location
- $590 HOA
Tags
Property features AI
Finance
- Other: Pets not allowed
- HOA & community: Community association with monthly HOA fee of $590; Association services include management, parking, grounds maintenance, structure maintenance, water, common areas, reserve funds, and roof repairs
Exterior
- Parking: Assigned parking space; One open parking space
- Utilities: Water service included in association fees; Public sewer; Electric service
- Home design: Condominium; 2-story building
- Construction: Block construction
- Exterior features: Waterfront property (specified as Yes) — waterfront features listed as None/Other; Entry on the 2nd level
Interior
- Kitchen: Gas range; Microwave; Refrigerator
- Flooring: Ceramic tile flooring
- Bathrooms: 2 full bathrooms
- Heating & cooling: Central heating; Central air conditioning
- Interior features: Blinds on windows
Neighborhood map
What this means for you Summary
Snapshot
- This is a 2-bed/2.0-bath condo listed at $350k. Condition is rated good.
Deal economics
- At list price, monthly cash flow is $-144 ($-2k/yr) — negative.
- To cash-flow at today's rent, offer at most $329k (5.9% below list).
- Meets the 1% rule at list price ($4k rent vs $350k).
- Recommended offer: $329k (5.9% below list) — sets the bar for cash-flow.
- Cap rate 5.8% vs local median 1.5% in Miami Beach — top-decile yield for the area; either an underpriced asset or a hidden risk that comps aren't pricing in. Stress-test before assuming the spread holds.
Location & tenants
- Location reads 80/100 on livability (#108 in FL, #1,672 nationally) — a professional / high-income tenant draw. Strengths: crime A+, commute A+, health & safety A+; Watch: housing C-, amenities D-, cost of living F.
- Market conditions: Rents flat; 644 active listings in the ZIP; 10,051 units permitted in Miami-Dade County in 2024 (7,758 in 5+ unit buildings).
- At $3,627/mo this rent would consume 63% of the median local household income ($69k/yr) (locally 3521% of renters already pay >50% of income on rent) — very limited rent-growth headroom before tenants either downsize or default.
Forward outlook
- Local home prices are declining (-3.0%/yr); year-one equity from $2k of loan paydown is wiped out by about $10k of value loss. Plan a longer hold.
- Miami-Dade County population projected at +28% by 2050 — long-run rental-demand tailwind backs the buy-and-hold thesis.
Negotiation context
- Only 1 days on market — expect competitive offers; lowballing is unlikely to land.
Questions for the listing agent
- What do current leases actually rent for vs. the listed asking? Can we see a recent rent roll and the last 12 months of T-12 income?
- Built in 1962 — when were the roof, HVAC, electrical panel, plumbing, and water heater last replaced?
- What does the HOA fee cover, when was the last increase, and are there any pending special assessments or reserve-fund shortfalls?
- Any open or pending special assessments — roof, HVAC, plumbing, elevator, façade? What's the per-unit balance and payoff schedule, and is the seller paying it off at close or rolling it to the buyer?
- Is there a deadline driving the sale (1031 exchange, divorce, estate, relocation)? That informs how much negotiation room exists.
- Schools are A-rated — typically a magnet for longer-tenancy family renters. What's the average tenant stay here, and is there a school-zone premium baked into asking?
- The area grade is low — what's the realistic commute time and amenity access for the typical tenant pool here? Any planned neighborhood developments (good or bad) we should know about?
- What's the average days-on-market for RENTAL listings here right now (not sales)? A rising rental-DOM trend means longer vacancies and softer asking-rent achievability than the comps imply.
- What's the recent tenant-quality profile in this submarket — average credit score on applications, eviction rate, late-payment / NSF rate, and stable-employment percentage? A property-management company in the area should have these aggregated.
- How much new apartment / multifamily construction is in the pipeline within 1–3 miles? Heavy new supply (>2% of stock underway) typically softens rents 12–24 months out; light construction supports rent growth.
Investment metrics
- 1% rule
- 1.04% ✓
- Cap rate
- 5.80%
- Cash-on-cash
- -1.76%
- DSCR
- 0.92
- GRM
- 8.0
CMA / ARV
No comps found within radius.
Projected returns pro-forma
-3.0% appreciation · 0.44% rent growth · sell at horizon
- IRR
- -22.7%
- Equity multiple
- 0.24×
- Total profit
- $-74,555
- Equity at exit
- $52,186
- IRR
- -28.2%
- Equity multiple
- -0.13×
- Total profit
- $-110,517
- Equity at exit
- $30,262
Cash invested: $98,000 (down + closing). Projections, not guarantees.
Landlord ↔ Tenant lean methodology
- Overall (STATE)
- 87 Strongly Landlord-Friendly
- State Florida
- 87 Strongly Landlord-Friendly · R+3
- County
- — inherits STATE
- City
- — inherits STATE
ZIP-level market 33141
- Rents YoY
- 0.4%
- Active inventory
- 644
- Price-to-rent
- 8.0×
Monthly cashflow live
- Estimated rent
- $3,627 medium interval (Pro) →
- Mortgage (P&I)
- −$1,835
- Tax est. 1.5%
- −$438 /mo · $5,250/yr
- Insurance
- −$146
- HOA
- −$590
- Vacancy / Maint / Mgmt
- −$762
- Net cashflow
- $-144
Break-even live
UW: 25.0% down · 7.5% · 30yr · 1.5% tax · 5.0% vac · 8.0% maint · 8.0% mgmt
Financing live
Cash to close
- Down payment
- $87,500
- Closing costs
- $10,500
- Reserves months
- —
- Total cash needed
- —
Loan-product check · same deal, 3 products live
Conventional
25% down · 7.5% · 30yr
- Down + closing
- —
- Monthly P&I
- —
- Monthly cashflow
- —
- DSCR
- —
- Eligible?
- —
Personal DTI + credit; lowest rate.
DSCR
20% down · 8.5% · 30yr
- Down + closing
- —
- Monthly P&I
- —
- Monthly cashflow
- —
- DSCR
- —
- Eligible?
- —
No personal income docs; deal must DSCR.
Hard money
10% down · 12.0% · 12mo
- Down + closing
- —
- Monthly P&I
- —
- Monthly cashflow
- —
- DSCR
- —
- Eligible?
- —
Short-term bridge; refi at stabilization.
HOA detail condo
- Monthly dues
- $590 · $7,080/yr
- Assessments
- None detected in remarks — confirm with the listing agent.
Listing history 2 events
-
2026-06-10remarks 699-char remark
-
2026-06-10$350,000 Active 1 DOM
ⓘ Source: listings_history table (triggers on properties + properties_extension) + one-shot
backfill from property_details.listing_events for pre-trigger history.
Nearby sold comps map
Loading sold comps map…
Walkable amenities ~0.75 mi
Loading nearby amenities…
Taxation est. · year 1
- Rental income
- $43,521
- − Mortgage interest
- −$19,605
- − Property taxes
- −$5,250
- − Insurance
- −$1,750
- − Repairs & maintenance
- −$3,482
- − Management
- −$3,482
- − HOA
- −$7,080
- − Depreciation
- −$10,182
- Taxable loss
- −$7,310
- Est. tax savings @ 24.0%
- +$1,754
- After-tax cash flow
- $31/yr
For passive investors: Depreciation is non-cash, so a rental often shows a tax loss while cash-flowing — sheltering income. Rental losses are passive: they offset passive income freely, and up to $25,000/yr can offset ordinary (W-2) income if you actively participate and your MAGI is under $100k (phasing out to $0 by $150k); unused losses carry forward. On sale, claimed depreciation is recaptured at up to 25%, and gains may owe capital-gains tax (a 1031 exchange can defer both). Figures are a year-1 estimate at your 24.0% rate — not tax advice; consult a CPA.
Condition & rehab AI · 12 photos
This well-maintained and updated condo in Miami Beach is move-in ready with a good condition score and minimal repairs needed.
Value-add opportunities
- Both Painting exterior and interior walls — Enhances curb appeal and interior aesthetics
- Both Landscaping improvements — Enhances curb appeal and adds value
- Both New flooring in kitchen and bathrooms — Improves functionality and aesthetics
- Both New appliances in kitchen — Enhances functionality and aesthetics
Renovation cost estimate screening
Value-add ROI direction
- Both Painting exterior and interior walls — Enhances curb appeal and interior aesthetics ↑
- Both Landscaping improvements — Enhances curb appeal and adds value ↑
- Both New flooring in kitchen and bathrooms — Improves functionality and aesthetics ↑
- Both New appliances in kitchen — Enhances functionality and aesthetics ↑
ⓘ Cost ranges are severity-bucket heuristics (US national rule-of-thumb). Get contractor quotes + a written scope before underwriting a rehab budget.
Schools (NCES district)
No district data.
Livability — Miami Beach
- Score
- 80/100
- State rank
- #108
- US rank
- #1672
Category grades
Schools grade is shown separately in the Schools card above.
Census & demographics
- Census place
- Miami Beach, FL
- County
- Miami-Dade County · 2,697,751 people
- City population
- 90,533
- Metro
- Miami-Fort Lauderdale-Pompano Beach, FL
- Population (ZIP)
- 36,438
- Household income
- $68,738
- Rent vs Own
- Severe rent burden
- 3521.0
Population outlook (Miami-Dade County) Hauer SSP2
- Today (2025)
- 3,126,439 people
- By 2030
- 3,325,765 · +6.4%
- By 2040
- 3,697,561 · +18.3%
- By 2050
- 4,012,134 · +28.3%
- By 2075
- 4,605,612 · +47.3%
- By 2100
- 4,866,598 · +55.7%
Race, ethnicity, and origin ACS 2023
- Neighborhood character
- Predominantly Hispanic (67%)
- Race & ethnicity
- Hispanic / Latino 67% Two or more races 36% White 20% Black 4% Asian 3%
- Hispanic origin (detail)
- Mexican 1% Puerto Rican 3% Cuban 27% Salvadoran 6%
- Common ancestry
- Scotch-Irish 2% Romanian 2% Armenian 1%
- Foreign-born
- 62% · Canada, Jamaica, Dominican Republic
- Languages at home
- 18% English-only · Spanish 69% Other Indo-European 4% French/Haitian/Cajun 3%
Political lean MEDSL · Miami-Dade
- 2024 margin
- R (+11.4) · D 43.9% · R 55.4%
- 2008→2024 swing
- -27.6pp toward R · 2008: 16.1pp · 2024: -11.4pp
- All cycles
- 2024: R+11.4 2020: D+7.3 2016: D+29.6 2012: D+23.7 2008: D+16.1
Not yet ingested
- Civics
- —
Market trends
- HPI YoY
- ▼ -472.71%
- Current HPI
- 336.7298
- Rent YoY
- ▲ 0.44%
- Metro
- Miami-Fort Lauderdale-Pompano Beach, FL
- State GDP YoY
- ▲ 3.28%
- F500 in state
- 36
Industry mix (Fortune 500 HQ in FL)
| Industry | F500 HQs | Revenue |
|---|---|---|
| Industrial Technology | 2 | $29B |
|
||
| Insurance | 2 | $17B |
|
||
| Retail | 1 | $60B |
|
||
| Technology Distribution | 1 | $58B |
|
||
| Homebuilding | 1 | $35B |
|
||
| Technology Manufacturing | 1 | $35B |
|
||
Price history
1 event — show timeline
- 2026-06-02 Listed $350,000 Beaches MLS
Cash-flow waterfall
monthlySold comps — $/sqft
last 12 mo · ≤1 miLoading sold comps…