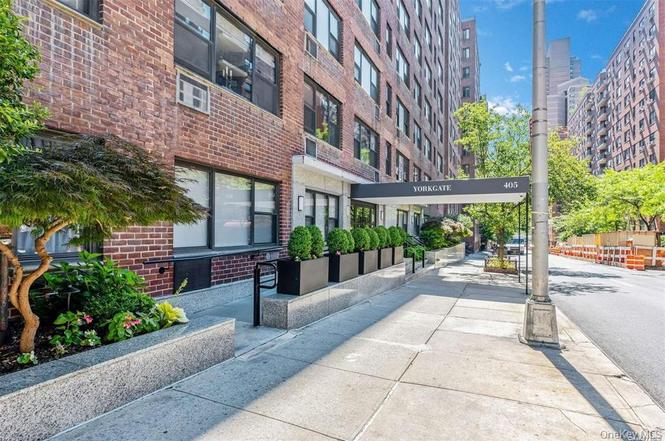
405 E 63 Unit 3E · New York, NY
Flood risk 1/10 · Minimal
- FEMA flood zone
- X (unshaded)
- Chance of flooding over 30 yrs
- 0.0%
- Est. flood insurance / yr
- $507 – $1,088
Fire risk 1/10 · Minimal
- Est. fire insurance / yr
- $691 – $1,283
Heat risk 6/10 · Moderate
- Hot days now (above 99°F)
- 7 days/yr
- Hot days in 30 yrs
- 15 days/yr
Wind risk 6/10 · Moderate
- Chance of severe wind over 30 yrs
- 27.0%
Air-quality risk 4/10 · Minor
- Unhealthy air days now
- 5 days/yr
- Unhealthy air days in 30 yrs
- 6 days/yr
Risk factors via First Street. Map © Google.
Why this score? — see what drove the D grade
The composite is a weighted blend of 9 inputs, each scored 0–100. Each bar is that input's sub-score; the figure is the points it added to the 100-point composite (weight × sub-score).
- Appreciation +7.9/10.0
- 1% rule +7.5/10.0
- ARV discount +7.5/15.0
- Rent growth +5.0/5.0
- Schools +5.0/10.0
- Cash flow +4.0/30.0
- Livability +3.8/5.0
- Condition / age +2.5/5.0
- DSCR +0.0/10.0
$450,000
🖨 Deal sheet (PDF) 📄 Offer letter ✓ Due diligence
Listing remarks
Welcome to 405 East 63rd Street, Apt 3E, a spacious 1-bedroom, 1-bathroom residence offering approximately 850 sq ft, ideally located in the heart of Lenox Hill. This beautifully laid-out home features a gracious entry foyer with two large closets, leading to a dedicated dressing area with an additional oversized closet and a well-appointed bathroom. The expansive living and dining area showcases parquet floors and provides ample space for comfortable entertaining. The separate bedroom offers privacy and generous proportions, while the windowed kitchen adds charm and functionality. Situated in the well-managed, full-service York Gate cooperative, residents enjoy a 24-hour doorman, live-in r
Key facts
- Roof deck
- Entry foyer
- Windowed kitchen
Tags
Neighborhood map
What this means for you Summary
Snapshot
- This is a 1-bed/1.0-bath condo listed at $450k.
Deal economics
- At list price, monthly cash flow is $-1k ($-15k/yr) — negative.
- The deal already cash-flows at list — no discount required.
- Meets the 1% rule at list price ($6k rent vs $450k).
- Recommended offer: $443k (1.5% below list) — sets the bar for market timing.
Location & tenants
- Location reads 75/100 on livability (#268 in NY, #4,188 nationally) — a middle-class / working-renter tenant base. Strengths: amenities A+, commute A+, health & safety A; Watch: crime F, cost of living F.
- Zoned schools: Elm Tree Elementary School (math 27% / reading 52%, grade F, #1,444 of 2,108 statewide, top 71%, 806 students, 94% FRL); Mark Twain Is 239 For The Gifted And Talented (math 90% / reading 96%, grade A+, #6 of 729 statewide, top 1%, 1,207 students, 44% FRL); Midwood High School (math 94% / reading 96%, grade A+, #83 of 1,100 statewide, top 8%, 4,062 students, 73% FRL).
- Market conditions: Rents rising fast (+11.6%/yr); 344 active listings in the ZIP; 40 comparable units currently listed for rent nearby; rentals at typical pace (median 17d on market — plan ~3-4 weeks tenant-placement turnaround); high-income renter base; 4,467 units permitted in New York County in 2024 (4,463 in 5+ unit buildings).
- This rent runs 44% of the median local income ($155k/yr) — at the standard rent-burdened threshold; future hikes will face affordability resistance.
Forward outlook
- In year one you build about $29k of equity ($3k loan paydown + $26k appreciation (5.8% local appreciation)).
- New York County population projected at +21% by 2050 — long-run rental-demand tailwind backs the buy-and-hold thesis.
- By year 2, paydown + projected appreciation supports a ~$47k cash-out refi (75% LTV) — recoverable capital for the next deal without selling this one.
Negotiation context
- It's been on market 23 days — a 2% lower offer ($443k) is reasonable based on typical stale-listing flexibility.
Risks & watch-outs
- Watch-outs: HOA is 46% of rent; built in 1957 — expect roof / HVAC / electrical / plumbing capex.
- Climate carrying-cost: major wind risk, 27% chance of damaging wind over 30y; extreme-heat days projected 7→15/yr by 2055 (HVAC capex compounding) — expect insurance premiums to compound above CPI over the hold.
Questions for the listing agent
- What do current leases actually rent for vs. the listed asking? Can we see a recent rent roll and the last 12 months of T-12 income?
- Built in 1957 — when were the roof, HVAC, electrical panel, plumbing, and water heater last replaced?
- What does the HOA fee cover, when was the last increase, and are there any pending special assessments or reserve-fund shortfalls?
- Any open or pending special assessments — roof, HVAC, plumbing, elevator, façade? What's the per-unit balance and payoff schedule, and is the seller paying it off at close or rolling it to the buyer?
- Is there a deadline driving the sale (1031 exchange, divorce, estate, relocation)? That informs how much negotiation room exists.
- Schools are B-rated — typically a magnet for longer-tenancy family renters. What's the average tenant stay here, and is there a school-zone premium baked into asking?
- Crime grade is F in this area — have there been break-ins, vandalism, or insurance claims at this property in the last 3 years? What carrier currently insures it and at what premium?
- The area grade is low — what's the realistic commute time and amenity access for the typical tenant pool here? Any planned neighborhood developments (good or bad) we should know about?
- What's the average days-on-market for RENTAL listings here right now (not sales)? A rising rental-DOM trend means longer vacancies and softer asking-rent achievability than the comps imply.
- What's the recent tenant-quality profile in this submarket — average credit score on applications, eviction rate, late-payment / NSF rate, and stable-employment percentage? A property-management company in the area should have these aggregated.
- How much new apartment / multifamily construction is in the pipeline within 1–3 miles? Heavy new supply (>2% of stock underway) typically softens rents 12–24 months out; light construction supports rent growth.
Investment metrics
- 1% rule
- 1.25% ✓
- Cap rate
- 2.94%
- Cash-on-cash
- -11.99%
- DSCR
- 0.47
- GRM
- 6.6
CMA / ARV
No comps found within radius.
Projected returns pro-forma
5.79% appreciation · 8.0% rent growth · sell at horizon
- IRR
- 8.6%
- Equity multiple
- 1.60×
- Total profit
- $75,701
- Equity at exit
- $276,991
- IRR
- 13.3%
- Equity multiple
- 3.89×
- Total profit
- $364,259
- Equity at exit
- $497,296
Cash invested: $126,000 (down + closing). Projections, not guarantees.
Landlord ↔ Tenant lean methodology
- Overall (CITY)
- 0 Strongly Tenant-Friendly
- State New York
- 15 Strongly Tenant-Friendly · D+10
- County
- — inherits STATE
- City New York
- 0 Strongly Tenant-Friendly · D+34
ZIP-level market 10065
- Home prices YoY
- 3.1%
- Rents YoY
- 11.6%
- Active inventory
- 344
- Price-to-rent
- 6.6×
Monthly cashflow live
- Estimated rent
- $5,639 high interval (Pro) →
- Mortgage (P&I)
- −$2,360
- Tax est. 1.5%
- −$562 /mo · $6,750/yr
- Insurance
- −$188
- HOA est. from 1 same-building comp
- −$2,604
- Vacancy / Maint / Mgmt
- −$1,184
- Net cashflow
- $-1,259
Break-even live
Sensitivity live
| Price | -10% $-948 | -5% $-1,103 | +0% $-1,259 | +5% $-1,414 | +10% $-1,570 |
|---|---|---|---|---|---|
| Rent | -10% $-1,704 | -5% $-1,481 | +0% $-1,259 | +5% $-1,036 | +10% $-813 |
| Rate | -1.0pp $-1,032 | -0.5pp $-1,144 | base $-1,259 | +0.5pp $-1,375 | +1.0pp $-1,494 |
UW: 25.0% down · 7.5% · 30yr · 1.5% tax · 5.0% vac · 8.0% maint · 8.0% mgmt
Financing live
Cash to close
- Down payment
- $112,500
- Closing costs
- $13,500
- Reserves months
- —
- Total cash needed
- —
Loan-product check · same deal, 3 products live
Conventional
25% down · 7.5% · 30yr
- Down + closing
- —
- Monthly P&I
- —
- Monthly cashflow
- —
- DSCR
- —
- Eligible?
- —
Personal DTI + credit; lowest rate.
DSCR
20% down · 8.5% · 30yr
- Down + closing
- —
- Monthly P&I
- —
- Monthly cashflow
- —
- DSCR
- —
- Eligible?
- —
No personal income docs; deal must DSCR.
Hard money
10% down · 12.0% · 12mo
- Down + closing
- —
- Monthly P&I
- —
- Monthly cashflow
- —
- DSCR
- —
- Eligible?
- —
Short-term bridge; refi at stabilization.
Rent comps 40 comps
| Address | Beds | Baths | Sqft | Rent | $/sqft | DOM | Units | Dist |
|---|---|---|---|---|---|---|---|---|
| 403 E 62nd St Unit 14C New York, NY | 1.0 | 1.0 | 650 | $4,900 | $7.54 | 23d | 1 | 0.07mi |
| 360 E 65th St #1283 New York, NY | 1.0–3.0 | 1.0–2.0 | 1059 | $4,840 | $4.57 | 5d | 3 | 0.10mi |
| 400 E 66th St Unit 1016404P New York, NY | 1.0–2.0 | 1.0–2.0 | 791 | $10,597 | $13.40 | 5d | 2 | 0.12mi |
| 301 E 63rd St New York, NY | 2.0 | 1.0 | 975 | $6,650 | $6.82 | 6d | 1 | 0.19mi |
| 304 E 65th St Unit 11C New York, NY | 1.0 | 1.0 | 770 | $5,450 | $7.08 | 17d | 1 | 0.19mi |
| 220 E 65th St New York, NY | 1.0 | 1.0 | 700 | $5,950 | $8.50 | 4d | 1 | 0.25mi |
| 411 E 68th St Unit 1021976P New York, NY | 2.0 | 1.0 | 893 | $6,792 | $7.61 | 23d | 1 | 0.25mi |
| 252 E 61st St #638 New York, NY | 1.0 | 1.0 | 666 | $5,530 | $8.30 | 3d | 2 | 0.26mi |
| 225 E 63rd St #1675 New York, NY | 1.0 | 1.0 | 627 | $5,230 | $8.34 | 26d | 2 | 0.27mi |
| 220 E 63rd St #567 New York, NY | 1.0 | 1.0 | 800 | $6,460 | $8.07 | 22d | 1 | 0.27mi |
| 329 E 58th St #807 New York, NY | 2.0 | 1.0 | 650 | $5,860 | $9.02 | 9d | 1 | 0.28mi |
| 403 E 69th St #1518 New York, NY | 1.0–3.0 | 1.0 | 745 | $3,990 | $5.36 | 26d | 3 | 0.29mi |
| 1290 1st Ave #1499 New York, NY | 2.0 | 1.0 | 671 | $6,100 | $9.09 | 4d | 2 | 0.29mi |
| 300 E 69th St Unit 1294661P New York, NY | 2.0 | 1.0 | 839 | $6,870 | $8.19 | 21d | 1 | 0.32mi |
| 1310 2nd Ave Unit 1224958P New York, NY | 1.0–2.0 | 1.0 | 699 | $5,450 | $7.80 | 3d | 2 | 0.32mi |
| 400 E 57th St #2106 New York, NY | 2.0 | 1.0–2.0 | 903 | $6,610 | $7.32 | 5d | 3 | 0.33mi |
| 885 Main St Unit 6B New York, NY | 2.0 | 2.0 | 950 | $5,300 | $5.58 | 1d | 1 | 0.38mi |
| 885 Main St #705 New York, NY | 2.0 | 2.0 | 1100 | $4,800 | $4.36 | 0d | 1 | 0.38mi |
| 300 E 57th St #1714 New York, NY | 1.0 | 1.0 | 820 | $5,800 | $7.07 | 22d | 1 | 0.38mi |
| 599 E 56th St Unit 1817 New York, NY | 1.0 | 1.0 | 625 | $4,850 | $7.76 | 26d | 1 | 0.39mi |
| 227 E 57th St Unit 14C New York, NY | 1.0 | 1.0 | 780 | $4,750 | $6.09 | 26d | 1 | 0.40mi |
| 412 E 55th St New York, NY | 1.0 | 1.0 | 767 | $5,250 | $6.84 | 26d | 1 | 0.44mi |
| 515 E 72nd St Unit 17D New York, NY | 1.0 | 1.0 | 687 | $5,500 | $8.01 | 26d | 1 | 0.46mi |
| 235 E 55th St Unit 36B New York, NY | 1.0 | 1.0 | 650 | $4,800 | $7.38 | 26d | 1 | 0.48mi |
| 420 E 54th St New York, NY | 3.0 | 1.0–2.5 | 1018 | $7,261 | $7.13 | 0d | 12 | 0.50mi |
| 150 E 57th St New York, NY | 5.0 | 1.0–7.5 | 2750 | $10,504 | $3.82 | 3d | 5 | 0.52mi |
| 1373 1st Ave Unit 1952 New York, NY | 2.0 | 2.0 | 650 | $7,260 | $11.17 | 26d | 1 | 0.52mi |
| 501 E 74th St #1572 New York, NY | 2.0 | 2.0 | 1000 | $10,210 | $10.21 | 22d | 1 | 0.54mi |
| 959 1st Ave Unit 6X New York, NY | 1.0 | 1.0 | 739 | $6,000 | $8.12 | 26d | 1 | 0.55mi |
| 117 E 57th St New York, NY | 1.0 | 1.0 | 732 | $5,975 | $8.16 | 6d | 2 | 0.57mi |
| 333 E 52nd St Unit 2177 New York, NY | 2.0 | 1.0 | 600 | $4,900 | $8.17 | 23d | 1 | 0.57mi |
| 250 E 53rd St #403 New York, NY | 1.0 | 1.0 | 823 | $5,850 | $7.11 | 26d | 1 | 0.58mi |
| 940 1st Ave Unit 2040 New York, NY | 2.0 | 1.5 | 600 | $6,810 | $11.35 | 0d | 1 | 0.59mi |
| 340 E 52nd St #1527 New York, NY | 1.0 | 1.0 | 575 | $7,890 | $13.72 | 1d | 2 | 0.60mi |
| 404 E 76th St New York, NY | 1.0–2.0 | 1.0–2.0 | 1001 | $4,895 | $4.89 | 6d | 2 | 0.61mi |
| 404 E 76th St Unit 19C New York, NY | 2.0 | 2.0 | 1100 | $7,500 | $6.82 | 26d | 1 | 0.63mi |
| 340 E 51st St New York, NY | 2.0 | 1.0–2.0 | 791 | $6,250 | $7.90 | 5d | 3 | 0.65mi |
| 300 E 51st St New York, NY | 2.0 | 1.0–2.0 | 875 | $6,365 | $7.27 | 4d | 3 | 0.65mi |
| 123 E 54th St #1251 New York, NY | 1.0–2.0 | 1.0 | 600 | $5,220 | $8.70 | 1d | 2 | 0.66mi |
| 231 E 76th St #1530 New York, NY | 1.0 | 1.0 | 650 | $6,470 | $9.95 | 22d | 1 | 0.69mi |
HOA detail condo
- Monthly dues
- $0 · $0/yr
- Likely covers
- doorman
- Assessments
- None detected in remarks — confirm with the listing agent.
Listing history 3 events
-
2026-02-13status Pending
-
2026-01-21price $450,000
-
2026-01-21$425,000 Active
ⓘ Source: listings_history table (triggers on properties + properties_extension) + one-shot
backfill from property_details.listing_events for pre-trigger history.
Climate risk First Street
- Flood 1/10 Low FEMA zone X (unshaded) · 0% chance over 30 yrs
- Wildfire 1/10 Low
- Heat 6/10 Major 7 d/yr ≥99°F today · 15 d/yr by 30 yrs out
- Wind 6/10 Major 27% chance of damaging wind over 30 yrs
- Air quality 4/10 Moderate 5 unhealthy d/yr today · 6 by 30 yrs out
Nearby sold comps map
Loading sold comps map…
Walkable amenities ~0.75 mi
Loading nearby amenities…
Taxation est. · year 1
- Rental income
- $67,673
- − Mortgage interest
- −$25,207
- − Property taxes
- −$6,750
- − Insurance
- −$2,250
- − Repairs & maintenance
- −$5,414
- − Management
- −$5,414
- − HOA
- −$31,248
- − Depreciation
- −$13,091
- Taxable loss
- −$21,701
- Est. tax savings @ 24.0%
- +$5,208
- After-tax cash flow
- $-9,897/yr
For passive investors: Depreciation is non-cash, so a rental often shows a tax loss while cash-flowing — sheltering income. Rental losses are passive: they offset passive income freely, and up to $25,000/yr can offset ordinary (W-2) income if you actively participate and your MAGI is under $100k (phasing out to $0 by $150k); unused losses carry forward. On sale, claimed depreciation is recaptured at up to 25%, and gains may owe capital-gains tax (a 1031 exchange can defer both). Figures are a year-1 estimate at your 24.0% rate — not tax advice; consult a CPA.
Schools (NCES district)
No district data.
Livability — New York
- Score
- 75/100
- State rank
- #268
- US rank
- #4188
Category grades
Schools grade is shown separately in the Schools card above.
Census & demographics
- Census place
- New York, NY
- County
- New York County · 1,599,927 people
- City population
- 7,731,280
- Metro
- New York-Newark-Jersey City, NY-NJ-PA
- Population (ZIP)
- 30,808
- Household income
- $155,331
- Rent vs Own
- Severe rent burden
- 2355.0
Population outlook (New York County) Hauer SSP2
- Today (2025)
- 1,825,725 people
- By 2030
- 1,904,611 · +4.3%
- By 2040
- 2,052,719 · +12.4%
- By 2050
- 2,206,601 · +20.9%
- By 2075
- 2,509,427 · +37.4%
- By 2100
- 2,702,933 · +48.0%
Race, ethnicity, and origin ACS 2023
- Neighborhood character
- Predominantly White (71%)
- Race & ethnicity
- White 71% Asian 13% Hispanic / Latino 10% Two or more races 6% Black 2%
- Hispanic origin (detail)
- Mexican 2% Dominican 1% Salvadoran 2%
- Common ancestry
- Scotch-Irish 6% Romanian 5% Lithuanian 3%
- Foreign-born
- 28% · Canada, China, Dominican Republic
- Languages at home
- 70% English-only · Spanish 8% Other Indo-European 6% Other Asian/Pacific 3%
Political lean MEDSL · New York
- 2024 margin
- Solid D (+64.8) · D 82.4% · R 17.6%
- 2008→2024 swing
- -7.4pp toward R · 2008: 72.2pp · 2024: 64.8pp
- All cycles
- 2024: D+64.8 2020: D+74.5 2016: D+77.2 2012: D+69.6 2008: D+72.2
Not yet ingested
- Civics
- —
Market trends
- HPI YoY
- ▲ 5.79%
- Current HPI
- 194.3314
- Rent YoY
- ▲ 11.63%
- Metro
- New York-Newark-Jersey City, NY-NJ-PA
- State GDP YoY
- ▲ 2.60%
- F500 in state
- 92
Industry mix (Fortune 500 HQ in NY)
| Industry | F500 HQs | Revenue |
|---|---|---|
| Financial Services | 10 | $950B |
|
||
| Consumer Goods | 9 | $162B |
|
||
| Insurance | 4 | $225B |
|
||
| Telecommunications | 2 | $144B |
|
||
| Pharmaceuticals | 2 | $112B |
|
||
| Media / Entertainment | 2 | $69B |
|
||
Price history
+5.9% since first listed3 events — show timeline
- 2026-02-13 Pending — OneKey® MLS as Distributed by MLS Grid
- 2026-01-21 Price Changed $450,000 OneKey® MLS as Distributed by MLS Grid
- 2026-01-21 Listed $425,000 OneKey® MLS as Distributed by MLS Grid
Cash-flow waterfall
monthlySold comps — $/sqft
last 12 mo · ≤1 miLoading sold comps…