 Multi-family
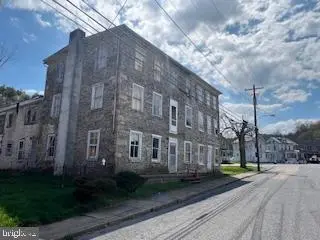
102 Penn St · Lenhartsville, PA
Flood risk 5/10 · Moderate
- FEMA flood zone
- X (unshaded)
- Chance of flooding over 30 yrs
- 0.67%
- Est. flood insurance / yr
- $473 – $860
Fire risk 3/10 · Minor
- Est. fire insurance / yr
- $511 – $949
Heat risk 5/10 · Moderate
- Hot days now (above 98°F)
- 7 days/yr
- Hot days in 30 yrs
- 16 days/yr
Wind risk 4/10 · Minor
- Chance of severe wind over 30 yrs
- 13.0%
Air-quality risk 2/10 · Minimal
- Unhealthy air days now
- 0 days/yr
- Unhealthy air days in 30 yrs
- 1 days/yr
Risk factors via First Street. Map © Google.
Why this score? — see what drove the A- grade
The composite is a weighted blend of 9 inputs, each scored 0–100. Each bar is that input's sub-score; the figure is the points it added to the 100-point composite (weight × sub-score).
- Cash flow +30.0/30.0
- 1% rule +10.0/10.0
- DSCR +10.0/10.0
- Appreciation +10.0/10.0
- ARV discount +7.5/15.0
- Schools +5.0/10.0
- Livability +3.1/5.0
- Rent growth +2.5/5.0
- Condition / age +2.5/5.0
$130,000
🖨 Deal sheet 📄 Offer letter ✓ Due diligence
Multi-family units
County records classify this as Multi-Family (2-4 Unit). Listing-text estimate: 1 unit. estimate disagrees with records
Listing remarks MLS
Investor opportunity with serious upside. This historic stone structure in Lenhartsville offers the kind of character and scale that’s increasingly hard to find—and even harder to replicate. The property has been cleaned out and is ready for renovation, with initial work already underway including stone re-pointing and partial second-floor framing. Interior is down to the studs, allowing for a complete reconfiguration to maximize value. The property experienced a fire in the past, under previous ownership; cleanup has been completed and initial restoration efforts are underway. Ideal for experienced investors, contractors, or restoration buyers looking to capitalize on a high-potential project. Opportunities like this—combining size, structure, and character—are limited. Property is being sold strictly AS IS. Buyer responsible for any and all municipal requirements, inspections, and due diligence. Cash or renovation financing likely required.
Key facts
- Stone re-pointing
- 0.23 acre lot
- Built 1850
Tags
Neighborhood map
What this means for you Summary
Snapshot
- This is a 6-bed/3.0-bath multifamily listed at $130k.
Deal economics
- At list price, monthly cash flow is $2k ($21k/yr) — positive.
- The deal already cash-flows at list — no discount required.
- Meets the 1% rule at list price ($4k rent vs $130k).
- Recommended offer: $122k (6.0% below list) — sets the bar for market timing.
Location & tenants
- Location reads 62/100 on livability (#1,343 in PA) — a middle-class / working-renter tenant base. Strengths: cost of living A+, housing A+; Watch: employment C-, amenities F, commute F.
- Kutztown Area SD (town): math 51% / reading 64% proficiency, ranked #86 of 539 in PA (top 16%) — acceptable for families but not a draw, mixed tenant base, ~2y average lease.
- Market conditions: 9 active listings in the ZIP; 258 units permitted in Berks County in 2024 (27 in 5+ unit buildings).
Forward outlook
- In year one you build about $14k of equity ($899 loan paydown + $13k appreciation (10.0% local appreciation)).
- Berks County population projected at +3% by 2050 — modest demand growth; plan on rents tracking national, not racing it.
- At projected returns (10.0% appreciation + 3.0% rent growth), your $36k cash investment doubles in ~2 years — after that, you're playing with house money.
- By year 3, paydown + projected appreciation supports a ~$35k cash-out refi (75% LTV) — recoverable capital for the next deal without selling this one.
Negotiation context
- It's been on market 63 days — a 6% lower offer ($122k) is reasonable based on typical stale-listing flexibility.
- 4 sale attempts since 2y ago with the ask held roughly flat each time — persistent listings suggest the price (not the market) is what's stuck; bring a comps-based counter.
- Current owner paid $50k; list at $130k implies a 160% gain — meaningful room to come down on a strong offer.
Risks & watch-outs
- Watch-outs: property tax is 3.2% of price; built in 1850 — expect roof / HVAC / electrical / plumbing capex.
- Climate carrying-cost: moderate flood risk; extreme-heat days projected 7→16/yr by 2055 (HVAC capex compounding) — expect insurance premiums to compound above CPI over the hold.
Questions for the listing agent
- It's been on market 63 days. Have you received any prior offers? Is the seller open to a 6% concession, seller financing, or rate buy-down credit?
- Built in 1850 — when were the roof, HVAC, electrical panel, plumbing, and water heater last replaced?
- Property tax is high relative to price — has the assessment been appealed recently, and will the sale trigger a re-assessment?
- Why hasn't it sold? Are there any deal-killer items the seller is aware of (foundation, flood, title, zoning, code violations)?
- Is there a deadline driving the sale (1031 exchange, divorce, estate, relocation)? That informs how much negotiation room exists.
- What's the average days-on-market for RENTAL listings here right now (not sales)? A rising rental-DOM trend means longer vacancies and softer asking-rent achievability than the comps imply.
- What's the recent tenant-quality profile in this submarket — average credit score on applications, eviction rate, late-payment / NSF rate, and stable-employment percentage? A property-management company in the area should have these aggregated.
- How much new apartment / multifamily construction is in the pipeline within 1–3 miles? Heavy new supply (>2% of stock underway) typically softens rents 12–24 months out; light construction supports rent growth.
Investment metrics
- 1% rule
- 2.79% ✓
- Cap rate
- 22.82%
- Cash-on-cash
- 59.02%
- DSCR
- 3.63
- GRM
- 3.0
CMA / ARV
No comps found within radius.
Projected returns pro-forma
10.0% appreciation · 3.0% rent growth · sell at horizon
- IRR
- 71.4%
- Equity multiple
- 6.08×
- Total profit
- $184,999
- Equity at exit
- $117,114
- IRR
- 65.2%
- Equity multiple
- 13.51×
- Total profit
- $455,445
- Equity at exit
- $252,561
Cash invested: $36,400 (down + closing). Projections, not guarantees.
Landlord ↔ Tenant lean methodology
- Overall (STATE)
- 62 Landlord-Friendly
- State Pennsylvania
- 62 Landlord-Friendly · EVEN
- County
- — inherits STATE
- City
- — inherits STATE
ZIP-level market 19534
- Home prices YoY
- 6.1%
- Active inventory
- 9
- Price-to-rent
- 9.0×
Monthly cashflow live
- Estimated rent
- $3,630 medium interval (Pro) →
- Mortgage (P&I)
- −$682
- Tax from tax record
- −$341 /mo · $4,097/yr
- Insurance
- −$54
- HOA
- −$0
- Vacancy / Maint / Mgmt
- −$762
- Net cashflow
- $1,790
Break-even live
3-unit breakdown (identical units grouped — click to expand)
| Units | Beds | Baths | Est. rent |
|---|---|---|---|
| 3× units | 2 | 1 | $3,630 |
| #1 | 2 | 1 | $1,210 |
| #2 | 2 | 1 | $1,210 |
| #3 | 2 | 1 | $1,210 |
| Total (3 units) | $3,630 | ||
UW: 25.0% down · 7.5% · 30yr · 1.5% tax · 5.0% vac · 8.0% maint · 8.0% mgmt
Financing live
Cash to close
- Down payment
- $32,500
- Closing costs
- $3,900
- Reserves months
- —
- Total cash needed
- —
Loan-product check · same deal, 3 products live
Conventional
25% down · 7.5% · 30yr
- Down + closing
- —
- Monthly P&I
- —
- Monthly cashflow
- —
- DSCR
- —
- Eligible?
- —
Personal DTI + credit; lowest rate.
DSCR
20% down · 8.5% · 30yr
- Down + closing
- —
- Monthly P&I
- —
- Monthly cashflow
- —
- DSCR
- —
- Eligible?
- —
No personal income docs; deal must DSCR.
Hard money
10% down · 12.0% · 12mo
- Down + closing
- —
- Monthly P&I
- —
- Monthly cashflow
- —
- DSCR
- —
- Eligible?
- —
Short-term bridge; refi at stabilization.
Listing history 23 events
-
2026-06-18days on market $130,000 Active 63 DOM
-
2026-06-17days on market $130,000 Active 62 DOM
-
2026-06-16days on market $130,000 Active 61 DOM
-
2026-06-15days on market $130,000 Active 60 DOM
-
2026-06-14days on market $130,000 Active 58 DOM
-
2026-06-13days on market $130,000 Active 57 DOM
-
2026-06-10days on market $130,000 Active 55 DOM
-
2026-06-09days on market $130,000 Active 54 DOM
-
2026-06-08days on market $130,000 Active 53 DOM
-
2026-06-07days on market $130,000 Active 52 DOM
-
2026-06-03days on market $130,000 Active 48 DOM
-
2026-06-02days on market $130,000 Active 47 DOM
-
2026-06-01days on market $130,000 Active 46 DOM
-
2026-05-31days on market $130,000 Active 45 DOM
-
2026-05-31days on market $130,000 Active 44 DOM
-
2026-04-16$130,000 Active 980-char remark
Show marketing remark (980 chars)
Investor opportunity with serious upside. This historic stone structure in Lenhartsville offers the kind of character and scale that’s increasingly hard to find—and even harder to replicate. The property has been cleaned out and is ready for renovation, with initial work already underway including stone re-pointing and partial second-floor framing. Interior is down to the studs, allowing for a complete reconfiguration to maximize value. The property experienced a fire in the past, under previous ownership; cleanup has been completed and initial restoration efforts are underway. Ideal for experienced investors, contractors, or restoration buyers looking to capitalize on a high-potential project. Opportunities like this—combining size, structure, and character—are limited. Property is being sold strictly AS IS. Buyer responsible for any and all municipal requirements, inspections, and due diligence. Cash or renovation financing likely required.
-
2025-02-28soldstatus $50,000 Sold
-
2025-02-28soldstatus $50,000 Closed
-
2025-02-13status Pending
-
2025-02-13status Pending
-
2024-12-12$98,500 Active
-
2024-12-12$98,500 Active
ⓘ Source: listings_history table (triggers on properties + properties_extension) + one-shot
backfill from property_details.listing_events for pre-trigger history.
Tax reassessment forecast PA · Partial reset (capped growth)
- Current annual tax
- $4,097 · $341/mo
- Projected year-2 tax
- $4,097 · $341/mo
- Expected delta
- $0/yr ($0/mo · 0.0%)
ⓘ Screening estimate from a state-policy table — verify with the county assessor before closing.
Climate risk First Street
- Flood 5/10 Major FEMA zone X (unshaded) · 67% chance over 30 yrs
- Wildfire 3/10 Moderate
- Heat 5/10 Major 7 d/yr ≥98°F today · 16 d/yr by 30 yrs out
- Wind 4/10 Moderate 13% chance of damaging wind over 30 yrs
- Air quality 2/10 Low 0 unhealthy d/yr today · 1 by 30 yrs out
Nearby sold comps map
Loading sold comps map…
Walkable amenities ~0.75 mi
Loading nearby amenities…
Taxation est. · year 1
- Rental income
- $43,560
- − Mortgage interest
- −$7,282
- − Property taxes
- −$4,097
- − Insurance
- −$650
- − Repairs & maintenance
- −$3,485
- − Management
- −$3,485
- − Depreciation
- −$3,782
- Taxable income
- $20,780
- Est. tax owed @ 24.0%
- −$4,987
- After-tax cash flow
- $16,498/yr
For passive investors: Depreciation is non-cash, so a rental often shows a tax loss while cash-flowing — sheltering income. Rental losses are passive: they offset passive income freely, and up to $25,000/yr can offset ordinary (W-2) income if you actively participate and your MAGI is under $100k (phasing out to $0 by $150k); unused losses carry forward. On sale, claimed depreciation is recaptured at up to 25%, and gains may owe capital-gains tax (a 1031 exchange can defer both). Figures are a year-1 estimate at your 24.0% rate — not tax advice; consult a CPA.
Schools (NCES district)
- District
- Kutztown Area SD
- NCES district ID
- 4212930
- Math proficiency
- 51% ▼ -4.00%
- Reading proficiency
- 64% ▼ -8.00%
- Median HH income
- $56,887
- Composite
- 49.61/100
- National rank
- #1982
- State rank
- #86 of 539 in PA
Livability — Lenhartsville
- Score
- 62/100
- State rank
- #1343
- US rank
- #16663
Category grades
Schools grade is shown separately in the Schools card above.
Census & demographics
- Census place
- Lenhartsville, PA
- Population (ZIP)
- 1,983
Population outlook (Berks County) Hauer SSP2
- Today (2025)
- 425,767 people
- By 2030
- 428,814 · +0.7%
- By 2040
- 433,463 · +1.8%
- By 2050
- 439,426 · +3.2%
- By 2075
- 478,647 · +12.4%
- By 2100
- 518,507 · +21.8%
Race, ethnicity, and origin ACS 2023
- Neighborhood character
- Predominantly White (88%)
- Race & ethnicity
- White 88% Two or more races 7% Hispanic / Latino 4%
- Common ancestry
- Romanian 8% Polish 6% Iranian 4%
- Foreign-born
- 3% · Canada
- Languages at home
- 94% English-only · Spanish 3% Russian/Polish/Slavic 2% German/W. Germanic 1%
Political lean MEDSL · Berks
- 2024 margin
- R (+12.2) · D 43.4% · R 55.6%
- 2008→2024 swing
- -21.4pp toward R · 2008: 9.2pp · 2024: -12.2pp
- All cycles
- 2024: R+12.2 2020: R+8.2 2016: R+10.2 2012: R+0.6 2008: D+9.2
Not yet ingested
- Civics
- —
Market trends
- HPI YoY
- ▲ 17.13%
- Current HPI
- 296.8656
- Rent YoY
- —
- Metro
- —
- State GDP YoY
- ▲ 1.68%
- F500 in state
- 34
Industry mix (Fortune 500 HQ in PA)
| Industry | F500 HQs | Revenue |
|---|---|---|
| Healthcare | 2 | $309B |
|
||
| Insurance | 2 | $27B |
|
||
| Telecommunications / Media | 1 | $124B |
|
||
| Industrial Distribution | 1 | $22B |
|
||
| Financial Services | 1 | $20B |
|
||
| Chemicals / Materials | 1 | $18B |
|
||
Price history
+32.0% since first listed8 events — show timeline
- 2026-04-16 Listed $130,000 GLVRMLS
- 2026-04-16 Listed $130,000 BRIGHT MLS
- 2025-02-28 Sold (MLS) $50,000 BRIGHT MLS
- 2025-02-28 Sold (MLS) $50,000 GLVRMLS
- 2025-02-13 Pending — GLVRMLS
- 2025-02-13 Pending — BRIGHT MLS
- 2024-12-12 Listed $98,500 BRIGHT MLS
- 2024-12-12 Listed $98,500 GLVRMLS
Property tax history
+0.9%/yrLatest (2026): $4,097 · +1.2% YoY. Source: county tax records.
Cash-flow waterfall
monthlySold comps — $/sqft
last 12 mo · ≤1 miLoading sold comps…