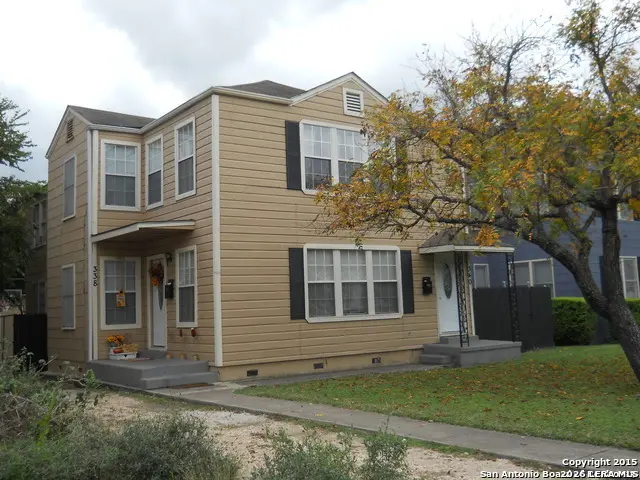
338 Donaldson · San Antonio, TX
Flood risk 1/10 · Minimal
- FEMA flood zone
- X (unshaded)
- Chance of flooding over 30 yrs
- 0.0%
- Est. flood insurance / yr
- $507 – $1,088
Fire risk 1/10 · Minimal
- Est. fire insurance / yr
- $1,222 – $2,270
Heat risk 8/10 · Major
- Hot days now (above 108°F)
- 7 days/yr
- Hot days in 30 yrs
- 22 days/yr
Wind risk 6/10 · Moderate
- Chance of severe wind over 30 yrs
- 77.0%
Air-quality risk 2/10 · Minimal
- Unhealthy air days now
- 1 days/yr
- Unhealthy air days in 30 yrs
- 1 days/yr
Risk factors via First Street. Map © Google.
Why this score? — see what drove the C- grade
The composite is a weighted blend of 9 inputs, each scored 0–100. Each bar is that input's sub-score; the figure is the points it added to the 100-point composite (weight × sub-score).
- Cash flow +18.9/30.0
- 1% rule +7.9/10.0
- ARV discount +7.5/15.0
- DSCR +6.0/10.0
- Livability +4.0/5.0
- Rent growth +3.2/5.0
- Condition / age +2.5/5.0
- Schools +1.4/10.0
- Appreciation +0.0/10.0
$150,000
🖨 Deal sheet 📄 Offer letter ✓ Due diligence
Listing remarks MLS
Opportunity awaits in the historic Monticello Park District! This duplex is ideally located near Downtown San Antonio, the Pearl District, and major universities. With strong income potential, this diamond in the rough is perfect for investors or buyers looking to renovate and build equity. Schedule your showing today!
Key facts
- Major universities
- Near pearl district
- 8,015 sq ft lot
Tags
Neighborhood map
What this means for you Summary
Snapshot
- This is a 4-bed/2.0-bath single-family listed at $150k.
Deal economics
- At list price, monthly cash flow is $155 ($2k/yr) — positive.
- The deal already cash-flows at list — no discount required.
- Meets the 1% rule at list price ($2k rent vs $150k).
- Recommended offer: $141k (6.0% below list) — sets the bar for market timing.
- Cap rate 7.5% vs local median 3.8% in San Antonio — top-decile yield for the area; either an underpriced asset or a hidden risk that comps aren't pricing in. Stress-test before assuming the spread holds.
Location & tenants
- Location reads 80/100 on livability (#31 in TX, #1,616 nationally) — a professional / high-income tenant draw. Strengths: amenities A+, commute A+, cost of living A+; Watch: schools C-, crime F.
- San Antonio ISD (urban): math 12% / reading 22% proficiency, ranked #805 of 826 in TX (top 98%) — low school quality limits family demand, transient renter base, plan for 1-2y turnover; 80% free/reduced lunch — lower-income household profile, screen leases tightly.
- Market conditions: Rents rising (+2.8%/yr); 172 active listings in the ZIP; 14 comparable units currently listed for rent nearby; rentals at typical pace (median 22d on market — plan ~3-4 weeks tenant-placement turnaround); 8,308 units permitted in Bexar County in 2024 (2,506 in 5+ unit buildings).
- At $1,938/mo this rent would consume 49% of the median local household income ($47k/yr) (locally 2332% of renters already pay >50% of income on rent) — very limited rent-growth headroom before tenants either downsize or default.
Forward outlook
- Local home prices are declining (-3.0%/yr); year-one equity from $1k of loan paydown is wiped out by about $4k of value loss. Plan a longer hold.
- Bexar County population projected at +50% by 2050 — long-run rental-demand tailwind backs the buy-and-hold thesis.
Negotiation context
- It's been on market 89 days — a 6% lower offer ($141k) is reasonable based on typical stale-listing flexibility.
- 4 sale attempts since 11y ago; this cycle's ask has dropped $100k (40%) from the opening price — seller is motivated, your offer sets the floor, not the list.
Risks & watch-outs
- Watch-outs: property tax is 4.2% of price; built in 1936 — expect roof / HVAC / electrical / plumbing capex.
- Climate carrying-cost: major wind risk, 77% chance of damaging wind over 30y; extreme-heat days projected 7→22/yr by 2055 (HVAC capex compounding) — expect insurance premiums to compound above CPI over the hold.
Questions for the listing agent
- It's been on market 89 days. Have you received any prior offers? Is the seller open to a 6% concession, seller financing, or rate buy-down credit?
- Built in 1936 — when were the roof, HVAC, electrical panel, plumbing, and water heater last replaced?
- Property tax is high relative to price — has the assessment been appealed recently, and will the sale trigger a re-assessment?
- Why hasn't it sold? Are there any deal-killer items the seller is aware of (foundation, flood, title, zoning, code violations)?
- Is there a deadline driving the sale (1031 exchange, divorce, estate, relocation)? That informs how much negotiation room exists.
- Crime grade is F in this area — have there been break-ins, vandalism, or insurance claims at this property in the last 3 years? What carrier currently insures it and at what premium?
- What's the average days-on-market for RENTAL listings here right now (not sales)? A rising rental-DOM trend means longer vacancies and softer asking-rent achievability than the comps imply.
- What's the recent tenant-quality profile in this submarket — average credit score on applications, eviction rate, late-payment / NSF rate, and stable-employment percentage? A property-management company in the area should have these aggregated.
- How much new for-sale + rental construction is in the pipeline within 1–3 miles? Heavy new supply typically softens prices + rents 12–24 months out; constrained supply supports both.
Investment metrics
- 1% rule
- 1.29% ✓
- Cap rate
- 7.53%
- Cash-on-cash
- 4.43%
- DSCR
- 1.20
- GRM
- 6.4
CMA / ARV
- ARV (median comp)
- $327,618
- List price
- $150,000
- Delta
- -54.22%
- Verdict
- UNDERPRICED
- Comps
- 20 within 1.0 mi
Show comp detail 12 sales within ~0.75 mi
| Address | Dist | Beds/Ba | Sqft | Sold | Price | $/sf | Match |
|---|---|---|---|---|---|---|---|
| 207 Mary Louise Dr | 0.18mi | 3/2.0 (-1) | 2,337 (+2%) | 8mo | $299,000 | $128 | 75 |
| 268 North Dr | 0.43mi | 4/2.5 | 2,339 (+3%) | 1mo | $350,000 | $150 | 72 |
| 567 Donaldson | 0.35mi | 3/2.5 (-1) | 2,353 (+3%) | 0mo | $399,000 | $170 | 71 |
| 2106 W Gramercy Pl | 0.22mi | 3/2.5 (-1) | 2,181 (-4%) | 11mo | $496,000 | $227 | 66 |
| 359 Club | 0.41mi | 4/2.0 | 2,404 (+5%) | 13mo | $365,000 | $152 | 61 |
| 2046 W Mulberry Ave | 0.34mi | 3/2.0 (-1) | 2,458 (+8%) | 6mo | $420,000 | $171 | 61 |
| 2334 W Gramercy | 0.59mi | 3/2.0 (-1) | 2,358 (+3%) | 2mo | $259,000 | $110 | 60 |
| 2334 W Huisache | 0.69mi | 4/2.0 | 2,302 (+1%) | 11mo | $385,000 | $167 | 57 |
| 1939 W French Pl | 0.72mi | 3/2.5 (-1) | 2,237 (-2%) | 4mo | $449,000 | $201 | 53 |
| 314 Quentin Dr | 0.54mi | 3/2.0 (-1) | 2,549 (+12%) | 10mo | $695,000 | $273 | 42 |
| 424 Club | 0.48mi | 5/4.0 (+1) | 2,622 (+15%) | 1mo | $499,000 | $190 | 38 |
| 2407 W Kings Hwy | 0.75mi | 3/1.0 (-1) | 1,984 (-13%) | 8mo | $275,000 | $139 | 28 |
Match score weights: distance 35% · size 25% · config 20% · recency 20%. Top-matched comps best support the ARV.
Projected returns pro-forma
-3.0% appreciation · 2.82% rent growth · sell at horizon
- IRR
- -9.5%
- Equity multiple
- 0.65×
- Total profit
- $-14,550
- Equity at exit
- $22,365
- IRR
- -0.1%
- Equity multiple
- 0.99×
- Total profit
- $-428
- Equity at exit
- $12,969
Cash invested: $42,000 (down + closing). Projections, not guarantees.
Landlord ↔ Tenant lean methodology
- Overall (STATE)
- 87 Strongly Landlord-Friendly
- State Texas
- 87 Strongly Landlord-Friendly · R+5
- County
- — inherits STATE
- City
- — inherits STATE
ZIP-level market 78201
- Home prices YoY
- -28.4%
- Rents YoY
- 2.8%
- Active inventory
- 172
- Price-to-rent
- 6.4×
Monthly cashflow live
- Estimated rent
- $1,938 high interval (Pro) →
- Mortgage (P&I)
- −$787
- Tax from tax record
- −$527 /mo · $6,327/yr
- Insurance
- −$62
- HOA
- −$0
- Vacancy / Maint / Mgmt
- −$407
- Net cashflow
- $155
Break-even live
UW: 25.0% down · 7.5% · 30yr · 1.5% tax · 5.0% vac · 8.0% maint · 8.0% mgmt
Financing live
Cash to close
- Down payment
- $37,500
- Closing costs
- $4,500
- Reserves months
- —
- Total cash needed
- —
Loan-product check · same deal, 3 products live
Conventional
25% down · 7.5% · 30yr
- Down + closing
- —
- Monthly P&I
- —
- Monthly cashflow
- —
- DSCR
- —
- Eligible?
- —
Personal DTI + credit; lowest rate.
DSCR
20% down · 8.5% · 30yr
- Down + closing
- —
- Monthly P&I
- —
- Monthly cashflow
- —
- DSCR
- —
- Eligible?
- —
No personal income docs; deal must DSCR.
Hard money
10% down · 12.0% · 12mo
- Down + closing
- —
- Monthly P&I
- —
- Monthly cashflow
- —
- DSCR
- —
- Eligible?
- —
Short-term bridge; refi at stabilization.
Rent comps 14 comps
| Address | Beds | Baths | Sqft | Rent | $/sqft | DOM | Units | Dist |
|---|---|---|---|---|---|---|---|---|
| 254 Quentin Dr San Antonio, TX | 3.0 | 1.5 | 2025 | $2,000 | $0.99 | 24d | 1 | 0.47mi |
| 415 North Dr San Antonio, TX | 4.0 | 2.0 | 1795 | $1,600 | $0.89 | 20d | 1 | 0.66mi |
| 2231 W Woodlawn Ave San Antonio, TX | 3.0 | 2.0 | 1744 | $1,900 | $1.09 | 24d | 1 | 0.69mi |
| 405 Quentin Dr San Antonio, TX | 4.0 | 3.0 | 2085 | $2,100 | $1.01 | 24d | 1 | 0.71mi |
| 155 N Josephine Tobin Dr San Antonio, TX | 4.0 | 3.0 | 1782 | $1,900 | $1.07 | 15d | 1 | 0.72mi |
| 1621 W French Pl San Antonio, TX | 3.0 | 3.0 | 1764 | $1,895 | $1.07 | 44d | 1 | 0.91mi |
| 155 S Josephine Tobin Dr San Antonio, TX | 3.0 | 2.5 | 1782 | $1,900 | $1.07 | 22d | 1 | 0.93mi |
| 1031 W Gramercy Pl San Antonio, TX | 3.0 | 2.0 | 1576 | $2,195 | $1.39 | 12d | 1 | 1.08mi |
| 2622 W Summit Ave San Antonio, TX | 3.0 | 2.0 | 2100 | $1,950 | $0.93 | 3d | 1 | 1.15mi |
| 944 Fulton Ave San Antonio, TX | 3.0 | 2.0 | 1732 | $2,650 | $1.53 | 18d | 1 | 1.16mi |
| 931 W Gramercy Pl San Antonio, TX | 3.0 | 2.0 | 1755 | $2,295 | $1.31 | 24d | 1 | 1.21mi |
| 114 Pardo Cir San Antonio, TX | 4.0 | 3.0 | 2271 | $1,800 | $0.79 | 24d | 1 | 1.38mi |
| 1615 N Navidad St Unit 101 San Antonio, TX | 3.0 | 2.0 | 1804 | $999 | $0.55 | 4d | 1 | 1.39mi |
| 801 W Mulberry Ave San Antonio, TX | 3.0 | 3.0 | 2206 | $2,800 | $1.27 | 3d | 1 | 1.45mi |
Listing history 22 events
-
2026-06-13pricestatusdays on market $150,000 Pending 89 DOM
-
2026-06-09days on market $175,000 Active Option 88 DOM
-
2026-06-08days on market $175,000 Active Option 87 DOM
-
2026-06-07pricestatusdays on market $175,000 Active Option 86 DOM
-
2026-06-04days on market $225,000 Active 83 DOM
-
2026-06-03days on market $225,000 Active 82 DOM
-
2026-06-02days on market $225,000 Active 81 DOM
-
2026-06-01days on market $225,000 Active 80 DOM
-
2026-05-31days on market $225,000 Active 79 DOM
-
2026-04-18price $225,000 320-char remark
Show marketing remark (320 chars)
Opportunity awaits in the historic Monticello Park District! This duplex is ideally located near Downtown San Antonio, the Pearl District, and major universities. With strong income potential, this diamond in the rough is perfect for investors or buyers looking to renovate and build equity. Schedule your showing today!
-
2026-03-25status Back on Market 320-char remark
Show marketing remark (320 chars)
Opportunity awaits in the historic Monticello Park District! This duplex is ideally located near Downtown San Antonio, the Pearl District, and major universities. With strong income potential, this diamond in the rough is perfect for investors or buyers looking to renovate and build equity. Schedule your showing today!
-
2026-03-21historical Active Option 320-char remark
Show marketing remark (320 chars)
Opportunity awaits in the historic Monticello Park District! This duplex is ideally located near Downtown San Antonio, the Pearl District, and major universities. With strong income potential, this diamond in the rough is perfect for investors or buyers looking to renovate and build equity. Schedule your showing today!
-
2026-03-13$250,000 New 320-char remark
Show marketing remark (320 chars)
Opportunity awaits in the historic Monticello Park District! This duplex is ideally located near Downtown San Antonio, the Pearl District, and major universities. With strong income potential, this diamond in the rough is perfect for investors or buyers looking to renovate and build equity. Schedule your showing today!
-
2018-06-02historical
-
2018-05-28price $229,000
-
2018-05-24price $230,000
-
2018-05-02$240,000 New
-
2016-05-11soldstatus
-
2016-04-14soldstatus Sold
-
2016-03-30status Pending
-
2016-03-09historical Active Option
-
2015-11-07$200,000 New
ⓘ Source: listings_history table (triggers on properties + properties_extension) + one-shot
backfill from property_details.listing_events for pre-trigger history.
Tax reassessment forecast TX · Resets to sale price
- Current annual tax
- $6,327 · $527/mo
- Projected year-2 tax
- $6,327 · $527/mo
- Expected delta
- $0/yr ($0/mo · 0.0%)
ⓘ Screening estimate from a state-policy table — verify with the county assessor before closing.
Climate risk First Street
- Flood 1/10 Low FEMA zone X (unshaded) · 0% chance over 30 yrs
- Wildfire 1/10 Low
- Heat 8/10 Severe 7 d/yr ≥108°F today · 22 d/yr by 30 yrs out
- Wind 6/10 Major 77% chance of damaging wind over 30 yrs
- Air quality 2/10 Low 1 unhealthy d/yr today · 1 by 30 yrs out
Nearby sold comps map
Loading sold comps map…
Walkable amenities ~0.75 mi
Loading nearby amenities…
Taxation est. · year 1
- Rental income
- $23,260
- − Mortgage interest
- −$8,402
- − Property taxes
- −$6,327
- − Insurance
- −$750
- − Repairs & maintenance
- −$1,861
- − Management
- −$1,861
- − Depreciation
- −$4,364
- Taxable loss
- −$304
- Est. tax savings @ 24.0%
- +$73
- After-tax cash flow
- $1,932/yr
For passive investors: Depreciation is non-cash, so a rental often shows a tax loss while cash-flowing — sheltering income. Rental losses are passive: they offset passive income freely, and up to $25,000/yr can offset ordinary (W-2) income if you actively participate and your MAGI is under $100k (phasing out to $0 by $150k); unused losses carry forward. On sale, claimed depreciation is recaptured at up to 25%, and gains may owe capital-gains tax (a 1031 exchange can defer both). Figures are a year-1 estimate at your 24.0% rate — not tax advice; consult a CPA.
Schools (NCES district)
- District
- San Antonio ISD
- NCES district ID
- 4838730
- Math proficiency
- 12% ▼ -21.00%
- Reading proficiency
- 22% ▼ -7.00%
- Median HH income
- $30,952
- Composite
- 13.57/100
- National rank
- #9512
- State rank
- #805 of 826 in TX
Livability — San Antonio
- Score
- 80/100
- State rank
- #31
- US rank
- #1616
Category grades
Schools grade is shown separately in the Schools card above.
Census & demographics
- Census place
- San Antonio, TX
- County
- Bexar County · 1,990,555 people
- City population
- 1,806,925
- Metro
- San Antonio-New Braunfels, TX
- Population (ZIP)
- 41,981
- Household income
- $47,121
- Rent vs Own
- Severe rent burden
- 2332.0
Population outlook (Bexar County) Hauer SSP2
- Today (2025)
- 2,336,851 people
- By 2030
- 2,560,728 · +9.6%
- By 2040
- 3,020,569 · +29.3%
- By 2050
- 3,493,522 · +49.5%
- By 2075
- 4,668,459 · +99.8%
- By 2100
- 5,533,242 · +136.8%
Race, ethnicity, and origin ACS 2023
- Neighborhood character
- Predominantly Hispanic (83%)
- Race & ethnicity
- Hispanic / Latino 83% Two or more races 51% White 13% Black 2% Native American 1%
- Hispanic origin (detail)
- Mexican 71%
- Common ancestry
- Arab 1% Lithuanian 1% Slovak 1%
- Foreign-born
- 22% · Canada
- Languages at home
- 43% English-only · Spanish 54% Arabic 1%
Political lean MEDSL · Bexar
- 2024 margin
- Lean D (+9.8) · D 54.3% · R 44.6% · Other 1.1%
- 2008→2024 swing
- +4.2pp toward D · 2008: 5.6pp · 2024: 9.8pp
- All cycles
- 2024: D+9.8 2020: D+18.2 2016: D+13.5 2012: D+4.6 2008: D+5.6
Not yet ingested
- Civics
- —
Market trends
- HPI YoY
- ▼ -103.07%
- Current HPI
- 259.9918
- Rent YoY
- ▲ 2.82%
- Metro
- San Antonio-New Braunfels, TX
- State GDP YoY
- ▲ 3.95%
- F500 in state
- 110
Industry mix (Fortune 500 HQ in TX)
| Industry | F500 HQs | Revenue |
|---|---|---|
| Energy | 16 | $1,198B |
|
||
| Technology | 5 | $198B |
|
||
| Engineering / Construction | 4 | $72B |
|
||
| Energy Services | 3 | $60B |
|
||
| Utilities | 3 | $41B |
|
||
| Healthcare | 2 | $330B |
|
||
Price history
+12.5% since first listed13 events — show timeline
- 2026-04-18 Price Changed $225,000 LERA
- 2026-03-25 Relisted — LERA
- 2026-03-21 Contingent — LERA
- 2026-03-13 Listed $250,000 LERA
- 2018-06-02 Listing Removed — LERA
- 2018-05-28 Price Changed $229,000 LERA
- 2018-05-24 Price Changed $230,000 LERA
- 2018-05-02 Listed $240,000 LERA
- 2016-05-11 Sold (Public Records) — Public Records
- 2016-04-14 Sold (MLS) — LERA
- 2016-03-30 Pending — LERA
- 2016-03-09 Contingent — LERA
- 2015-11-07 Listed $200,000 LERA
Property tax history
+5.8%/yrLatest (2025): $6,327 · -1.3% YoY. Source: county tax records.
Cash-flow waterfall
monthlySold comps — $/sqft
last 12 mo · ≤1 miLoading sold comps…