1075 Lowe Rd · Reeltown, AL
Flood risk 1/10 · Minimal
- FEMA flood zone
- X (unshaded)
- Chance of flooding over 30 yrs
- 0.0%
- Est. flood insurance / yr
- $507 – $1,088
Fire risk 5/10 · Moderate
- Est. fire insurance / yr
- $916 – $1,700
Heat risk 6/10 · Moderate
- Hot days now (above 106°F)
- 6 days/yr
- Hot days in 30 yrs
- 17 days/yr
Wind risk 8/10 · Major
- Chance of severe wind over 30 yrs
- 80.0%
Air-quality risk 2/10 · Minimal
- Unhealthy air days now
- 2 days/yr
- Unhealthy air days in 30 yrs
- 2 days/yr
Risk factors via First Street. Map © Google.
Why this score? — see what drove the D grade
The composite is a weighted blend of 9 inputs, each scored 0–100. Each bar is that input's sub-score; the figure is the points it added to the 100-point composite (weight × sub-score).
- Cash flow +12.9/30.0
- ARV discount +7.5/15.0
- Appreciation +5.4/10.0
- DSCR +3.8/10.0
- 1% rule +3.6/10.0
- Livability +2.8/5.0
- Rent growth +2.5/5.0
- Condition / age +2.5/5.0
- Schools +2.1/10.0
$130,000
🖨 Deal sheet 📄 Offer letter ✓ Due diligence
Listing remarks
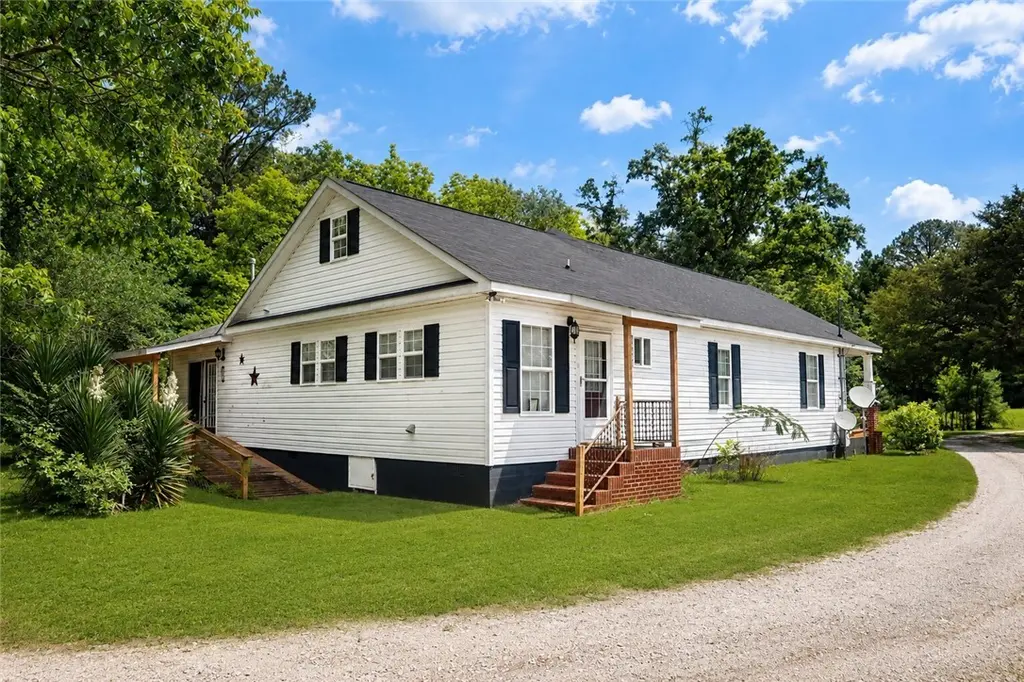
Built in 1925 and full of timeless character, this charming farmhouse-style home sits on approximately 3.3 private acres surrounded by mature trees and peaceful outdoor space. Featuring classic Southern curb appeal, the home welcomes you with a spacious covered front porch, white siding, black shutters, and brick column accents. The long gravel driveway and expansive yard create a quiet country feel with plenty of room to enjoy the outdoors. Blending vintage charm with a bright, well-kept appearance, this property offers the perfect mix of comfort and privacy while still being conveniently located to nearby amenities. Cash and conventional financing required.
Key facts
- 3.33 acre lot
- Built 1925
- Listed 6 days
Property features AI
Finance
- Other: Directions: Take AL-81 N / Notasulga Rd toward Notasulga. Continue about 11 miles, turn onto Lowe Rd and continue to 1075 Lowe Rd on the right.
- HOA & community: No association amenities
Exterior
- Parking: Other/see remarks for parking details
- Utilities: Natural gas available; Propane; Septic tank
- Home design: One-story residential home; 1 level; Aluminum and vinyl siding
- Construction: Aluminum siding; Vinyl siding
- Exterior features: Front porch; Lot of about 3.33 acres
Interior
- Kitchen: Gas range
- Bathrooms: 2 full bathrooms
- Heating & cooling: Central air; Ceiling fan(s); Gas cooling; Natural gas heating; Propane heating
- Interior features: Ceiling fan(s); Gas range
- Laundry & utility: Washer hookup
Neighborhood map
What this means for you Summary
Snapshot
- This is a 3-bed/2.0-bath single-family listed at $130k.
Deal economics
- At list price, monthly cash flow is $-11 ($-128/yr) — negative.
- To cash-flow at today's rent, offer at most $128k (1.2% below list).
- To meet the 1% rule (rent ≥ 1% of price), the offer needs to be $112k (13.6% below list).
- Recommended offer: $112k (13.6% below list) — sets the bar for 1% rule.
Location & tenants
- Location reads 55/100 on livability (#430 in AL) — a working-class tenant base; expect higher turnover. Strengths: cost of living A+; Watch: commute C-, housing C-, crime F.
- Tallapoosa County (rural): math 15% / reading 35% proficiency, ranked #93 of 129 in AL (top 72%) — low school quality limits family demand, transient renter base, plan for 1-2y turnover.
- Zoned schools: Reeltown Elementary School (math 24% / reading 44%, grade F, #311 of 627 statewide, top 50%, 515 students, 67% FRL).
- Market conditions: 21 active listings in the ZIP; 218 units permitted in Tallapoosa County in 2024 (0 in 5+ unit buildings).
Forward outlook
- In year one you build about $2k of equity ($899 loan paydown + $1k appreciation (0.8% local appreciation)).
- Tallapoosa County population projected at -22% by 2050 — secular population decline; favor cash flow + early exit over multi-decade hold.
Negotiation context
- Only 6 days on market — expect competitive offers; lowballing is unlikely to land.
Risks & watch-outs
- Watch-outs: built in 1925 — expect roof / HVAC / electrical / plumbing capex.
- Climate carrying-cost: severe wind risk, 80% chance of damaging wind over 30y; moderate wildfire risk; extreme-heat days projected 6→17/yr by 2055 (HVAC capex compounding) — expect insurance premiums to compound above CPI over the hold.
Questions for the listing agent
- What do current leases actually rent for vs. the listed asking? Can we see a recent rent roll and the last 12 months of T-12 income?
- Built in 1925 — when were the roof, HVAC, electrical panel, plumbing, and water heater last replaced?
- Is there a deadline driving the sale (1031 exchange, divorce, estate, relocation)? That informs how much negotiation room exists.
- Schools are D-rated, which usually means shorter tenancies and higher turnover. Who's the typical renter profile here, and what's been the actual vacancy rate?
- Crime grade is F in this area — have there been break-ins, vandalism, or insurance claims at this property in the last 3 years? What carrier currently insures it and at what premium?
- The area grade is low — what's the realistic commute time and amenity access for the typical tenant pool here? Any planned neighborhood developments (good or bad) we should know about?
- What's the average days-on-market for RENTAL listings here right now (not sales)? A rising rental-DOM trend means longer vacancies and softer asking-rent achievability than the comps imply.
- What's the recent tenant-quality profile in this submarket — average credit score on applications, eviction rate, late-payment / NSF rate, and stable-employment percentage? A property-management company in the area should have these aggregated.
- How much new for-sale + rental construction is in the pipeline within 1–3 miles? Heavy new supply typically softens prices + rents 12–24 months out; constrained supply supports both.
Investment metrics
- 1% rule
- 0.86% ✗
- Cap rate
- 6.19%
- Cash-on-cash
- -0.35%
- DSCR
- 0.98
- GRM
- 9.6
CMA / ARV
No comps found within radius.
Projected returns pro-forma
0.85% appreciation · 3.0% rent growth · sell at horizon
- IRR
- 0.4%
- Equity multiple
- 1.02×
- Total profit
- $802
- Equity at exit
- $43,350
- IRR
- 5.3%
- Equity multiple
- 1.64×
- Total profit
- $23,122
- Equity at exit
- $56,821
Cash invested: $36,400 (down + closing). Projections, not guarantees.
Landlord ↔ Tenant lean methodology
- Overall (STATE)
- 90 Strongly Landlord-Friendly
- State Alabama
- 90 Strongly Landlord-Friendly · R+15
- County
- — inherits STATE
- City
- — inherits STATE
ZIP-level market 36866
- Home prices YoY
- 0.5%
- Active inventory
- 21
- Price-to-rent
- 9.6×
Monthly cashflow live
- Estimated rent
- $1,124 medium interval (Pro) →
- Mortgage (P&I)
- −$682
- Tax est. 1.5%
- −$162 /mo · $1,950/yr
- Insurance
- −$54
- HOA
- −$0
- Vacancy / Maint / Mgmt
- −$236
- Net cashflow
- $-11
Break-even live
UW: 25.0% down · 7.5% · 30yr · 1.5% tax · 5.0% vac · 8.0% maint · 8.0% mgmt
Financing live
Cash to close
- Down payment
- $32,500
- Closing costs
- $3,900
- Reserves months
- —
- Total cash needed
- —
Loan-product check · same deal, 3 products live
Conventional
25% down · 7.5% · 30yr
- Down + closing
- —
- Monthly P&I
- —
- Monthly cashflow
- —
- DSCR
- —
- Eligible?
- —
Personal DTI + credit; lowest rate.
DSCR
20% down · 8.5% · 30yr
- Down + closing
- —
- Monthly P&I
- —
- Monthly cashflow
- —
- DSCR
- —
- Eligible?
- —
No personal income docs; deal must DSCR.
Hard money
10% down · 12.0% · 12mo
- Down + closing
- —
- Monthly P&I
- —
- Monthly cashflow
- —
- DSCR
- —
- Eligible?
- —
Short-term bridge; refi at stabilization.
Listing history 2 events
-
2026-05-13status Pending
-
2026-05-07$130,000 Active
ⓘ Source: listings_history table (triggers on properties + properties_extension) + one-shot
backfill from property_details.listing_events for pre-trigger history.
Climate risk First Street
- Flood 1/10 Low FEMA zone X (unshaded) · 0% chance over 30 yrs
- Wildfire 5/10 Major
- Heat 6/10 Major 6 d/yr ≥106°F today · 17 d/yr by 30 yrs out
- Wind 8/10 Severe 80% chance of damaging wind over 30 yrs
- Air quality 2/10 Low 2 unhealthy d/yr today · 2 by 30 yrs out
Nearby sold comps map
Loading sold comps map…
Walkable amenities ~0.75 mi
Loading nearby amenities…
Taxation est. · year 1
- Rental income
- $13,485
- − Mortgage interest
- −$7,282
- − Property taxes
- −$1,950
- − Insurance
- −$650
- − Repairs & maintenance
- −$1,079
- − Management
- −$1,079
- − Depreciation
- −$3,782
- Taxable loss
- −$2,337
- Est. tax savings @ 24.0%
- +$561
- After-tax cash flow
- $433/yr
For passive investors: Depreciation is non-cash, so a rental often shows a tax loss while cash-flowing — sheltering income. Rental losses are passive: they offset passive income freely, and up to $25,000/yr can offset ordinary (W-2) income if you actively participate and your MAGI is under $100k (phasing out to $0 by $150k); unused losses carry forward. On sale, claimed depreciation is recaptured at up to 25%, and gains may owe capital-gains tax (a 1031 exchange can defer both). Figures are a year-1 estimate at your 24.0% rate — not tax advice; consult a CPA.
Schools (NCES district)
- District
- Tallapoosa County
- NCES district ID
- 0103210
- Math proficiency
- 15% ▼ -23.00%
- Reading proficiency
- 35% ▼ -3.00%
- Median HH income
- $42,013
- Composite
- 21.22/100
- National rank
- #8407
- State rank
- #93 of 129 in AL
Livability — Reeltown
- Score
- 55/100
- State rank
- #430
- US rank
- #23197
Category grades
Schools grade is shown separately in the Schools card above.
Census & demographics
- Census place
- Reeltown, AL
- Population (ZIP)
- 3,540
Population outlook (Tallapoosa County) Hauer SSP2
- Today (2025)
- 38,909 people
- By 2030
- 37,413 · -3.8%
- By 2040
- 33,935 · -12.8%
- By 2050
- 30,467 · -21.7%
- By 2075
- 22,716 · -41.6%
- By 2100
- 15,167 · -61.0%
Race, ethnicity, and origin ACS 2023
- Neighborhood character
- Majority White (60%)
- Race & ethnicity
- White 60% Black 35% Two or more races 4% Hispanic / Latino 2%
- Common ancestry
- Italian 1% Hispanic 1%
- Foreign-born
- 1% · Canada
- Languages at home
- 91% English-only · Spanish 9%
Political lean MEDSL · Tallapoosa
- 2024 margin
- Solid R (+49.6) · D 24.9% · R 74.5%
- 2008→2024 swing
- -13.1pp toward R · 2008: -36.5pp · 2024: -49.6pp
- All cycles
- 2024: R+49.6 2020: R+43.4 2016: R+41.6 2012: R+32.4 2008: R+36.5
Not yet ingested
- Civics
- —
Market trends
- HPI YoY
- ▲ 0.85%
- Current HPI
- 164.729
- Rent YoY
- —
- Metro
- —
- State GDP YoY
- ▲ 2.94%
- F500 in state
- 4
Industry mix (Fortune 500 HQ in AL)
| Industry | F500 HQs | Revenue |
|---|---|---|
| Financial Services | 1 | $8B |
|
||
| Healthcare | 1 | $5B |
|
||
Price history
2 events — show timeline
- 2026-05-13 Pending — LCMLS
- 2026-05-07 Listed $130,000 LCMLS
Property tax history
-4.7%/yrLatest (2025): $221 · +1.7% YoY. Source: county tax records.
Cash-flow waterfall
monthlySold comps — $/sqft
last 12 mo · ≤1 miLoading sold comps…