 🔨 Auction
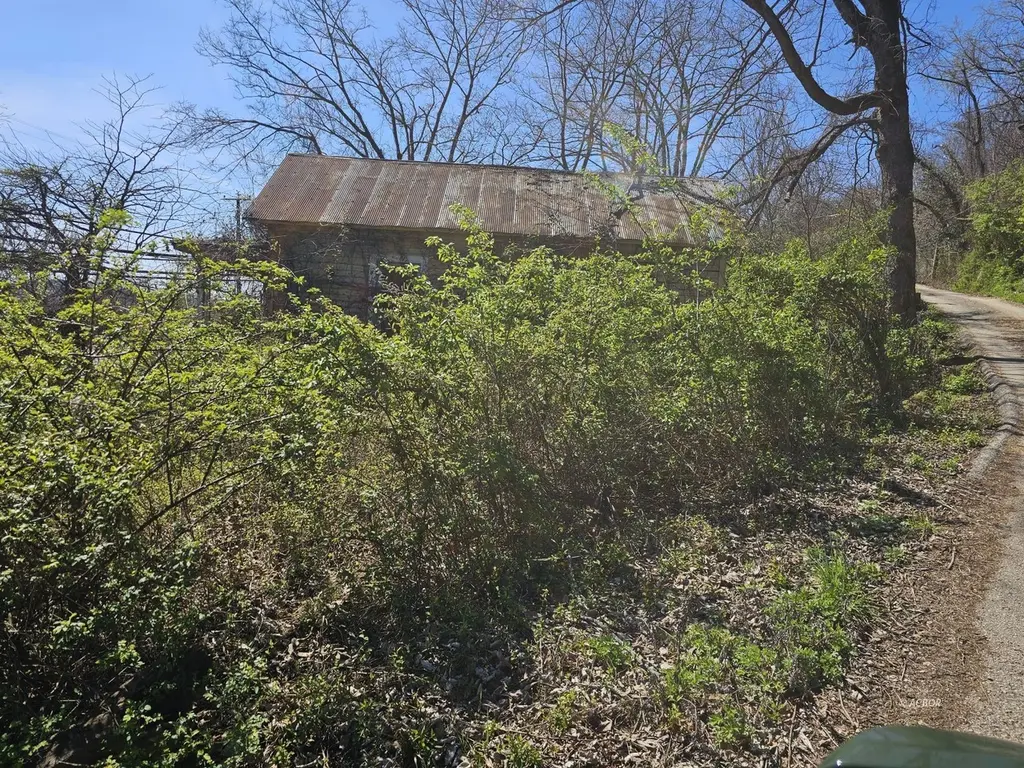
514 Rockwood Ave · Chesapeake, OH
Flood risk 8/10 · Major
- FEMA flood zone
- X (shaded)
- Chance of flooding over 30 yrs
- 0.78%
- Est. flood insurance / yr
- $507 – $1,088
Fire risk 3/10 · Minor
- Est. fire insurance / yr
- $713 – $1,323
Heat risk 4/10 · Minor
- Hot days now (above 103°F)
- 7 days/yr
- Hot days in 30 yrs
- 18 days/yr
Wind risk 2/10 · Minimal
- Chance of severe wind over 30 yrs
- 1.0%
Air-quality risk 2/10 · Minimal
- Unhealthy air days now
- 0 days/yr
- Unhealthy air days in 30 yrs
- 1 days/yr
Risk factors via First Street. Map © Google.
Why this score? — see what drove the F grade
The composite is a weighted blend of 9 inputs, each scored 0–100. Each bar is that input's sub-score; the figure is the points it added to the 100-point composite (weight × sub-score).
- ARV discount +7.5/15.0
- Cash flow +6.3/30.0
- Livability +4.3/5.0
- Schools +4.1/10.0
- Rent growth +2.5/5.0
- Condition / age +2.5/5.0
- 1% rule +1.5/10.0
- DSCR +0.6/10.0
- Appreciation +0.0/10.0
$27,612
🖨 Deal sheet 📄 Offer letter ✓ Due diligence
Listing remarks MLS
Court Ordered Sale by Private Selling Officer. Online Auction ends on May 28, 2026. All information we have on the property is included. We have no additional information, property condition is unknown. NO SHOWINGS, NO trespassing for any reason. Information is thought to be correct but not guaranteed. 10% Buyer Premium added to the high bid, $5,000 deposit is due within 24 hours of bidding end.
Key facts
- 0.63 acre lot
- Built 1906
- Listed 64 days
Neighborhood map
What this means for you Summary
Snapshot
- This is a 1-bed/1.0-bath single-family listed at $28k.
Deal economics
- At list price, monthly cash flow is $-294 ($-4k/yr) — negative.
- The deal already cash-flows at list — no discount required.
- Meets the 1% rule at list price ($826 rent vs $28k).
- Recommended offer: $26k (6.0% below list) — sets the bar for market timing.
Location & tenants
- Location reads 86/100 on livability (#39 in OH, #392 nationally) — a professional / high-income tenant draw. Strengths: crime A+, amenities A+, commute A+; Watch: employment C-.
- Chesapeake Union Exempted Village (suburban): math 40% / reading 57% proficiency, ranked #461 of 656 in OH (top 70%) — families likely to look elsewhere, expect single-tenant / working-renter base with shorter leases.
- Market conditions: 32 active listings in the ZIP; 4 comparable units currently listed for rent nearby; rentals lingering (median 44d on market — plan ~5-8 weeks vacancy on turnover, expect pricing pressure); 100% of comp listings sitting > 30 days — soft ceiling on asking rent; 18 units permitted in Lawrence County in 2024 (0 in 5+ unit buildings).
- This rent is only 17% of the median local income ($58k/yr) — well below the 30% rent-burden line; pricing power to push rent on renewal without tenant pushback.
Forward outlook
- Local home prices are declining (-3.0%/yr); year-one equity from $880 of loan paydown is wiped out by about $4k of value loss. Plan a longer hold.
- Lawrence County population projected at -22% by 2050 — secular population decline; favor cash flow + early exit over multi-decade hold.
Negotiation context
- It's been on market 65 days — a 6% lower offer ($26k) is reasonable based on typical stale-listing flexibility.
- Current owner paid $8k; list at $28k implies a 245% gain — meaningful room to come down on a strong offer.
Risks & watch-outs
- Watch-outs: property tax is 6.9% of price; flood insurance adds $66/mo; built in 1906 — expect roof / HVAC / electrical / plumbing capex.
- Climate carrying-cost: severe flood risk — expect insurance premiums to compound above CPI over the hold.
Questions for the listing agent
- What do current leases actually rent for vs. the listed asking? Can we see a recent rent roll and the last 12 months of T-12 income?
- It's been on market 65 days. Have you received any prior offers? Is the seller open to a 6% concession, seller financing, or rate buy-down credit?
- Built in 1906 — when were the roof, HVAC, electrical panel, plumbing, and water heater last replaced?
- Property tax is high relative to price — has the assessment been appealed recently, and will the sale trigger a re-assessment?
- What's the actual annual flood-insurance premium (NFIP or private), and is the property in a SFHA with mandatory coverage?
- Why hasn't it sold? Are there any deal-killer items the seller is aware of (foundation, flood, title, zoning, code violations)?
- Is there a deadline driving the sale (1031 exchange, divorce, estate, relocation)? That informs how much negotiation room exists.
- The area grade is low — what's the realistic commute time and amenity access for the typical tenant pool here? Any planned neighborhood developments (good or bad) we should know about?
- What's the average days-on-market for RENTAL listings here right now (not sales)? A rising rental-DOM trend means longer vacancies and softer asking-rent achievability than the comps imply.
- What's the recent tenant-quality profile in this submarket — average credit score on applications, eviction rate, late-payment / NSF rate, and stable-employment percentage? A property-management company in the area should have these aggregated.
- How much new for-sale + rental construction is in the pipeline within 1–3 miles? Heavy new supply typically softens prices + rents 12–24 months out; constrained supply supports both.
Investment metrics
- 1% rule
- 0.65% ✗
- Cap rate
- 4.15%
- Cash-on-cash
- -7.65%
- DSCR
- 0.66
- GRM
- 12.8
CMA / ARV
- ARV (median comp)
- $127,275
- List price
- $27,612
- Delta
- -78.31%
- Verdict
- UNDERPRICED
- Comps
- 6 within 1.0 mi
Projected returns pro-forma
-3.0% appreciation · 3.0% rent growth · sell at horizon
- IRR
- -34.0%
- Equity multiple
- -0.10×
- Total profit
- $-39,276
- Equity at exit
- $18,977
- IRR
- -42.3%
- Equity multiple
- -0.63×
- Total profit
- $-58,070
- Equity at exit
- $11,004
Cash invested: $35,637 (down + closing). Projections, not guarantees.
Landlord ↔ Tenant lean methodology
- Overall (STATE)
- 73 Landlord-Friendly
- State Ohio
- 73 Landlord-Friendly · R+6
- County
- — inherits STATE
- City
- — inherits STATE
ZIP-level market 45619
- Home prices YoY
- -10.6%
- Active inventory
- 32
- Price-to-rent
- 2.8×
Monthly cashflow live
- Estimated rent
- $826 medium interval (Pro) →
- Mortgage (P&I)
- −$667
- Tax est. 1.5%
- −$159 /mo · $1,909/yr
- Insurance
- −$53
- Flood insurance flood zone
- −$66 /mo · $798/yr
- HOA
- −$0
- Vacancy / Maint / Mgmt
- −$173
- Net cashflow
- $-294
Break-even live
UW: 25.0% down · 7.5% · 30yr · 1.5% tax · 5.0% vac · 8.0% maint · 8.0% mgmt
Financing live
Cash to close
- Down payment
- $31,819
- Closing costs
- $3,818
- Reserves months
- —
- Total cash needed
- —
Loan-product check · same deal, 3 products live
Conventional
25% down · 7.5% · 30yr
- Down + closing
- —
- Monthly P&I
- —
- Monthly cashflow
- —
- DSCR
- —
- Eligible?
- —
Personal DTI + credit; lowest rate.
DSCR
20% down · 8.5% · 30yr
- Down + closing
- —
- Monthly P&I
- —
- Monthly cashflow
- —
- DSCR
- —
- Eligible?
- —
No personal income docs; deal must DSCR.
Hard money
10% down · 12.0% · 12mo
- Down + closing
- —
- Monthly P&I
- —
- Monthly cashflow
- —
- DSCR
- —
- Eligible?
- —
Short-term bridge; refi at stabilization.
Rent comps 4 comps
| Address | Beds | Baths | Sqft | Rent | $/sqft | DOM | Units | Dist |
|---|---|---|---|---|---|---|---|---|
| 1739 6th Ave Huntington, WV | 1.0–2.0 | 1.0 | 825 | $755 | $0.92 | 43d | 1 | 0.98mi |
| 605 9th St Huntington, WV | 1.0 | 1.0 | 672 | $838 | $1.25 | 43d | 1 | 1.03mi |
| 2435 1st Ave Unit 1 Huntington, WV | 1.0 | 1.0 | 600 | $795 | $1.32 | 43d | 1 | 1.16mi |
| 2489 1st Ave Unit 101 A Huntington, WV | 1.0 | 1.0 | 750 | $925 | $1.23 | 43d | 1 | 1.27mi |
Listing history 17 events
-
2026-06-19days on market $27,612 Active 65 DOM
-
2026-06-18days on market $27,612 Active 64 DOM
-
2026-06-17days on market $27,612 Active 63 DOM
-
2026-06-16days on market $27,612 Active 62 DOM
-
2026-06-15days on market $27,612 Active 61 DOM
-
2026-06-14days on market $27,612 Active 59 DOM
-
2026-06-12days on market $27,612 Active 58 DOM
-
2026-06-09days on market $27,612 Active 55 DOM
-
2026-06-08days on market $27,612 Active 54 DOM
-
2026-06-07days on market $27,612 Active 53 DOM
-
2026-06-05days on market $27,612 Active 50 DOM
-
2026-06-02days on market $27,612 Active 48 DOM
-
2026-06-01days on market $27,612 Active 47 DOM
-
2026-05-31days on market $27,612 Active 46 DOM
-
2026-05-30days on market $27,612 Active 45 DOM
-
2026-04-16$27,612 Active 398-char remark
Show marketing remark (398 chars)
Court Ordered Sale by Private Selling Officer. Online Auction ends on May 28, 2026. All information we have on the property is included. We have no additional information, property condition is unknown. NO SHOWINGS, NO trespassing for any reason. Information is thought to be correct but not guaranteed. 10% Buyer Premium added to the high bid, $5,000 deposit is due within 24 hours of bidding end.
-
2003-03-12soldstatus $8,000
ⓘ Source: listings_history table (triggers on properties + properties_extension) + one-shot
backfill from property_details.listing_events for pre-trigger history.
Tax reassessment forecast OH · Partial reset (capped growth)
- Current annual tax
- $250 · $21/mo
- Projected year-2 tax
- $340 · $28/mo
- Expected delta
- +$90/yr (+$8/mo · 36.2%)
ⓘ Screening estimate from a state-policy table — verify with the county assessor before closing.
Climate risk First Street
- Flood 8/10 Severe FEMA zone X (shaded) · 78% chance over 30 yrs
- Wildfire 3/10 Moderate
- Heat 4/10 Moderate 7 d/yr ≥103°F today · 18 d/yr by 30 yrs out
- Wind 2/10 Low 100% chance of damaging wind over 30 yrs
- Air quality 2/10 Low 0 unhealthy d/yr today · 1 by 30 yrs out
Nearby sold comps map
Loading sold comps map…
Walkable amenities ~0.75 mi
Loading nearby amenities…
Taxation est. · year 1
- Rental income
- $9,909
- − Mortgage interest
- −$7,129
- − Property taxes
- −$1,909
- − Insurance
- −$1,434
- − Repairs & maintenance
- −$793
- − Management
- −$793
- − Depreciation
- −$3,703
- Taxable loss
- −$5,851
- Est. tax savings @ 24.0%
- +$1,404
- After-tax cash flow
- $-2,120/yr
For passive investors: Depreciation is non-cash, so a rental often shows a tax loss while cash-flowing — sheltering income. Rental losses are passive: they offset passive income freely, and up to $25,000/yr can offset ordinary (W-2) income if you actively participate and your MAGI is under $100k (phasing out to $0 by $150k); unused losses carry forward. On sale, claimed depreciation is recaptured at up to 25%, and gains may owe capital-gains tax (a 1031 exchange can defer both). Figures are a year-1 estimate at your 24.0% rate — not tax advice; consult a CPA.
Schools (NCES district)
- District
- Chesapeake Union Exempted Village
- NCES district ID
- 3904529
- Math proficiency
- 40% ▼ -22.00%
- Reading proficiency
- 57% ▼ -12.00%
- Median HH income
- $46,731
- Composite
- 41.16/100
- National rank
- #3553
- State rank
- #461 of 656 in OH
Livability — Chesapeake
- Score
- 86/100
- State rank
- #39
- US rank
- #392
Category grades
Schools grade is shown separately in the Schools card above.
Census & demographics
- County
- Lawrence · 57,020 people
- Metro
- Huntington-Ashland, WV-KY-OH
- Population (ZIP)
- 7,273
- Household income
- $57,525
- Rent vs Own
- Severe rent burden
- 17.4
Population outlook (Lawrence County) Hauer SSP2
- Today (2025)
- 57,915 people
- By 2030
- 55,650 · -3.9%
- By 2040
- 50,523 · -12.8%
- By 2050
- 45,103 · -22.1%
- By 2075
- 32,441 · -44.0%
- By 2100
- 21,754 · -62.4%
Race, ethnicity, and origin ACS 2023
- Neighborhood character
- Predominantly White (95%)
- Race & ethnicity
- White 95% Two or more races 3% Black 2%
- Common ancestry
- Slovak 3% Serbian 2% Italian 2%
- Foreign-born
- 1%
- Languages at home
- 98% English-only · French/Haitian/Cajun 1%
Political lean MEDSL · Lawrence
- 2024 margin
- Solid R (+50.5) · D 24.4% · R 74.9%
- 2008→2024 swing
- -35.2pp toward R · 2008: -15.3pp · 2024: -50.5pp
- All cycles
- 2024: R+50.5 2020: R+45.6 2016: R+43.9 2012: R+15.5 2008: R+15.3
Not yet ingested
- Civics
- —
Market trends
- HPI YoY
- ▼ -20.15%
- Current HPI
- 170.5086
- Rent YoY
- —
- Metro
- —
- State GDP YoY
- ▲ 1.98%
- F500 in state
- 48
Industry mix (Fortune 500 HQ in OH)
| Industry | F500 HQs | Revenue |
|---|---|---|
| Insurance | 3 | $145B |
|
||
| Industrial Machinery | 3 | $49B |
|
||
| Financial Services | 3 | $24B |
|
||
| Consumer Goods | 2 | $93B |
|
||
| Aerospace / Defense | 2 | $47B |
|
||
| Utilities | 2 | $33B |
|
||
Price history
+245.1% since first listed2 events — show timeline
- 2026-04-16 Listed $27,612 ACBOR
- 2003-03-12 Sold (Public Records) $8,000 Public Records
Property tax history
-4.1%/yrLatest (2024): $250 · -0.8% YoY. Source: county tax records.
Cash-flow waterfall
monthlySold comps — $/sqft
last 12 mo · ≤1 miLoading sold comps…