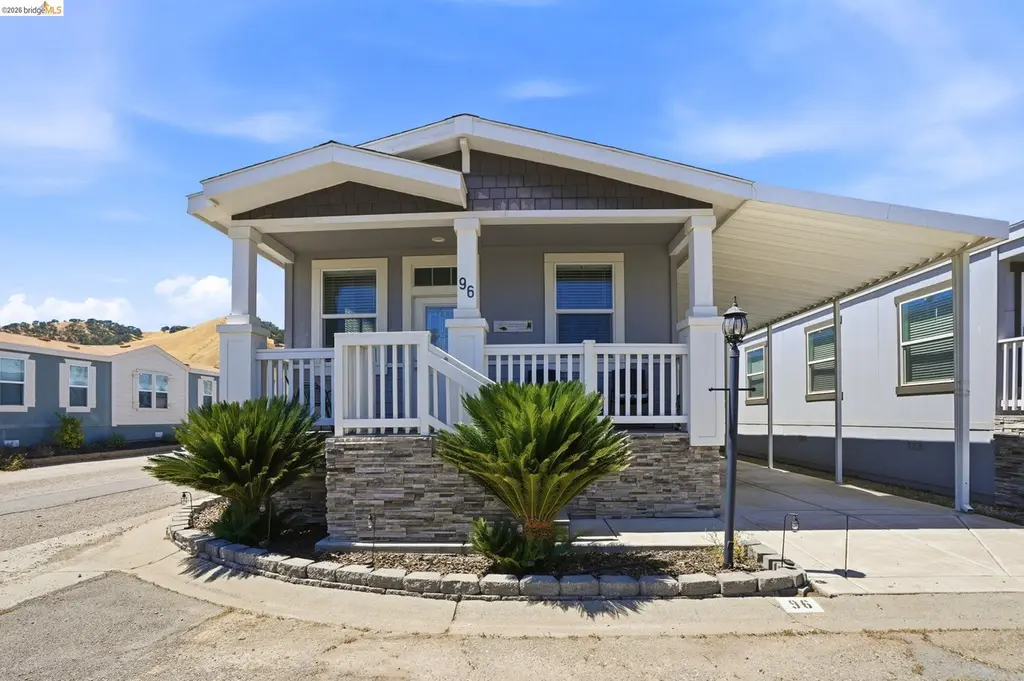
16711 Marsh Creek Rd #96 · Antioch, CA
Flood risk 8/10 · Major
- FEMA flood zone
- X (unshaded)
- Chance of flooding over 30 yrs
- 0.99%
- Est. flood insurance / yr
- $507 – $1,088
Fire risk 9/10 · Severe
- Est. fire insurance / yr
- $659 – $1,223
Heat risk 5/10 · Moderate
- Hot days now (above 97°F)
- 7 days/yr
- Hot days in 30 yrs
- 15 days/yr
Wind risk 1/10 · Minimal
- Chance of severe wind over 30 yrs
- —
Air-quality risk 9/10 · Severe
- Unhealthy air days now
- 17 days/yr
- Unhealthy air days in 30 yrs
- 18 days/yr
Risk factors via First Street. Map © Google.
Why this score? — see what drove the B grade
The composite is a weighted blend of 9 inputs, each scored 0–100. Each bar is that input's sub-score; the figure is the points it added to the 100-point composite (weight × sub-score).
- Cash flow +30.0/30.0
- DSCR +10.0/10.0
- 1% rule +9.5/10.0
- ARV discount +7.5/15.0
- Schools +5.3/10.0
- Livability +2.8/5.0
- Rent growth +2.5/5.0
- Condition / age +2.5/5.0
- Appreciation +0.0/10.0
$189,000
🖨 Deal sheet (PDF) 📄 Offer letter ✓ Due diligence
Listing remarks
Welcome to Clayton Palms—an all-ages community set among the beautiful rolling hills of Marsh Creek Road. This refreshed 2-bedroom, 2-bath manufactured home features brand-new carpet, complemented by luxury vinyl plank flooring for a clean, modern look. The light and bright layout offers comfortable living spaces with a warm, neutral color palette that feels instantly inviting. Enjoy a kitchen with attractive cabinets, tons of storage, and a living area designed for easy everyday living, along with two well-appointed bathrooms and cozy bedroom retreats. Large windows bring in plenty of natural light, enhancing the home’s airy feel. A large shed and spacious covered carport compl
Key facts
- Natural light
- Community pool
- Built 2018
Tags
Property features AI
Finance
- HOA & community: Pets allowed: cats and dogs; Community amenities include clubhouse, fitness center, pool, playground, BBQ area, game room, rec room with fireplace, laundry, park, picnic area, RV parking/storage and activities
Exterior
- Parking: Carport for 2 or more vehicles
- Utilities: Public water; Public sewer; 220V in kitchen / electric
- Home design: Manufactured in park (mobile home); Double wide (Golden Pacific model); Faces east
- Construction: Wood siding
- Exterior features: Corner lot; Community pool; Community clubhouse; Fitness center; Playground; BBQ area; Exercise court; Game room; Laundry facility (community); Park and picnic area; Recreation room with fireplace; RV parking and RV storage
Interior
- Kitchen: Dishwasher; Gas range / cooktop; Free-standing range; Microwave; Disposal; Refrigerator; 220V outlet; Solid surface countertops
- Bedrooms: 2 bedrooms (street level)
- Flooring: Laminate; Carpet
- Bathrooms: 2 full bathrooms; Shower over tub; Stall shower
- Heating & cooling: Forced air heating; Central air conditioning; Ceiling fans
- Interior features: Solid surface counters; Dining area; Window coverings; Updated bathrooms
- Laundry & utility: Laundry room with washer and dryer; 220V outlet
Neighborhood map
What this means for you Summary
Snapshot
- This is a 2-bed/2.0-bath other listed at $189k.
Deal economics
- At list price, monthly cash flow is $975 ($12k/yr) — positive.
- The deal already cash-flows at list — no discount required.
- Meets the 1% rule at list price ($3k rent vs $189k).
- Recommended offer: $186k (1.5% below list) — sets the bar for market timing.
- Cap rate 12.9% vs local median 3.9% in Antioch — top-decile yield for the area; either an underpriced asset or a hidden risk that comps aren't pricing in. Stress-test before assuming the spread holds.
Location & tenants
- Location reads 56/100 on livability (#782 in CA) — a working-class tenant base; expect higher turnover. Strengths: employment A+, housing A+, health & safety A; Watch: schools F, crime F, amenities F.
- Brentwood Union Elementary (suburban): math 51% / reading 59% proficiency, ranked #268 of 1,400 in CA (top 19%) — acceptable for families but not a draw, mixed tenant base, ~2y average lease.
- Market conditions: 60 active listings in the ZIP; 2,169 units permitted in Contra Costa County in 2024 (896 in 5+ unit buildings).
Forward outlook
- Local home prices are declining (-3.0%/yr); year-one equity from $1k of loan paydown is wiped out by about $6k of value loss. Plan a longer hold.
- Contra Costa County population projected at +26% by 2050 — long-run rental-demand tailwind backs the buy-and-hold thesis.
- At projected returns (-3.0% appreciation + 3.0% rent growth), your $53k cash investment doubles in ~6 years — after that, you're playing with house money.
Negotiation context
- It's been on market 18 days — a 2% lower offer ($186k) is reasonable based on typical stale-listing flexibility.
Risks & watch-outs
- Watch-outs: flood insurance adds $66/mo.
- Climate carrying-cost: severe flood risk; severe wildfire risk; extreme-heat days projected 7→15/yr by 2055 (HVAC capex compounding) — expect insurance premiums to compound above CPI over the hold.
Questions for the listing agent
- What's the actual annual flood-insurance premium (NFIP or private), and is the property in a SFHA with mandatory coverage?
- Is there a deadline driving the sale (1031 exchange, divorce, estate, relocation)? That informs how much negotiation room exists.
- Schools are F-rated, which usually means shorter tenancies and higher turnover. Who's the typical renter profile here, and what's been the actual vacancy rate?
- Crime grade is F in this area — have there been break-ins, vandalism, or insurance claims at this property in the last 3 years? What carrier currently insures it and at what premium?
- What's the average days-on-market for RENTAL listings here right now (not sales)? A rising rental-DOM trend means longer vacancies and softer asking-rent achievability than the comps imply.
- What's the recent tenant-quality profile in this submarket — average credit score on applications, eviction rate, late-payment / NSF rate, and stable-employment percentage? A property-management company in the area should have these aggregated.
- How much new for-sale + rental construction is in the pipeline within 1–3 miles? Heavy new supply typically softens prices + rents 12–24 months out; constrained supply supports both.
Investment metrics
- 1% rule
- 1.45% ✓
- Cap rate
- 12.90%
- Cash-on-cash
- 23.61%
- DSCR
- 2.05
- GRM
- 5.8
CMA / ARV
No comps found within radius.
Projected returns pro-forma
-3.0% appreciation · 3.0% rent growth · sell at horizon
- IRR
- 14.8%
- Equity multiple
- 1.59×
- Total profit
- $31,417
- Equity at exit
- $28,181
- IRR
- 23.5%
- Equity multiple
- 3.02×
- Total profit
- $107,154
- Equity at exit
- $16,341
Cash invested: $52,920 (down + closing). Projections, not guarantees.
Landlord ↔ Tenant lean methodology
- Overall (STATE)
- 18 Strongly Tenant-Friendly
- State California
- 18 Strongly Tenant-Friendly · D+13
- County
- — inherits STATE
- City
- — inherits STATE
ZIP-level market 94517
- Active inventory
- 60
- Price-to-rent
- 5.8×
Monthly cashflow live
- Estimated rent
- $2,732 medium interval (Pro) →
- Mortgage (P&I)
- −$991
- Tax from tax record
- −$48 /mo · $571/yr
- Insurance
- −$79
- Flood insurance flood zone
- −$66 /mo · $798/yr
- HOA
- −$0
- Vacancy / Maint / Mgmt
- −$574
- Net cashflow
- $975
Break-even live
Sensitivity live
| Price | -10% $1,082 | -5% $1,028 | +0% $975 | +5% $921 | +10% $868 |
|---|---|---|---|---|---|
| Rent | -10% $759 | -5% $867 | +0% $975 | +5% $1,083 | +10% $1,191 |
| Rate | -1.0pp $1,070 | -0.5pp $1,023 | base $975 | +0.5pp $926 | +1.0pp $876 |
UW: 25.0% down · 7.5% · 30yr · 1.5% tax · 5.0% vac · 8.0% maint · 8.0% mgmt
Financing live
Cash to close
- Down payment
- $47,250
- Closing costs
- $5,670
- Reserves months
- —
- Total cash needed
- —
Loan-product check · same deal, 3 products live
Conventional
25% down · 7.5% · 30yr
- Down + closing
- —
- Monthly P&I
- —
- Monthly cashflow
- —
- DSCR
- —
- Eligible?
- —
Personal DTI + credit; lowest rate.
DSCR
20% down · 8.5% · 30yr
- Down + closing
- —
- Monthly P&I
- —
- Monthly cashflow
- —
- DSCR
- —
- Eligible?
- —
No personal income docs; deal must DSCR.
Hard money
10% down · 12.0% · 12mo
- Down + closing
- —
- Monthly P&I
- —
- Monthly cashflow
- —
- DSCR
- —
- Eligible?
- —
Short-term bridge; refi at stabilization.
Listing history 12 events
-
2026-06-21days on market $189,000 Active 18 DOM
-
2026-06-18days on market $189,000 Active 15 DOM
-
2026-06-17days on market $189,000 Active 14 DOM
-
2026-06-16days on market $189,000 Active 13 DOM
-
2026-06-15days on market $189,000 Active 12 DOM
-
2026-06-13days on market $189,000 Active 10 DOM
-
2026-06-13days on market $189,000 Active 9 DOM
-
2026-06-09days on market $189,000 Active 6 DOM
-
2026-06-08days on market $189,000 Active 5 DOM
-
2026-06-07days on market $189,000 Active 4 DOM
-
2026-06-04remarks 687-char remark
-
2026-06-04$189,000 Active 1 DOM
ⓘ Source: listings_history table (triggers on properties + properties_extension) + one-shot
backfill from property_details.listing_events for pre-trigger history.
Tax reassessment forecast CA · Resets to sale price
- Current annual tax
- $571 · $48/mo
- Projected year-2 tax
- $1,436 · $120/mo
- Expected delta
- +$866/yr (+$72/mo · 151.7%)
ⓘ Screening estimate from a state-policy table — verify with the county assessor before closing.
Climate risk First Street
- Flood 8/10 Severe FEMA zone X (unshaded) · 99% chance over 30 yrs
- Wildfire 9/10 Extreme
- Heat 5/10 Major 7 d/yr ≥97°F today · 15 d/yr by 30 yrs out
- Wind 1/10 Low
- Air quality 9/10 Extreme 17 unhealthy d/yr today · 18 by 30 yrs out
Nearby sold comps map
Loading sold comps map…
Walkable amenities ~0.75 mi
Loading nearby amenities…
Taxation est. · year 1
- Rental income
- $32,788
- − Mortgage interest
- −$10,587
- − Property taxes
- −$571
- − Insurance
- −$1,742
- − Repairs & maintenance
- −$2,623
- − Management
- −$2,623
- − Depreciation
- −$5,498
- Taxable income
- $9,144
- Est. tax owed @ 24.0%
- −$2,195
- After-tax cash flow
- $9,501/yr
For passive investors: Depreciation is non-cash, so a rental often shows a tax loss while cash-flowing — sheltering income. Rental losses are passive: they offset passive income freely, and up to $25,000/yr can offset ordinary (W-2) income if you actively participate and your MAGI is under $100k (phasing out to $0 by $150k); unused losses carry forward. On sale, claimed depreciation is recaptured at up to 25%, and gains may owe capital-gains tax (a 1031 exchange can defer both). Figures are a year-1 estimate at your 24.0% rate — not tax advice; consult a CPA.
Schools (NCES district)
- District
- Brentwood Union Elementary
- NCES district ID
- 0605910
- Math proficiency
- 51% ▲ 1.00%
- Reading proficiency
- 59% ▬ 0.00%
- Median HH income
- $91,644
- Composite
- 52.7/100
- National rank
- #3320
- State rank
- #268 of 1400 in CA
Livability — Antioch
- Score
- 56/100
- State rank
- #782
- US rank
- #22472
Category grades
Schools grade is shown separately in the Schools card above.
Census & demographics
- City population
- 116,477
- Population (ZIP)
- 12,164
Population outlook (Contra Costa County) Hauer SSP2
- Today (2025)
- 1,287,720 people
- By 2030
- 1,364,937 · +6.0%
- By 2040
- 1,506,209 · +17.0%
- By 2050
- 1,624,373 · +26.1%
- By 2075
- 1,853,193 · +43.9%
- By 2100
- 1,901,231 · +47.6%
Race, ethnicity, and origin ACS 2023
- Neighborhood character
- Predominantly White (67%)
- Race & ethnicity
- White 67% Two or more races 13% Hispanic / Latino 13% Asian 11% Black 3%
- Hispanic origin (detail)
- Mexican 5% Puerto Rican 2%
- Common ancestry
- Italian 3% Scotch-Irish 2% Lithuanian 2%
- Foreign-born
- 13% · Canada, China, Philippines
- Languages at home
- 87% English-only · Spanish 4% Russian/Polish/Slavic 2% Other Indo-European 2%
Political lean MEDSL · Contra Costa
- 2024 margin
- Solid D (+38.0) · D 67.3% · R 29.4% · Other 3.3%
- 2008→2024 swing
- +0.2pp no change · 2008: 37.8pp · 2024: 38.0pp
- All cycles
- 2024: D+38.0 2020: D+45.3 2016: D+43.5 2012: D+33.7 2008: D+37.8
Not yet ingested
- Civics
- —
Market trends
- HPI YoY
- ▼ -693.84%
- Current HPI
- 144.7139
- Rent YoY
- —
- Metro
- —
- State GDP YoY
- ▲ 3.21%
- F500 in state
- 116
Industry mix (Fortune 500 HQ in CA)
| Industry | F500 HQs | Revenue |
|---|---|---|
| Technology | 27 | $1,492B |
|
||
| Financial Services | 3 | $174B |
|
||
| Retail | 3 | $44B |
|
||
| Insurance | 3 | $26B |
|
||
| Media / Entertainment | 2 | $115B |
|
||
| Pharmaceuticals / Biotech | 2 | $62B |
|
||
Price history
1 event — show timeline
- 2026-06-03 Listed $189,000 bridgeMLS, Bay East AOR, or Contra Costa AOR
Property tax history
-0.8%/yrLatest (2025): $571 · -0.4% YoY. Source: county tax records.
Cash-flow waterfall
monthlySold comps — $/sqft
last 12 mo · ≤1 miLoading sold comps…