4380 Brookside Ct #116 · Edina, MN
Flood risk 1/10 · Minimal
- FEMA flood zone
- X (unshaded)
- Chance of flooding over 30 yrs
- 0.0%
- Est. flood insurance / yr
- $473 – $860
Fire risk 1/10 · Minimal
- Est. fire insurance / yr
- $888 – $1,650
Heat risk 2/10 · Minimal
- Hot days now (above 98°F)
- 7 days/yr
- Hot days in 30 yrs
- 13 days/yr
Wind risk 2/10 · Minimal
- Chance of severe wind over 30 yrs
- —
Air-quality risk 2/10 · Minimal
- Unhealthy air days now
- 2 days/yr
- Unhealthy air days in 30 yrs
- 2 days/yr
Risk factors via First Street. Map © Google.
Why this score? — see what drove the C- grade
The composite is a weighted blend of 9 inputs, each scored 0–100. Each bar is that input's sub-score; the figure is the points it added to the 100-point composite (weight × sub-score).
- Cash flow +16.2/30.0
- 1% rule +7.7/10.0
- ARV discount +7.5/15.0
- Schools +6.6/10.0
- DSCR +5.0/10.0
- Rent growth +4.7/5.0
- Livability +4.0/5.0
- Condition / age +2.5/5.0
- Appreciation +0.0/10.0
$145,000
🖨 Deal sheet 📄 Offer letter ✓ Due diligence
Listing remarks
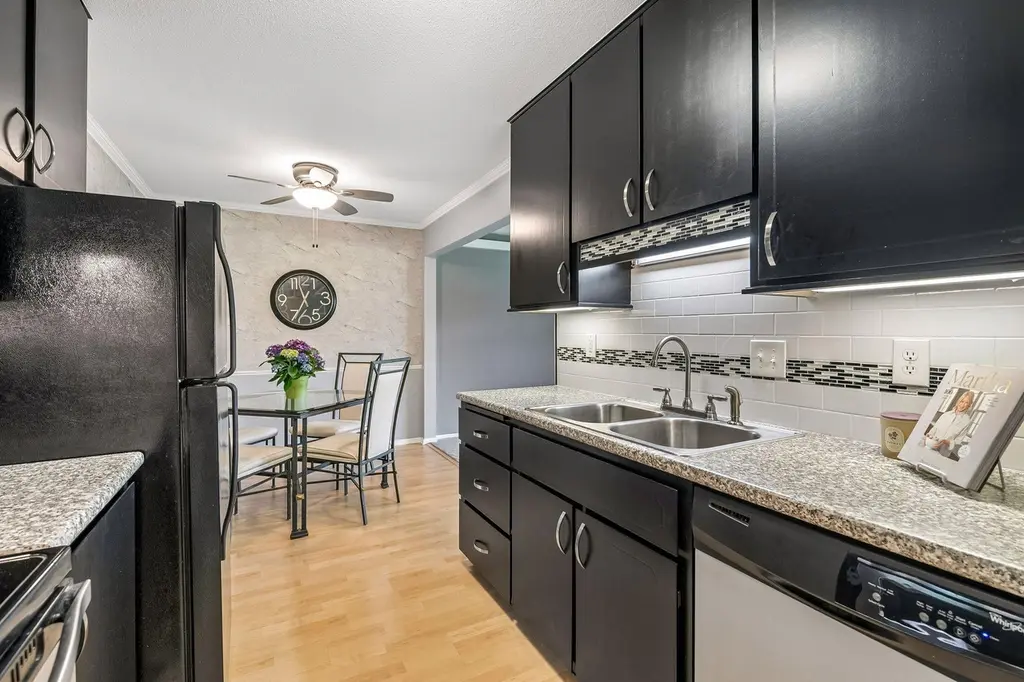
Fantastic Edina condo in the terrific Brookside community! This beautifully updated unit features fresh neutral decor and brand-new carpet throughout, creating a bright and welcoming feel. The kitchen offers abundant cabinetry and opens seamlessly to the dining area and spacious living room, highlighted by attractive boxed accent lighting. Relax in the charming three-season porch with peaceful views - the perfect spot to unwind. The generous bedroom includes convenient sliding closet drawers, also found in the entry closet, and is complemented by a full bath. Enjoy heated underground garage. Brookside includes great amenities - an indoor pool, community room, exercise room, sauna, and car w
Key facts
- Fitness center
- Sauna
- Car wash
Tags
Property features AI
Finance
- HOA & community: Westport Properties HOA; Monthly association fee ($420) that covers hazard insurance, heating, lawn care, grounds maintenance, parking, professional management, sewer, shared amenities, and snow removal; Building amenities include car wash, laundry, elevators, lobby entrance, sauna; Shared community rooms including community room and exercise room
Exterior
- Parking: Heated underground garage stall (assigned number 42); 1 garage space
- Utilities: City water connected; City sewer connected; Natural gas
- Home design: Attached residential unit; Single-level (one story); Accessible with elevator and no internal stairs
- Construction: 900 above-grade finished area; 900 building/foundation area
- Exterior features: Porch (screened); Stone exterior; Shared indoor pool
Interior
- Kitchen: Includes range, microwave, dishwasher, disposal, refrigerator
- Bedrooms: One bedroom on the main level (13 x 12)
- Bathrooms: One full bathroom on the main level
- Heating & cooling: Baseboard and hot water heating; Wall cooling unit(s)
- Interior features: Dishwasher; Disposal; Microwave; Range; Refrigerator
- Laundry & utility: Shared laundry room in hall / common area
Neighborhood map
What this means for you Summary
Snapshot
- This is a 1-bed/1.0-bath condo listed at $145k.
Deal economics
- At list price, monthly cash flow is $78 ($931/yr) — positive.
- The deal already cash-flows at list — no discount required.
- Meets the 1% rule at list price ($2k rent vs $145k).
- Recommended offer: $143k (1.5% below list) — sets the bar for market timing.
- Cap rate 6.9% vs local median 1.8% in Edina — top-decile yield for the area; either an underpriced asset or a hidden risk that comps aren't pricing in. Stress-test before assuming the spread holds.
Location & tenants
- Location reads 80/100 on livability (#82 in MN, #1,926 nationally) — a professional / high-income tenant draw. Strengths: schools A+, crime A+, commute A+; Watch: amenities F, cost of living F.
- Edina Public School District (suburban): math 69% / reading 75% proficiency, ranked #5 of 301 in MN (top 2%) — strong family-tenant draw, lease renewals of 3-5y typical; only 7% free/reduced lunch — higher-income household profile.
- Market conditions: Rents rising fast (+8.8%/yr); 122 active listings in the ZIP; 21 comparable units currently listed for rent nearby; rentals leasing fast (median 2d on market — plan ~1-2 weeks tenant-placement turnaround); high-income renter base; 4,651 units permitted in Hennepin County in 2024 (2,443 in 5+ unit buildings).
- This rent is only 15% of the median local income ($144k/yr) — well below the 30% rent-burden line; pricing power to push rent on renewal without tenant pushback.
Forward outlook
- Local home prices are declining (-3.0%/yr); year-one equity from $1k of loan paydown is wiped out by about $4k of value loss. Plan a longer hold.
- Hennepin County population projected at +30% by 2050 — long-run rental-demand tailwind backs the buy-and-hold thesis.
- At projected returns (-3.0% appreciation + 8.0% rent growth), your $41k cash investment doubles in ~10 years — after that, you're playing with house money.
Negotiation context
- It's been on market 23 days — a 2% lower offer ($143k) is reasonable based on typical stale-listing flexibility.
- 13 sale attempts since 32y ago with the ask held roughly flat each time — persistent listings suggest the price (not the market) is what's stuck; bring a comps-based counter.
- Current owner paid $55k; list at $145k implies a 164% gain — meaningful room to come down on a strong offer.
Risks & watch-outs
- Watch-outs: HOA is 23% of rent.
Questions for the listing agent
- Built in 1965 — when were the roof, HVAC, electrical panel, plumbing, and water heater last replaced?
- What does the HOA fee cover, when was the last increase, and are there any pending special assessments or reserve-fund shortfalls?
- Any open or pending special assessments — roof, HVAC, plumbing, elevator, façade? What's the per-unit balance and payoff schedule, and is the seller paying it off at close or rolling it to the buyer?
- Is there a deadline driving the sale (1031 exchange, divorce, estate, relocation)? That informs how much negotiation room exists.
- Schools are A-rated — typically a magnet for longer-tenancy family renters. What's the average tenant stay here, and is there a school-zone premium baked into asking?
- What's the average days-on-market for RENTAL listings here right now (not sales)? A rising rental-DOM trend means longer vacancies and softer asking-rent achievability than the comps imply.
- What's the recent tenant-quality profile in this submarket — average credit score on applications, eviction rate, late-payment / NSF rate, and stable-employment percentage? A property-management company in the area should have these aggregated.
- How much new apartment / multifamily construction is in the pipeline within 1–3 miles? Heavy new supply (>2% of stock underway) typically softens rents 12–24 months out; light construction supports rent growth.
Investment metrics
- 1% rule
- 1.27% ✓
- Cap rate
- 6.94%
- Cash-on-cash
- 2.29%
- DSCR
- 1.10
- GRM
- 6.6
CMA / ARV
No comps found within radius.
Projected returns pro-forma
-3.0% appreciation · 8.0% rent growth · sell at horizon
- IRR
- -5.3%
- Equity multiple
- 0.79×
- Total profit
- $-8,567
- Equity at exit
- $21,620
- IRR
- 10.8%
- Equity multiple
- 2.09×
- Total profit
- $44,237
- Equity at exit
- $12,537
Cash invested: $40,600 (down + closing). Projections, not guarantees.
Landlord ↔ Tenant lean methodology
- Overall (STATE)
- 46 Balanced
- State Minnesota
- 46 Balanced · D+2
- County
- — inherits STATE
- City
- — inherits STATE
ZIP-level market 55436
- Rents YoY
- 8.8%
- Active inventory
- 122
- Price-to-rent
- 6.6×
Monthly cashflow live
- Estimated rent
- $1,841 high interval (Pro) →
- Mortgage (P&I)
- −$760
- Tax from tax record
- −$136 /mo · $1,633/yr
- Insurance
- −$60
- HOA
- −$420
- Vacancy / Maint / Mgmt
- −$387
- Net cashflow
- $78
Break-even live
UW: 25.0% down · 7.5% · 30yr · 1.5% tax · 5.0% vac · 8.0% maint · 8.0% mgmt
Financing live
Cash to close
- Down payment
- $36,250
- Closing costs
- $4,350
- Reserves months
- —
- Total cash needed
- —
Loan-product check · same deal, 3 products live
Conventional
25% down · 7.5% · 30yr
- Down + closing
- —
- Monthly P&I
- —
- Monthly cashflow
- —
- DSCR
- —
- Eligible?
- —
Personal DTI + credit; lowest rate.
DSCR
20% down · 8.5% · 30yr
- Down + closing
- —
- Monthly P&I
- —
- Monthly cashflow
- —
- DSCR
- —
- Eligible?
- —
No personal income docs; deal must DSCR.
Hard money
10% down · 12.0% · 12mo
- Down + closing
- —
- Monthly P&I
- —
- Monthly cashflow
- —
- DSCR
- —
- Eligible?
- —
Short-term bridge; refi at stabilization.
Rent comps 21 comps
| Address | Beds | Baths | Sqft | Rent | $/sqft | DOM | Units | Dist |
|---|---|---|---|---|---|---|---|---|
| 4380 Brookside Ct Edina, MN | 1.0 | 1.0 | 900 | $1,750 | $1.94 | 17d | 1 | 0.03mi |
| 5220 Eden Ave Minneapolis, MN | 1.0 | 1.0 | 669 | $2,538 | $3.79 | 1d | 6 | 0.67mi |
| 4917 Eden Ave Minneapolis, MN | 2.0 | 1.0–2.0 | 1015 | $3,866 | $3.81 | 1d | 23 | 0.70mi |
| 5250 Villa Way Minneapolis, MN | 1.0–3.0 | 1.0–2.0 | 1299 | $1,440 | $1.11 | 2d | 5 | 0.76mi |
| 5300 Vernon Ave S Minneapolis, MN | 2.0 | 1.5 | 910 | $1,629 | $1.79 | 3d | 1 | 0.83mi |
| 6922 Meadowbrook Blvd St Louis Park, MN | 2.0 | 1.0 | 817 | $1,550 | $1.90 | 1d | 53 | 0.95mi |
| 4800 Excelsior Blvd Minneapolis, MN | 2.0 | 1.0–2.0 | 890 | $2,310 | $2.59 | 1d | 10 | 1.13mi |
| 5525 Hansen Rd Unit 205 Minneapolis, MN | 1.0 | 1.0 | 675 | $1,479 | $2.19 | 4d | 1 | 1.16mi |
| 3820 Grand Way St Louis Park, MN | 1.0–2.0 | 1.0–3.0 | 1301 | $1,795 | $1.38 | 1d | 35 | 1.25mi |
| 3901 Sunnyside Rd Minneapolis, MN | 1.0–2.0 | 1.5–2.0 | 1212 | $2,736 | $2.26 | 1d | 3 | 1.26mi |
| 3945 Market St Unit 306 Edina, MN | 1.0 | 1.0 | 693 | $2,450 | $3.54 | 2d | 1 | 1.26mi |
| 3945 Market St Edina, MN | 1.0–2.0 | 1.0–2.0 | 1193 | $2,545 | $2.13 | 14d | 8 | 1.26mi |
| 4901 France Ave S Minneapolis, MN | 2.0 | 2.5 | 1489 | $6,715 | $4.51 | 1d | 27 | 1.33mi |
| 4525 Park Commons Dr Minneapolis, MN | 2.0 | 1.0 | 994 | $2,295 | $2.31 | 43d | 1 | 1.36mi |
| 3601 Park Center Blvd Minneapolis, MN | 1.0–2.0 | 1.0–2.0 | 942 | $1,578 | $1.68 | 1d | 22 | 1.37mi |
| 5052 Ewing Ave S Minneapolis, MN | 1.0–2.0 | 1.0–2.0 | 1167 | $3,099 | $2.65 | 1d | 2 | 1.43mi |
| 5855 Highway 7 Minneapolis, MN | 3.0 | 1.0–2.0 | 991 | $1,818 | $1.83 | 1d | 40 | 1.44mi |
| 4408 Chowen Ave S Unit 4412-201 Minneapolis, MN | 2.0 | 1.0 | 900 | $1,439 | $1.60 | 24d | 1 | 1.45mi |
| 5600 Camerata Way Minneapolis, MN | 1.0–2.0 | 1.0–2.0 | 1037 | $1,608 | $1.55 | 2d | 27 | 1.46mi |
| 5924 W 35th St Unit A Minneapolis, MN | 1.0 | 1.0 | 750 | $995 | $1.33 | 17d | 1 | 1.47mi |
| 4425 Chowen Ave S Unit 2207 Minneapolis, MN | 2.0 | 1.0 | 850 | $1,395 | $1.64 | 3d | 1 | 1.48mi |
HOA detail condo
- Monthly dues
- $420 · $5,040/yr
- Likely covers
- pool
- Assessments
- None detected in remarks — confirm with the listing agent.
Listing history 35 events
-
2026-05-31status $145,000 Pending 23 DOM
-
2026-05-31days on market $145,000 Contingent - Subject to Statutory Rescission 23 DOM
-
2026-05-15historical Contingent - Subject to Statutory Rescission
-
2026-05-08$145,000 Active
-
2026-04-26historical
-
2026-04-24status Active
-
2026-04-16historical Contingent - Inspection
-
2025-12-01status Active
-
2025-11-12status Pending
-
2025-10-31historical Contingent - Inspection
-
2025-09-14$148,000 Active
-
2025-09-14historical
-
2025-06-20$152,000 Active
-
2025-06-17historical
-
2013-07-23soldstatus $55,000
-
2013-06-30historical
-
2013-04-18$49,900
-
2012-06-06historical
-
2012-03-26$69,900
-
2007-10-03soldstatus $89,900
-
2007-07-26soldstatus $89,900
-
2007-07-18historical
-
2007-01-15$89,900
-
2007-01-14historical
-
2006-05-18$118,900
-
2006-05-15historical
-
2006-02-15$124,000
-
2005-12-19historical
-
2005-09-22historical
-
2005-09-22$127,900
-
2005-06-14$129,900
-
1995-02-28soldstatus $49,900
-
1994-12-31soldstatus $49,900
-
1994-11-17historical
-
1994-05-11$49,900
ⓘ Source: listings_history table (triggers on properties + properties_extension) + one-shot
backfill from property_details.listing_events for pre-trigger history.
Tax reassessment forecast MN · Partial reset (capped growth)
- Current annual tax
- $1,633 · $136/mo
- Projected year-2 tax
- $1,633 · $136/mo
- Expected delta
- $0/yr ($0/mo · 0.0%)
ⓘ Screening estimate from a state-policy table — verify with the county assessor before closing.
Climate risk First Street
- Flood 1/10 Low FEMA zone X (unshaded) · 0% chance over 30 yrs
- Wildfire 1/10 Low
- Heat 2/10 Low 7 d/yr ≥98°F today · 13 d/yr by 30 yrs out
- Wind 2/10 Low
- Air quality 2/10 Low 2 unhealthy d/yr today · 2 by 30 yrs out
Nearby sold comps map
Loading sold comps map…
Walkable amenities ~0.75 mi
Loading nearby amenities…
Taxation est. · year 1
- Rental income
- $22,093
- − Mortgage interest
- −$8,122
- − Property taxes
- −$1,633
- − Insurance
- −$725
- − Repairs & maintenance
- −$1,767
- − Management
- −$1,767
- − HOA
- −$5,040
- − Depreciation
- −$4,218
- Taxable loss
- −$1,180
- Est. tax savings @ 24.0%
- +$283
- After-tax cash flow
- $1,214/yr
For passive investors: Depreciation is non-cash, so a rental often shows a tax loss while cash-flowing — sheltering income. Rental losses are passive: they offset passive income freely, and up to $25,000/yr can offset ordinary (W-2) income if you actively participate and your MAGI is under $100k (phasing out to $0 by $150k); unused losses carry forward. On sale, claimed depreciation is recaptured at up to 25%, and gains may owe capital-gains tax (a 1031 exchange can defer both). Figures are a year-1 estimate at your 24.0% rate — not tax advice; consult a CPA.
Schools (NCES district)
- District
- Edina Public School District
- NCES district ID
- 2711250
- Math proficiency
- 69% ▼ -8.00%
- Reading proficiency
- 75% ▼ -2.00%
- Median HH income
- $100,093
- Composite
- 65.8/100
- National rank
- #456
- State rank
- #5 of 301 in MN
Livability — Edina
- Score
- 80/100
- State rank
- #82
- US rank
- #1926
Category grades
Schools grade is shown separately in the Schools card above.
Census & demographics
- Census place
- Edina, MN
- County
- Hennepin County · 1,150,272 people
- City population
- 38,943
- Metro
- Minneapolis-St. Paul-Bloomington, MN-WI
- Population (ZIP)
- 14,462
- Household income
- $144,129
- Rent vs Own
- Severe rent burden
- 439.0
Population outlook (Hennepin County) Hauer SSP2
- Today (2025)
- 1,405,227 people
- By 2030
- 1,492,650 · +6.2%
- By 2040
- 1,660,157 · +18.1%
- By 2050
- 1,823,498 · +29.8%
- By 2075
- 2,221,283 · +58.1%
- By 2100
- 2,509,976 · +78.6%
Race, ethnicity, and origin ACS 2023
- Neighborhood character
- Predominantly White (88%)
- Race & ethnicity
- White 88% Two or more races 5% Asian 4% Hispanic / Latino 3%
- Common ancestry
- Portuguese 15% Romanian 4% Lithuanian 3%
- Foreign-born
- 8% · Canada, China, South Korea
- Languages at home
- 92% English-only · French/Haitian/Cajun 2% Spanish 2% Other Indo-European 2%
Political lean MEDSL · Hennepin
- 2024 margin
- Solid D (+42.6) · D 70.2% · R 27.5% · Other 2.3%
- 2008→2024 swing
- +14.0pp toward D · 2008: 28.6pp · 2024: 42.6pp
- All cycles
- 2024: D+42.6 2020: D+43.2 2016: D+35.3 2012: D+27.1 2008: D+28.6
Not yet ingested
- Civics
- —
Market trends
- HPI YoY
- ▼ -451.22%
- Current HPI
- 239.0967
- Rent YoY
- ▲ 8.84%
- Metro
- Minneapolis-St. Paul-Bloomington, MN-WI
- State GDP YoY
- ▲ 2.41%
- F500 in state
- 34
Industry mix (Fortune 500 HQ in MN)
| Industry | F500 HQs | Revenue |
|---|---|---|
| Healthcare | 2 | $407B |
|
||
| Retail | 2 | $150B |
|
||
| Consumer Goods | 2 | $32B |
|
||
| Industrial Machinery | 2 | $6B |
|
||
| Agriculture | 1 | $40B |
|
||
| Healthcare / Medical Devices | 1 | $32B |
|
||
Price history
+190.6% since first listed33 events — show timeline
- 2026-05-15 Contingent — NORTHSTARMLS as Distributed by MLS Grid
- 2026-05-08 Listed $145,000 NORTHSTARMLS as Distributed by MLS Grid
- 2026-04-26 Listing Removed — NORTHSTARMLS as Distributed by MLS Grid
- 2026-04-24 Relisted — NORTHSTARMLS as Distributed by MLS Grid
- 2026-04-16 Contingent — NORTHSTARMLS as Distributed by MLS Grid
- 2025-12-01 Relisted — NORTHSTARMLS as Distributed by MLS Grid
- 2025-11-12 Pending — NORTHSTARMLS as Distributed by MLS Grid
- 2025-10-31 Contingent — NORTHSTARMLS as Distributed by MLS Grid
- 2025-09-14 Listing Removed — NORTHSTARMLS as Distributed by MLS Grid
- 2025-09-14 Listed $148,000 NORTHSTARMLS as Distributed by MLS Grid
- 2025-06-20 Listed $152,000 NORTHSTARMLS as Distributed by MLS Grid
- 2025-06-17 Coming Soon — NORTHSTARMLS as Distributed by MLS Grid
- 2013-07-23 Sold (MLS) $55,000 NORTHSTARMLS as Distributed by MLS Grid
- 2013-06-30 Listing Removed — NORTHSTARMLS as Distributed by MLS Grid
- 2013-04-18 Listed $49,900 NORTHSTARMLS as Distributed by MLS Grid
- 2012-06-06 Listing Removed — NORTHSTARMLS as Distributed by MLS Grid
- 2012-03-26 Listed $69,900 NORTHSTARMLS as Distributed by MLS Grid
- 2007-10-03 Sold (Public Records) $89,900 Public Records
- 2007-07-26 Sold (MLS) $89,900 NORTHSTARMLS as Distributed by MLS Grid
- 2007-07-18 Listing Removed — NORTHSTARMLS as Distributed by MLS Grid
- 2007-01-15 Listed $89,900 NORTHSTARMLS as Distributed by MLS Grid
- 2007-01-14 Listing Removed — NORTHSTARMLS as Distributed by MLS Grid
- 2006-05-18 Listed $118,900 NORTHSTARMLS as Distributed by MLS Grid
- 2006-05-15 Listing Removed — NORTHSTARMLS as Distributed by MLS Grid
- 2006-02-15 Listed $124,000 NORTHSTARMLS as Distributed by MLS Grid
- 2005-12-19 Listing Removed — NORTHSTARMLS as Distributed by MLS Grid
- 2005-09-22 Listed $127,900 NORTHSTARMLS as Distributed by MLS Grid
- 2005-09-22 Listing Removed — NORTHSTARMLS as Distributed by MLS Grid
- 2005-06-14 Listed $129,900 NORTHSTARMLS as Distributed by MLS Grid
- 1995-02-28 Sold (Public Records) $49,900 Public Records
- 1994-12-31 Sold (MLS) $49,900 NORTHSTARMLS as Distributed by MLS Grid
- 1994-11-17 Listing Removed — NORTHSTARMLS as Distributed by MLS Grid
- 1994-05-11 Listed $49,900 NORTHSTARMLS as Distributed by MLS Grid
Property tax history
+8.1%/yrLatest (2025): $1,633 · -1.5% YoY. Source: county tax records.
Cash-flow waterfall
monthlySold comps — $/sqft
last 12 mo · ≤1 miLoading sold comps…