 Duplex
11 Type Rd · Windham, CT
Flood risk No data
- FEMA flood zone
- —
- Chance of flooding over 30 yrs
- —
- Est. flood insurance / yr
- —
Fire risk No data
- Est. fire insurance / yr
- —
Heat risk No data
- Hot days now (above threshold)
- —
- Hot days in 30 yrs
- —
Wind risk No data
- Chance of severe wind over 30 yrs
- —
Air-quality risk No data
- Unhealthy air days now
- —
- Unhealthy air days in 30 yrs
- —
Risk factors via First Street. Map © Google.
Why this score? — see what drove the D grade
The composite is a weighted blend of 9 inputs, each scored 0–100. Each bar is that input's sub-score; the figure is the points it added to the 100-point composite (weight × sub-score).
- Cash flow +13.1/30.0
- ARV discount +7.5/15.0
- Appreciation +4.4/10.0
- DSCR +3.9/10.0
- 1% rule +3.3/10.0
- Rent growth +2.5/5.0
- Livability +2.5/5.0
- Condition / age +2.5/5.0
- Schools +1.7/10.0
$315,000
🖨 Deal sheet 📄 Offer letter ✓ Due diligence
Multi-family units
County records classify this as Multi-Family (2-4 Unit). Listing-text estimate: 2 units. confirmed
Listing remarks
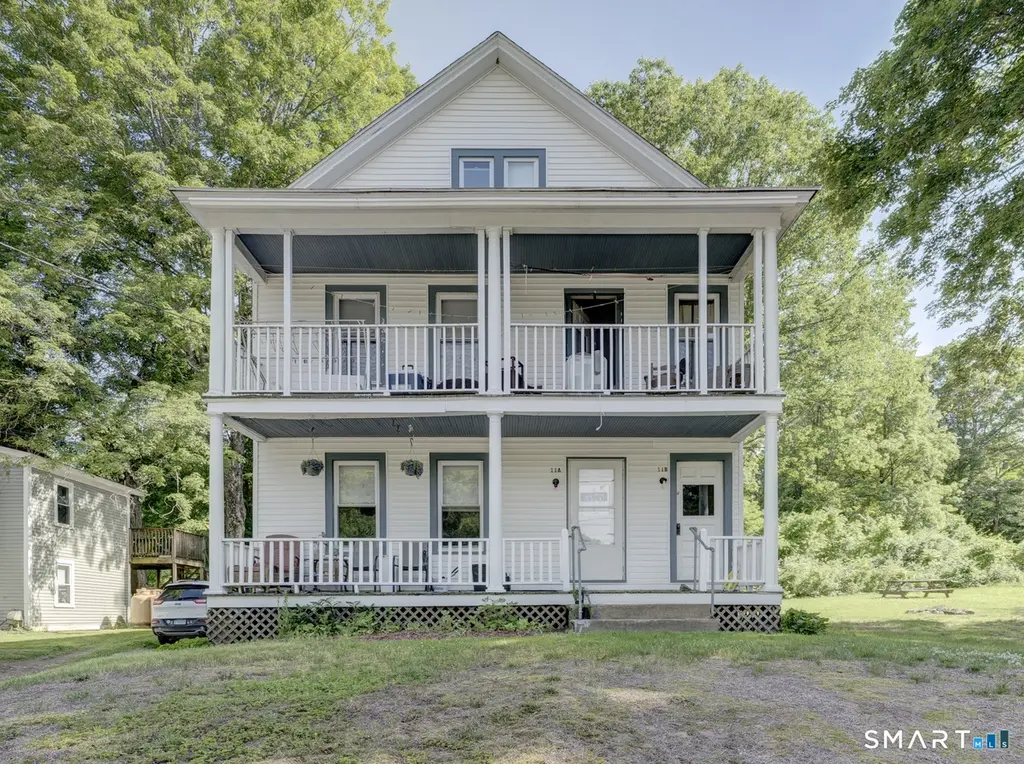
Investors and owner-occupants take notice! Well-maintained fully rented, with tenants in place, two-family home situated on a quiet dead-end street. Each unit offers 2 bedrooms, 1 full bath, and approximately 1,000 square feet of living space, providing spacious layouts and strong rental appeal. Separate utilities make management simple, while laundry hookups in the basement add convenience for tenants. Situated on nearly a half-acre lot, the property offers plenty of outdoor space, Large front porch and an abundance of off-street parking. Conveniently located close to shopping, dining, schools, and major routes. Whether you're looking to expand your investment portfolio or secure a future
Key facts
- Separate utilities
- Large front porch
- Off-street parking
Tags
Property features AI
Exterior
- Parking: Paved and unpaved off-street parking; 6 parking spaces
- Utilities: Public water connected; Septic system; Fuel tank located in basement
- Home design: Multi-family 2-family property; Frame construction; White exterior
- Construction: Masonry foundation; Asphalt shingle roof; Vinyl siding
- Exterior features: Porch; Lightly wooded, sloping lot
Interior
- Bedrooms: 4 bedrooms
- Bathrooms: 2 full bathrooms
- Heating & cooling: Hot water heating; Oil-fired heat; Tankless domestic hot water
- Interior features: 10 total rooms; Full basement; Walk-up attic
Neighborhood map
What this means for you Summary
Snapshot
- This is a 2 × 2-bed/1.0-bath units multifamily listed at $315k.
Deal economics
- At list price, monthly cash flow is $-10 ($-119/yr) — negative. Per door: $-5/mo.
- To cash-flow at today's rent, offer at most $313k (0.6% below list).
- To meet the 1% rule (rent ≥ 1% of price), the offer needs to be $261k (17.0% below list).
- Recommended offer: $261k (17.0% below list) — sets the bar for 1% rule.
Location & tenants
- Location reads: area grade D — affects rentability + tenant quality, not the cash-flow math above.
- Windham School District (town): math 15% / reading 25% proficiency, ranked #143 of 153 in CT (top 94%) — low school quality limits family demand, transient renter base, plan for 1-2y turnover; 68% free/reduced lunch — lower-income household profile, screen leases tightly.
- Market conditions: 3 active listings in the ZIP; 487 units permitted in Southeastern Connecticut Planning Region in 2024 (244 in 5+ unit buildings).
Forward outlook
- Local home prices are declining (-1.2%/yr); year-one equity from $2k of loan paydown is wiped out by about $4k of value loss. Plan a longer hold.
Negotiation context
- Only 6 days on market — expect competitive offers; lowballing is unlikely to land.
- Current owner paid $120k; list at $315k implies a 162% gain — meaningful room to come down on a strong offer.
Risks & watch-outs
- Watch-outs: built in 1910 — expect roof / HVAC / electrical / plumbing capex.
Questions for the listing agent
- What do current leases actually rent for vs. the listed asking? Can we see a recent rent roll and the last 12 months of T-12 income?
- Can we see the unit-by-unit rent roll, current vacancy, and any below-market leases? What's the average tenancy length?
- What capital expenditures (roof, boiler, parking lot, exteriors) have been made in the last 5 years, and what's planned in the next 2?
- Built in 1910 — when were the roof, HVAC, electrical panel, plumbing, and water heater last replaced?
- Is there a deadline driving the sale (1031 exchange, divorce, estate, relocation)? That informs how much negotiation room exists.
- The area grade is low — what's the realistic commute time and amenity access for the typical tenant pool here? Any planned neighborhood developments (good or bad) we should know about?
- What's the average days-on-market for RENTAL listings here right now (not sales)? A rising rental-DOM trend means longer vacancies and softer asking-rent achievability than the comps imply.
- What's the recent tenant-quality profile in this submarket — average credit score on applications, eviction rate, late-payment / NSF rate, and stable-employment percentage? A property-management company in the area should have these aggregated.
- How much new apartment / multifamily construction is in the pipeline within 1–3 miles? Heavy new supply (>2% of stock underway) typically softens rents 12–24 months out; light construction supports rent growth.
Investment metrics
- 1% rule
- 0.83% ✗
- Cap rate
- 6.25%
- Cash-on-cash
- -0.14%
- DSCR
- 0.99
- GRM
- 10.0
CMA / ARV
No comps found within radius.
Projected returns pro-forma
-1.22% appreciation · 3.0% rent growth · sell at horizon
- IRR
- -7.3%
- Equity multiple
- 0.69×
- Total profit
- $-27,535
- Equity at exit
- $72,677
- IRR
- -0.3%
- Equity multiple
- 0.97×
- Total profit
- $-2,455
- Equity at exit
- $73,489
Cash invested: $88,200 (down + closing). Projections, not guarantees.
Landlord ↔ Tenant lean methodology
- Overall (STATE)
- 27 Tenant-Leaning
- State Connecticut
- 27 Tenant-Leaning · D+7
- County
- — inherits STATE
- City
- — inherits STATE
ZIP-level market 06266
- Home prices YoY
- -0.5%
- Active inventory
- 3
- Price-to-rent
- 20.1×
Monthly cashflow live
- Estimated rent
- $2,613 medium interval (Pro) →
- Mortgage (P&I)
- −$1,652
- Tax from tax record
- −$291 /mo · $3,493/yr
- Insurance
- −$131
- HOA
- −$0
- Vacancy / Maint / Mgmt
- −$549
- Net cashflow
- $-10
Break-even live
2-unit breakdown (identical units grouped — click to expand)
| Units | Beds | Baths | Est. rent |
|---|---|---|---|
| 2× units | 2 | 1 | $2,612 |
| #1 | 2 | 1 | $1,306 |
| #2 | 2 | 1 | $1,306 |
| Total (2 units) | $2,613 | ||
UW: 25.0% down · 7.5% · 30yr · 1.5% tax · 5.0% vac · 8.0% maint · 8.0% mgmt
Financing live
Cash to close
- Down payment
- $78,750
- Closing costs
- $9,450
- Reserves months
- —
- Total cash needed
- —
Loan-product check · same deal, 3 products live
Conventional
25% down · 7.5% · 30yr
- Down + closing
- —
- Monthly P&I
- —
- Monthly cashflow
- —
- DSCR
- —
- Eligible?
- —
Personal DTI + credit; lowest rate.
DSCR
20% down · 8.5% · 30yr
- Down + closing
- —
- Monthly P&I
- —
- Monthly cashflow
- —
- DSCR
- —
- Eligible?
- —
No personal income docs; deal must DSCR.
Hard money
10% down · 12.0% · 12mo
- Down + closing
- —
- Monthly P&I
- —
- Monthly cashflow
- —
- DSCR
- —
- Eligible?
- —
Short-term bridge; refi at stabilization.
Listing history 6 events
-
2026-06-18days on market $315,000 Active 6 DOM
-
2026-06-17days on market $315,000 Active 5 DOM
-
2026-06-16days on market $315,000 Active 4 DOM
-
2026-06-15days on market $315,000 Active 3 DOM
-
2026-06-14remarks 699-char remark
-
2026-06-14$315,000 Active 1 DOM
ⓘ Source: listings_history table (triggers on properties + properties_extension) + one-shot
backfill from property_details.listing_events for pre-trigger history.
Tax reassessment forecast CT · Partial reset (capped growth)
- Current annual tax
- $3,493 · $291/mo
- Projected year-2 tax
- $5,117 · $426/mo
- Expected delta
- +$1,624/yr (+$135/mo · 46.5%)
ⓘ Screening estimate from a state-policy table — verify with the county assessor before closing.
Nearby sold comps map
Loading sold comps map…
Walkable amenities ~0.75 mi
Loading nearby amenities…
Taxation est. · year 1
- Rental income
- $31,356
- − Mortgage interest
- −$17,645
- − Property taxes
- −$3,493
- − Insurance
- −$1,575
- − Repairs & maintenance
- −$2,508
- − Management
- −$2,508
- − Depreciation
- −$9,164
- Taxable loss
- −$5,537
- Est. tax savings @ 24.0%
- +$1,329
- After-tax cash flow
- $1,210/yr
For passive investors: Depreciation is non-cash, so a rental often shows a tax loss while cash-flowing — sheltering income. Rental losses are passive: they offset passive income freely, and up to $25,000/yr can offset ordinary (W-2) income if you actively participate and your MAGI is under $100k (phasing out to $0 by $150k); unused losses carry forward. On sale, claimed depreciation is recaptured at up to 25%, and gains may owe capital-gains tax (a 1031 exchange can defer both). Figures are a year-1 estimate at your 24.0% rate — not tax advice; consult a CPA.
Schools (NCES district)
- District
- Windham School District
- NCES district ID
- 0905190
- Math proficiency
- 15% ▼ -16.00%
- Reading proficiency
- 25% ▼ -12.00%
- Median HH income
- $40,956
- Composite
- 17.01/100
- National rank
- #9128
- State rank
- #143 of 153 in CT
Livability — Windham
No livability data for this city. (Only ~50 U.S. cities are tracked.)
Census & demographics
- Census place
- South Windham, CT
- Population (ZIP)
- 278
Population outlook (Southeastern Connecticut County) Hauer SSP2
- By 2040
- 293,442
Race, ethnicity, and origin ACS 2023
- Neighborhood character
- Predominantly White (90%)
- Race & ethnicity
- White 90% Black 5% Two or more races 4% Hispanic / Latino 1%
- Common ancestry
- Romanian 20% Lithuanian 13% Slovak 6%
- Foreign-born
- 1%
Political lean MEDSL · Southeastern Connecticut
- 2024 margin
- D (+13.0) · D 55.6% · R 42.6% · Other 1.8%
- All cycles
- 2024: D+13.0
Not yet ingested
- Civics
- —
Market trends
- HPI YoY
- ▼ -1.22%
- Current HPI
- 258.9938
- Rent YoY
- —
- Metro
- —
- State GDP YoY
- ▲ 1.06%
- F500 in state
- 38
Industry mix (Fortune 500 HQ in CT)
| Industry | F500 HQs | Revenue |
|---|---|---|
| Industrial Machinery | 4 | $38B |
|
||
| Insurance | 3 | $71B |
|
||
| Financial Services | 2 | $25B |
|
||
| Transportation / Logistics | 2 | $18B |
|
||
| Healthcare | 1 | $247B |
|
||
| Telecommunications | 1 | $55B |
|
||
Price history
+162.5% since first listed2 events — show timeline
- 2026-06-11 Listed $315,000 Smart MLS
- 1988-08-12 Sold (Public Records) $120,000 Public Records
Property tax history
+0.4%/yrLatest (2023): $3,493 · +2.6% YoY. Source: county tax records.
Cash-flow waterfall
monthlySold comps — $/sqft
last 12 mo · ≤1 miLoading sold comps…