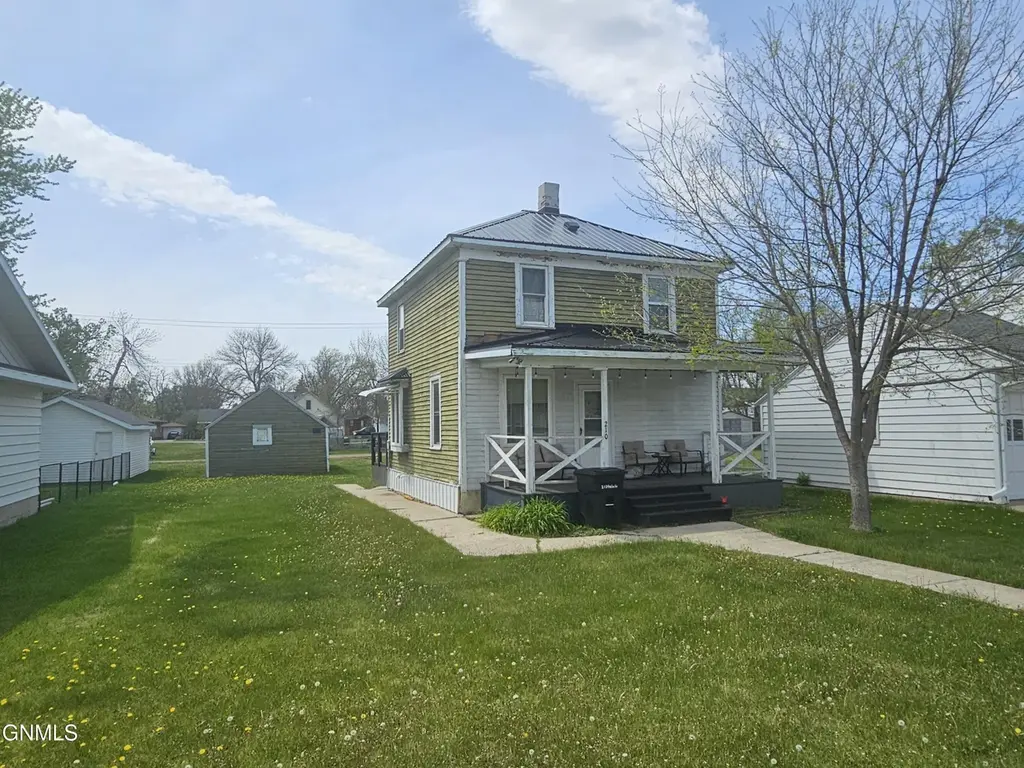
210 9th St S · Wishek, ND
Flood risk No data
- FEMA flood zone
- —
- Chance of flooding over 30 yrs
- —
- Est. flood insurance / yr
- —
Fire risk No data
- Est. fire insurance / yr
- —
Heat risk No data
- Hot days now (above threshold)
- —
- Hot days in 30 yrs
- —
Wind risk No data
- Chance of severe wind over 30 yrs
- —
Air-quality risk No data
- Unhealthy air days now
- —
- Unhealthy air days in 30 yrs
- —
Risk factors via First Street. Map © Google.
Why this score? — see what drove the B+ grade
The composite is a weighted blend of 9 inputs, each scored 0–100. Each bar is that input's sub-score; the figure is the points it added to the 100-point composite (weight × sub-score).
- Cash flow +30.0/30.0
- 1% rule +10.0/10.0
- DSCR +10.0/10.0
- ARV discount +7.5/15.0
- Appreciation +5.0/10.0
- Schools +4.4/10.0
- Livability +3.9/5.0
- Rent growth +2.5/5.0
- Condition / age +2.2/5.0
$59,999
🖨 Deal sheet 📄 Offer letter ✓ Due diligence
Key facts
- New metal roof
- 7,000 sq ft lot
- 2 garage spots
Tags
Property features AI
Exterior
- Parking: Detached 2-car garage
- Utilities: Public water; Public sewer; Electricity connected; Propane available; Cable available; Water connected
- Home design: Single-family residence; Two levels
- Construction: Wood siding; Metal roof; Concrete perimeter foundation; Built as a residential single family home
- Exterior features: No exterior features listed; No fencing; Asphalt road frontage on a public maintained city street; Lot approximately 50 x 140 (0.16 acres)
Interior
- Kitchen: Dishwasher; Microwave; Range
- Flooring: Laminate
- Bathrooms: 1 full bathroom
- Heating & cooling: Forced air heating; Central air conditioning
- Interior features: Dishwasher; Dryer; Microwave; Range; Washer; Laminate flooring; Basement with dirt floor
- Laundry & utility: Washer; Dryer
Neighborhood map
What this means for you Summary
Snapshot
- This is a 3-bed/1.0-bath single-family listed at $60k. Condition is rated fair.
Deal economics
- At list price, monthly cash flow is $381 ($5k/yr) — positive.
- The deal already cash-flows at list — no discount required.
- Meets the 1% rule at list price ($1k rent vs $60k).
- Recommended offer: $59k (1.5% below list) — sets the bar for market timing.
Location & tenants
- Location reads 78/100 on livability (#9 in ND, #2,743 nationally) — a middle-class / working-renter tenant base. Strengths: crime A+, cost of living A+, housing A+; Watch: schools C-, employment C-, amenities F.
- Wishek 19 (rural): math 50% / reading 50% proficiency, ranked #58 of 169 in ND (top 34%) — acceptable for families but not a draw, mixed tenant base, ~2y average lease.
- Market conditions: 6 active listings in the ZIP.
Forward outlook
- In year one you build about $2k of equity ($415 loan paydown + $2k appreciation (3.0% local appreciation)).
- McIntosh County population projected at +8% by 2050 — modest demand growth; plan on rents tracking national, not racing it.
- At projected returns (3.0% appreciation + 3.0% rent growth), your $17k cash investment doubles in ~3 years — after that, you're playing with house money.
Negotiation context
- It's been on market 27 days — a 2% lower offer ($59k) is reasonable based on typical stale-listing flexibility.
Risks & watch-outs
- Watch-outs: built in 1920 — expect roof / HVAC / electrical / plumbing capex.
Questions for the listing agent
- Have any recent inspections been done? Can we get a copy of the seller's disclosures and any deferred-maintenance estimates?
- Built in 1920 — when were the roof, HVAC, electrical panel, plumbing, and water heater last replaced?
- Is there a deadline driving the sale (1031 exchange, divorce, estate, relocation)? That informs how much negotiation room exists.
- What's the average days-on-market for RENTAL listings here right now (not sales)? A rising rental-DOM trend means longer vacancies and softer asking-rent achievability than the comps imply.
- What's the recent tenant-quality profile in this submarket — average credit score on applications, eviction rate, late-payment / NSF rate, and stable-employment percentage? A property-management company in the area should have these aggregated.
- How much new for-sale + rental construction is in the pipeline within 1–3 miles? Heavy new supply typically softens prices + rents 12–24 months out; constrained supply supports both.
Investment metrics
- 1% rule
- 1.68% ✓
- Cap rate
- 13.92%
- Cash-on-cash
- 27.24%
- DSCR
- 2.21
- GRM
- 5.0
CMA / ARV
No comps found within radius.
Projected returns pro-forma
3.0% appreciation · 3.0% rent growth · sell at horizon
- IRR
- 33.2%
- Equity multiple
- 2.88×
- Total profit
- $31,532
- Equity at exit
- $26,978
- IRR
- 33.5%
- Equity multiple
- 5.66×
- Total profit
- $78,240
- Equity at exit
- $41,577
Cash invested: $16,800 (down + closing). Projections, not guarantees.
Landlord ↔ Tenant lean methodology
- Overall (STATE)
- 82 Strongly Landlord-Friendly
- State North Dakota
- 82 Strongly Landlord-Friendly · R+20
- County
- — inherits STATE
- City
- — inherits STATE
ZIP-level market 58495
- Active inventory
- 6
- Price-to-rent
- 5.0×
Monthly cashflow live
- Estimated rent
- $1,008 medium interval (Pro) →
- Mortgage (P&I)
- −$315
- Tax est. 1.5%
- −$75 /mo · $900/yr
- Insurance
- −$25
- HOA
- −$0
- Vacancy / Maint / Mgmt
- −$212
- Net cashflow
- $381
Break-even live
UW: 25.0% down · 7.5% · 30yr · 1.5% tax · 5.0% vac · 8.0% maint · 8.0% mgmt
Financing live
Cash to close
- Down payment
- $15,000
- Closing costs
- $1,800
- Reserves months
- —
- Total cash needed
- —
Loan-product check · same deal, 3 products live
Conventional
25% down · 7.5% · 30yr
- Down + closing
- —
- Monthly P&I
- —
- Monthly cashflow
- —
- DSCR
- —
- Eligible?
- —
Personal DTI + credit; lowest rate.
DSCR
20% down · 8.5% · 30yr
- Down + closing
- —
- Monthly P&I
- —
- Monthly cashflow
- —
- DSCR
- —
- Eligible?
- —
No personal income docs; deal must DSCR.
Hard money
10% down · 12.0% · 12mo
- Down + closing
- —
- Monthly P&I
- —
- Monthly cashflow
- —
- DSCR
- —
- Eligible?
- —
Short-term bridge; refi at stabilization.
Listing history 15 events
-
2026-06-18days on market $59,999 Active 27 DOM
-
2026-06-17days on market $59,999 Active 26 DOM
-
2026-06-16days on market $59,999 Active 25 DOM
-
2026-06-15days on market $59,999 Active 24 DOM
-
2026-06-13days on market $59,999 Active 22 DOM
-
2026-06-12days on market $59,999 Active 21 DOM
-
2026-06-09days on market $59,999 Active 18 DOM
-
2026-06-08days on market $59,999 Active 17 DOM
-
2026-06-07days on market $59,999 Active 16 DOM
-
2026-06-05days on market $59,999 Active 14 DOM
-
2026-06-04days on market $59,999 Active 12 DOM
-
2026-06-02days on market $59,999 Active 11 DOM
-
2026-06-01days on market $59,999 Active 10 DOM
-
2026-05-31days on market $59,999 Active 9 DOM
-
2026-05-22$59,999 Active
ⓘ Source: listings_history table (triggers on properties + properties_extension) + one-shot
backfill from property_details.listing_events for pre-trigger history.
Nearby sold comps map
Loading sold comps map…
Walkable amenities ~0.75 mi
Loading nearby amenities…
Taxation est. · year 1
- Rental income
- $12,091
- − Mortgage interest
- −$3,361
- − Property taxes
- −$900
- − Insurance
- −$300
- − Repairs & maintenance
- −$967
- − Management
- −$967
- − Depreciation
- −$1,745
- Taxable income
- $3,850
- Est. tax owed @ 24.0%
- −$924
- After-tax cash flow
- $3,652/yr
For passive investors: Depreciation is non-cash, so a rental often shows a tax loss while cash-flowing — sheltering income. Rental losses are passive: they offset passive income freely, and up to $25,000/yr can offset ordinary (W-2) income if you actively participate and your MAGI is under $100k (phasing out to $0 by $150k); unused losses carry forward. On sale, claimed depreciation is recaptured at up to 25%, and gains may owe capital-gains tax (a 1031 exchange can defer both). Figures are a year-1 estimate at your 24.0% rate — not tax advice; consult a CPA.
Condition & rehab AI · 13 photos
The property shows average condition with some minor repairs and maintenance needed. Upgrading the exterior paint and landscaping would significantly enhance its curb appeal and value.
Repairs flagged
- Minor Paint — Some discoloration on exterior
- Minor Landscaping — Some overgrown areas
Value-add opportunities
- Both Paint exterior and interior — Enhances curb appeal and interior aesthetics
- Both Landscaping — Improves curb appeal and enhances property value
Renovation cost estimate screening
| Repair item | Severity | Est. cost |
|---|---|---|
| Paint · Some discoloration on exterior | Minor | $500–3,000 |
| Landscaping · Some overgrown areas | Minor | $500–3,000 |
| Total estimated repair cost · 2 items | $1,000–6,000 |
Value-add ROI direction
- Both Paint exterior and interior — Enhances curb appeal and interior aesthetics ↑
- Both Landscaping — Improves curb appeal and enhances property value ↑
ⓘ Cost ranges are severity-bucket heuristics (US national rule-of-thumb). Get contractor quotes + a written scope before underwriting a rehab budget.
Schools (NCES district)
- District
- Wishek 19
- NCES district ID
- 3820190
- Math proficiency
- 50% ▬ 0.00%
- Reading proficiency
- 50% ▲ 5.00%
- Median HH income
- $44,344
- Composite
- 44.27/100
- National rank
- #6173
- State rank
- #58 of 169 in ND
Livability — Wishek
- Score
- 78/100
- State rank
- #9
- US rank
- #2743
Category grades
Schools grade is shown separately in the Schools card above.
Census & demographics
- Census place
- Wishek, ND
- Population (ZIP)
- 1,203
Population outlook (McIntosh County) Hauer SSP2
- Today (2025)
- 2,626 people
- By 2030
- 2,610 · -0.6%
- By 2040
- 2,704 · +3.0%
- By 2050
- 2,823 · +7.5%
- By 2075
- 3,674 · +39.9%
- By 2100
- 4,414 · +68.1%
Race, ethnicity, and origin ACS 2023
- Neighborhood character
- Predominantly White (90%)
- Race & ethnicity
- White 90% Hispanic / Latino 5% Two or more races 1%
- Hispanic origin (detail)
- Mexican 5%
- Common ancestry
- Scotch-Irish 21% Portuguese 3% Romanian 3%
- Foreign-born
- 6% · Canada
- Languages at home
- 85% English-only · German/W. Germanic 10% Spanish 4%
Political lean MEDSL · McIntosh
- 2024 margin
- Solid R (+65.4) · D 16.6% · R 82.0% · Other 1.4%
- 2008→2024 swing
- -43.4pp toward R · 2008: -22.0pp · 2024: -65.4pp
- All cycles
- 2024: R+65.4 2020: R+61.3 2016: R+60.6 2012: R+37.9 2008: R+22.0
Not yet ingested
- Civics
- —
Market trends
- HPI YoY
- —
- Current HPI
- —
- Rent YoY
- —
- Metro
- —
- State GDP YoY
- ▲ 2.09%
- F500 in state
- 2
Industry mix (Fortune 500 HQ in ND)
| Industry | F500 HQs | Revenue |
|---|---|---|
| Utilities / Construction | 1 | $6B |
|
||
Price history
1 event — show timeline
- 2026-05-22 Listed $59,999 GNMLS
Cash-flow waterfall
monthlySold comps — $/sqft
last 12 mo · ≤1 miLoading sold comps…