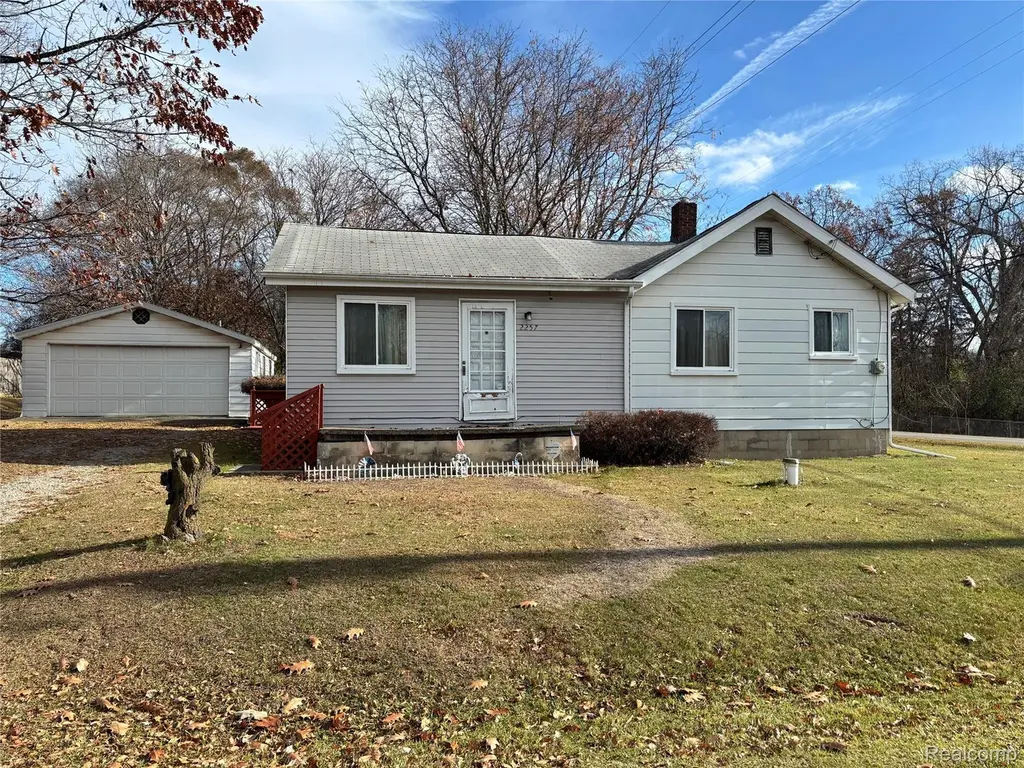
2257 Lodge Rd · Flint, MI
Flood risk 1/10 · Minimal
- FEMA flood zone
- X (unshaded)
- Chance of flooding over 30 yrs
- 0.0%
- Est. flood insurance / yr
- $473 – $860
Fire risk 1/10 · Minimal
- Est. fire insurance / yr
- $784 – $1,456
Heat risk 2/10 · Minimal
- Hot days now (above 96°F)
- 7 days/yr
- Hot days in 30 yrs
- 15 days/yr
Wind risk 2/10 · Minimal
- Chance of severe wind over 30 yrs
- —
Air-quality risk 2/10 · Minimal
- Unhealthy air days now
- 1 days/yr
- Unhealthy air days in 30 yrs
- 3 days/yr
Risk factors via First Street. Map © Google.
Why this score? — see what drove the D grade
The composite is a weighted blend of 9 inputs, each scored 0–100. Each bar is that input's sub-score; the figure is the points it added to the 100-point composite (weight × sub-score).
- Cash flow +20.0/30.0
- DSCR +6.4/10.0
- 1% rule +4.7/10.0
- Livability +3.7/5.0
- Rent growth +2.5/5.0
- Condition / age +2.5/5.0
- Schools +1.7/10.0
- ARV discount +0.0/15.0
- Appreciation +0.0/10.0
$110,000
🖨 Deal sheet 📄 Offer letter ✓ Due diligence
Listing remarks MLS
With lots of imagination and lots of TLC this house might be for you! House has so much potential for those who are looking for a 2-bedroom, 1 bath home that sits on 2 city lots a little less than a 1/2 acre! Bath has a newly remodeled walk-in shower. Wood floors throughout! Furnace approximately 7 years old, Water heater approximately 8 years, Roof approximately 12 years, newer windows. 2 car detached garage with separate heat and electricity source. Three sheds also sit on the property.
Key facts
- Wood floors
- Three sheds
- Detached garage
Tags
Neighborhood map
What this means for you Summary
Snapshot
- This is a 2-bed/1.0-bath single-family listed at $110k.
Deal economics
- At list price, monthly cash flow is $136 ($2k/yr) — positive.
- The deal already cash-flows at list — no discount required.
- To meet the 1% rule (rent ≥ 1% of price), the offer needs to be $107k (2.7% below list).
- Recommended offer: $103k (6.0% below list) — sets the bar for market timing.
- Cap rate 7.8% vs local median 11.5% in Flint — below-typical yield; the buyer is paying a premium for something (appreciation thesis, condition, location) that the cap rate doesn't capture.
Location & tenants
- Location reads 74/100 on livability (#196 in MI, #4,946 nationally) — a middle-class / working-renter tenant base. Strengths: commute A+, cost of living A+, housing A+; Watch: schools F, crime F, employment F.
- Carman-Ainsworth Community Schools (suburban): math 12% / reading 28% proficiency, ranked #468 of 540 in MI (top 87%) — low school quality limits family demand, transient renter base, plan for 1-2y turnover; 64% free/reduced lunch — lower-income household profile, screen leases tightly.
- Market conditions: 123 active listings in the ZIP; 5 comparable units currently listed for rent nearby; rentals leasing fast (median 14d on market — plan ~1-2 weeks tenant-placement turnaround); 419 units permitted in Genesee County in 2024 (68 in 5+ unit buildings).
Forward outlook
- Local home prices are declining (-3.0%/yr); year-one equity from $761 of loan paydown is wiped out by about $3k of value loss. Plan a longer hold.
- Genesee County population projected at -27% by 2050 — secular population decline; favor cash flow + early exit over multi-decade hold.
Negotiation context
- It's been on market 78 days — a 6% lower offer ($103k) is reasonable based on typical stale-listing flexibility.
- 2 sale attempts with the ask held roughly flat each time — persistent listings suggest the price (not the market) is what's stuck; bring a comps-based counter.
Risks & watch-outs
- Watch-outs: built in 1935 — expect roof / HVAC / electrical / plumbing capex.
Questions for the listing agent
- It's been on market 78 days. Have you received any prior offers? Is the seller open to a 6% concession, seller financing, or rate buy-down credit?
- Built in 1935 — when were the roof, HVAC, electrical panel, plumbing, and water heater last replaced?
- Why hasn't it sold? Are there any deal-killer items the seller is aware of (foundation, flood, title, zoning, code violations)?
- Is there a deadline driving the sale (1031 exchange, divorce, estate, relocation)? That informs how much negotiation room exists.
- Schools are F-rated, which usually means shorter tenancies and higher turnover. Who's the typical renter profile here, and what's been the actual vacancy rate?
- Crime grade is F in this area — have there been break-ins, vandalism, or insurance claims at this property in the last 3 years? What carrier currently insures it and at what premium?
- The area grade is low — what's the realistic commute time and amenity access for the typical tenant pool here? Any planned neighborhood developments (good or bad) we should know about?
- What's the average days-on-market for RENTAL listings here right now (not sales)? A rising rental-DOM trend means longer vacancies and softer asking-rent achievability than the comps imply.
- What's the recent tenant-quality profile in this submarket — average credit score on applications, eviction rate, late-payment / NSF rate, and stable-employment percentage? A property-management company in the area should have these aggregated.
- How much new for-sale + rental construction is in the pipeline within 1–3 miles? Heavy new supply typically softens prices + rents 12–24 months out; constrained supply supports both.
Investment metrics
- 1% rule
- 0.97% ✗
- Cap rate
- 7.77%
- Cash-on-cash
- 5.29%
- DSCR
- 1.24
- GRM
- 8.6
CMA / ARV
- ARV (median comp)
- $77,606
- List price
- $110,000
- Delta
- 41.74%
- Verdict
- OVERPRICED
- Comps
- 20 within 1.0 mi
Show comp detail 12 sales within ~0.75 mi
| Address | Dist | Beds/Ba | Sqft | Sold | Price | $/sf | Match |
|---|---|---|---|---|---|---|---|
| 3500 Hogarth Ave | 0.10mi | 2/1.0 | 698 (-12%) | 12mo | $60,000 | $86 | 66 |
| G 4045 Hogarth Ave | 0.22mi | 2/1.0 | 720 (-9%) | 12mo | $85,000 | $118 | 65 |
| 3321 Hogarth Ave | 0.26mi | 3/1.0 (+1) | 720 (-9%) | 4mo | $59,900 | $83 | 64 |
| 3322 Augusta St | 0.42mi | 3/1.0 (+1) | 800 (+1%) | 16mo | $56,400 | $71 | 60 |
| 1574 Houran St | 0.74mi | 2/1.0 | 798 (+1%) | 7mo | $30,000 | $38 | 58 |
| 2058 Nedra St | 0.71mi | 2/1.0 | 805 (+2%) | 12mo | $64,900 | $81 | 54 |
| 3253 Herrick St | 0.42mi | 3/1.0 (+1) | 864 (+9%) | 11mo | $115,000 | $133 | 51 |
| 2095 Pound Dr | 0.36mi | 2/1.0 | 870 (+10%) | 19mo | $19,000 | $22 | 51 |
| 4080 Beveridge Rd | 0.30mi | 2/1.0 | 675 (-15%) | 13mo | $90,000 | $133 | 51 |
| 4020 Red Wing Dr | 0.66mi | 2/1.0 | 740 (-7%) | 12mo | $68,000 | $92 | 49 |
| 3922 Hogarth Ave | 0.66mi | 3/1.0 (+1) | 910 (+15%) | 11mo | $47,500 | $52 | 31 |
| 3914 Larchmont St | 0.67mi | 3/1.0 (+1) | 900 (+14%) | 13mo | $94,000 | $104 | 30 |
Match score weights: distance 35% · size 25% · config 20% · recency 20%. Top-matched comps best support the ARV.
Projected returns pro-forma
-3.0% appreciation · 3.0% rent growth · sell at horizon
- IRR
- -8.1%
- Equity multiple
- 0.70×
- Total profit
- $-9,193
- Equity at exit
- $16,401
- IRR
- 1.4%
- Equity multiple
- 1.10×
- Total profit
- $3,068
- Equity at exit
- $9,511
Cash invested: $30,800 (down + closing). Projections, not guarantees.
Landlord ↔ Tenant lean methodology
- Overall (STATE)
- 62 Landlord-Friendly
- State Michigan
- 62 Landlord-Friendly · EVEN
- County
- — inherits STATE
- City
- — inherits STATE
ZIP-level market 48532
- Home prices YoY
- -28.9%
- Active inventory
- 123
- Price-to-rent
- 8.6×
Monthly cashflow live
- Estimated rent
- $1,071 high interval (Pro) →
- Mortgage (P&I)
- −$577
- Tax from tax record
- −$87 /mo · $1,049/yr
- Insurance
- −$46
- HOA
- −$0
- Vacancy / Maint / Mgmt
- −$225
- Net cashflow
- $136
Break-even live
UW: 25.0% down · 7.5% · 30yr · 1.5% tax · 5.0% vac · 8.0% maint · 8.0% mgmt
Financing live
Cash to close
- Down payment
- $27,500
- Closing costs
- $3,300
- Reserves months
- —
- Total cash needed
- —
Loan-product check · same deal, 3 products live
Conventional
25% down · 7.5% · 30yr
- Down + closing
- —
- Monthly P&I
- —
- Monthly cashflow
- —
- DSCR
- —
- Eligible?
- —
Personal DTI + credit; lowest rate.
DSCR
20% down · 8.5% · 30yr
- Down + closing
- —
- Monthly P&I
- —
- Monthly cashflow
- —
- DSCR
- —
- Eligible?
- —
No personal income docs; deal must DSCR.
Hard money
10% down · 12.0% · 12mo
- Down + closing
- —
- Monthly P&I
- —
- Monthly cashflow
- —
- DSCR
- —
- Eligible?
- —
Short-term bridge; refi at stabilization.
Rent comps 5 comps
| Address | Beds | Baths | Sqft | Rent | $/sqft | DOM | Units | Dist |
|---|---|---|---|---|---|---|---|---|
| 3929 Larchmont St Flint, MI | 2.0 | 1.0 | 900 | $1,100 | $1.22 | 13d | 1 | 0.63mi |
| 3901 Herrick St Flint, MI | 3.0 | 1.5 | 1100 | $1,300 | $1.18 | 13d | 1 | 0.71mi |
| 3701 Whitney Ave Flint, MI | 2.0 | 1.0 | 850 | $900 | $1.06 | 13d | 1 | 0.85mi |
| 806 Barney Ave Flint, MI | 2.0 | 1.0 | 1000 | $1,000 | $1.00 | 21d | 1 | 1.26mi |
| 1415 S Linden Rd Flint, MI | 2.0 | 1.0 | 1000 | $1,000 | $1.00 | 13d | 1 | 1.33mi |
Listing history 17 events
-
2026-06-18days on market $110,000 Active 78 DOM
-
2026-06-17days on market $110,000 Active 77 DOM
-
2026-06-16days on market $110,000 Active 76 DOM
-
2026-06-15days on market $110,000 Active 75 DOM
-
2026-06-14days on market $110,000 Active 73 DOM
-
2026-06-13days on market $110,000 Active 72 DOM
-
2026-06-10days on market $110,000 Active 70 DOM
-
2026-06-09days on market $110,000 Active 69 DOM
-
2026-06-08days on market $110,000 Active 68 DOM
-
2026-06-07days on market $110,000 Active 67 DOM
-
2026-06-05days on market $110,000 Active 64 DOM
-
2026-06-02days on market $110,000 Active 62 DOM
-
2026-06-01days on market $110,000 Active 61 DOM
-
2026-05-31days on market $110,000 Active 60 DOM
-
2026-05-30days on market $110,000 Active 59 DOM
-
2026-04-01$110,000 Active 497-char remark
Show marketing remark (493 chars)
With lots of imagination and lots of TLC this house might be for you! House has so much potential for those who are looking for a 2-bedroom, 1 bath home that sits on 2 city lots a little less than a 1/2 acre! Bath has a newly remodeled walk-in shower. Wood floors throughout! Furnace approximately 7 years old, Water heater approximately 8 years, Roof approximately 12 years, newer windows. 2 car detached garage with separate heat and electricity source. Three sheds also sit on the property.
-
2026-04-01$110,000 Active 493-char remark
Show marketing remark (493 chars)
With lots of imagination and lots of TLC this house might be for you! House has so much potential for those who are looking for a 2-bedroom, 1 bath home that sits on 2 city lots a little less than a 1/2 acre! Bath has a newly remodeled walk-in shower. Wood floors throughout! Furnace approximately 7 years old, Water heater approximately 8 years, Roof approximately 12 years, newer windows. 2 car detached garage with separate heat and electricity source. Three sheds also sit on the property.
ⓘ Source: listings_history table (triggers on properties + properties_extension) + one-shot
backfill from property_details.listing_events for pre-trigger history.
Tax reassessment forecast MI · Partial reset (capped growth)
- Current annual tax
- $1,049 · $87/mo
- Projected year-2 tax
- $1,372 · $114/mo
- Expected delta
- +$322/yr (+$27/mo · 30.7%)
ⓘ Screening estimate from a state-policy table — verify with the county assessor before closing.
Climate risk First Street
- Flood 1/10 Low FEMA zone X (unshaded) · 0% chance over 30 yrs
- Wildfire 1/10 Low
- Heat 2/10 Low 7 d/yr ≥96°F today · 15 d/yr by 30 yrs out
- Wind 2/10 Low
- Air quality 2/10 Low 1 unhealthy d/yr today · 3 by 30 yrs out
Nearby sold comps map
Loading sold comps map…
Walkable amenities ~0.75 mi
Loading nearby amenities…
Taxation est. · year 1
- Rental income
- $12,849
- − Mortgage interest
- −$6,162
- − Property taxes
- −$1,049
- − Insurance
- −$550
- − Repairs & maintenance
- −$1,028
- − Management
- −$1,028
- − Depreciation
- −$3,200
- Taxable loss
- −$168
- Est. tax savings @ 24.0%
- +$40
- After-tax cash flow
- $1,669/yr
For passive investors: Depreciation is non-cash, so a rental often shows a tax loss while cash-flowing — sheltering income. Rental losses are passive: they offset passive income freely, and up to $25,000/yr can offset ordinary (W-2) income if you actively participate and your MAGI is under $100k (phasing out to $0 by $150k); unused losses carry forward. On sale, claimed depreciation is recaptured at up to 25%, and gains may owe capital-gains tax (a 1031 exchange can defer both). Figures are a year-1 estimate at your 24.0% rate — not tax advice; consult a CPA.
Schools (NCES district)
- District
- Carman-Ainsworth Community Schools
- NCES district ID
- 2607890
- Math proficiency
- 12% ▼ -14.00%
- Reading proficiency
- 28% ▼ -8.00%
- Median HH income
- $39,394
- Composite
- 16.84/100
- National rank
- #9149
- State rank
- #468 of 540 in MI
Livability — Flint
- Score
- 74/100
- State rank
- #196
- US rank
- #4946
Category grades
Schools grade is shown separately in the Schools card above.
Census & demographics
- City population
- 93,814
- Population (ZIP)
- 19,750
Population outlook (Genesee County) Hauer SSP2
- Today (2025)
- 381,312 people
- By 2030
- 362,731 · -4.9%
- By 2040
- 321,550 · -15.7%
- By 2050
- 279,212 · -26.8%
- By 2075
- 193,336 · -49.3%
- By 2100
- 128,118 · -66.4%
Race, ethnicity, and origin ACS 2023
- Neighborhood character
- Diverse neighborhood (Simpson 0.59)
- Race & ethnicity
- White 51% Black 38% Two or more races 7% Hispanic / Latino 4%
- Common ancestry
- Romanian 4% Lithuanian 1% Italian 1%
- Foreign-born
- 4% · Canada
- Languages at home
- 94% English-only · Arabic 3% Spanish 1%
Political lean MEDSL · Genesee
- 2024 margin
- Toss-up / Even · D 51.4% · R 47.2% · Other 1.4%
- 2008→2024 swing
- -28.3pp toward R · 2008: 32.5pp · 2024: 4.2pp
- All cycles
- 2024: D+4.2 2020: D+9.3 2016: D+9.5 2012: D+28.2 2008: D+32.5
Not yet ingested
- Civics
- —
Market trends
- HPI YoY
- ▼ -82.08%
- Current HPI
- 202.407
- Rent YoY
- —
- Metro
- —
- State GDP YoY
- ▲ 1.37%
- F500 in state
- 28
Industry mix (Fortune 500 HQ in MI)
| Industry | F500 HQs | Revenue |
|---|---|---|
| Automotive Parts | 3 | $48B |
|
||
| Automotive | 2 | $372B |
|
||
| Chemicals | 1 | $45B |
|
||
| Automotive Retail | 1 | $29B |
|
||
| Healthcare / Medical Devices | 1 | $23B |
|
||
| Automotive Technology | 1 | $20B |
|
||
Price history
+0.0% since first listed2 events — show timeline
- 2026-04-01 Listed $110,000 MiRealSource-MiMLS
- 2026-04-01 Listed $110,000 REALCOMP
Property tax history
+2.4%/yrLatest (2025): $1,049 · +2.5% YoY. Source: county tax records.
Cash-flow waterfall
monthlySold comps — $/sqft
last 12 mo · ≤1 miLoading sold comps…