1100 Price Br · Westwood, KY
Flood risk No data
- FEMA flood zone
- —
- Chance of flooding over 30 yrs
- —
- Est. flood insurance / yr
- —
Fire risk No data
- Est. fire insurance / yr
- —
Heat risk No data
- Hot days now (above threshold)
- —
- Hot days in 30 yrs
- —
Wind risk No data
- Chance of severe wind over 30 yrs
- —
Air-quality risk No data
- Unhealthy air days now
- —
- Unhealthy air days in 30 yrs
- —
Risk factors via First Street. Map © Google.
Why this score? — see what drove the C- grade
The composite is a weighted blend of 9 inputs, each scored 0–100. Each bar is that input's sub-score; the figure is the points it added to the 100-point composite (weight × sub-score).
- Cash flow +15.6/30.0
- ARV discount +9.6/15.0
- Appreciation +7.0/10.0
- DSCR +4.8/10.0
- 1% rule +4.3/10.0
- Livability +3.2/5.0
- Rent growth +2.5/5.0
- Schools +2.5/10.0
- Condition / age +2.5/5.0
$94,999
🖨 Deal sheet 📄 Offer letter ✓ Due diligence
Listing remarks
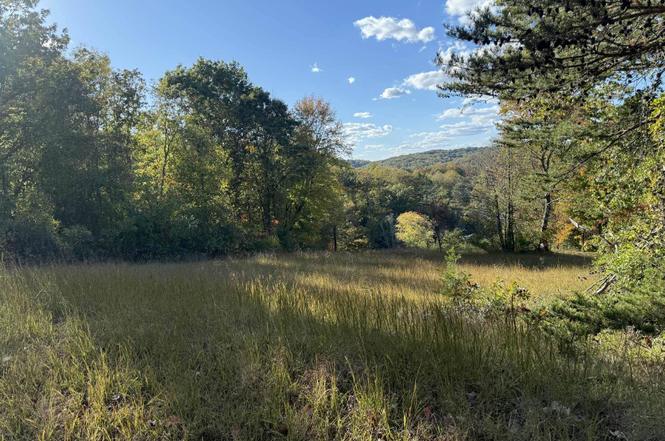
Discover the perfect blend of space, privacy, and potential with this 10.29+/-acre property offering multiple possibilities for your dream project. Whether you envision a private homestead surrounded by nature or plan to divide and develop, this property has it all. The land features a beautiful mix of level, rolling, and wooded terrain, providing a variety of ideal building sites to choose from. Tucked on the property is an existing 2-bedroom, 1-bath cottage — not currently habitable, but ready for restoration or replacement. With multiple build sites, this land offers the flexibility to create exactly what you imagine — from a single dream home with plenty of space to roam, to
Key facts
- 10.29 acre property
- Peaceful setting
- Existing cottage
Tags
Property features AI
Finance
- Other:
- Financial info:
- HOA & community:
Exterior
- Parking:
- Security:
- Utilities:
- Home design: Single family residence; Residential property
- Construction: 948 above-grade finished square feet
- Exterior features: Approximately 10.29 acres
Interior
- Kitchen:
- Bedrooms:
- Flooring:
- Bathrooms: 1 full bathroom
- Heating & cooling:
- Interior features: 5 total rooms
- Laundry & utility:
Neighborhood map
What this means for you Summary
Snapshot
- This is a 2-bed/1.0-bath single-family listed at $95k.
Deal economics
- At list price, monthly cash flow is $40 ($480/yr) — positive.
- The deal already cash-flows at list — no discount required.
- To meet the 1% rule (rent ≥ 1% of price), the offer needs to be $88k (7.2% below list).
- Recommended offer: $84k (12.0% below list) — sets the bar for market timing.
- Cap rate 6.8% vs local median 5.1% in Westwood — top-decile yield for the area; either an underpriced asset or a hidden risk that comps aren't pricing in. Stress-test before assuming the spread holds.
Location & tenants
- Location reads 65/100 on livability (#267 in KY) — a middle-class / working-renter tenant base. Strengths: cost of living A+, housing A+, crime A; Watch: schools C-, employment D, amenities F.
- Boyd County (suburban): math 20% / reading 37% proficiency, ranked #115 of 165 in KY (top 70%) — low school quality limits family demand, transient renter base, plan for 1-2y turnover.
- Market conditions: 65 active listings in the ZIP; 2 units permitted in Boyd County in 2024 (0 in 5+ unit buildings).
Forward outlook
- In year one you build about $4k of equity ($657 loan paydown + $4k appreciation (4.0% local appreciation)).
- Boyd County population projected at -17% by 2050 — secular population decline; favor cash flow + early exit over multi-decade hold.
- At projected returns (4.0% appreciation + 3.0% rent growth), your $27k cash investment doubles in ~5 years — after that, you're playing with house money.
- By year 8, paydown + projected appreciation supports a ~$33k cash-out refi (75% LTV) — recoverable capital for the next deal without selling this one.
Negotiation context
- It's been on market 237 days — a 12% lower offer ($84k) is reasonable based on typical stale-listing flexibility.
Questions for the listing agent
- It's been on market 237 days. Have you received any prior offers? Is the seller open to a 12% concession, seller financing, or rate buy-down credit?
- Why hasn't it sold? Are there any deal-killer items the seller is aware of (foundation, flood, title, zoning, code violations)?
- Is there a deadline driving the sale (1031 exchange, divorce, estate, relocation)? That informs how much negotiation room exists.
- What's the average days-on-market for RENTAL listings here right now (not sales)? A rising rental-DOM trend means longer vacancies and softer asking-rent achievability than the comps imply.
- What's the recent tenant-quality profile in this submarket — average credit score on applications, eviction rate, late-payment / NSF rate, and stable-employment percentage? A property-management company in the area should have these aggregated.
- How much new for-sale + rental construction is in the pipeline within 1–3 miles? Heavy new supply typically softens prices + rents 12–24 months out; constrained supply supports both.
Investment metrics
- 1% rule
- 0.93% ✗
- Cap rate
- 6.80%
- Cash-on-cash
- 1.80%
- DSCR
- 1.08
- GRM
- 9.0
CMA / ARV
- ARV (on-the-fly)
- $99,540
- Comps found
- 2
Show comp detail 2 sales within ~0.75 mi
| Address | Dist | Beds/Ba | Sqft | Sold | Price | $/sf | Match |
|---|---|---|---|---|---|---|---|
| 1625 New Buckley Rd | 0.39mi | 2/1.0 | 948 (0%) | 15mo | $85,000 | $90 | 69 |
| 433 Cabell St | 0.41mi | 2/1.0 | 906 (-4%) | 9mo | $95,400 | $105 | 66 |
Match score weights: distance 35% · size 25% · config 20% · recency 20%. Top-matched comps best support the ARV.
Projected returns pro-forma
3.98% appreciation · 3.0% rent growth · sell at horizon
- IRR
- 11.8%
- Equity multiple
- 1.72×
- Total profit
- $19,023
- Equity at exit
- $48,056
- IRR
- 13.4%
- Equity multiple
- 3.19×
- Total profit
- $58,236
- Equity at exit
- $78,511
Cash invested: $26,600 (down + closing). Projections, not guarantees.
Landlord ↔ Tenant lean methodology
- Overall (STATE)
- 83 Strongly Landlord-Friendly
- State Kentucky
- 83 Strongly Landlord-Friendly · R+16
- County
- — inherits STATE
- City
- — inherits STATE
ZIP-level market 41102
- Home prices YoY
- 1.4%
- Active inventory
- 65
- Price-to-rent
- 9.0×
Monthly cashflow live
- Estimated rent
- $882 medium interval (Pro) →
- Mortgage (P&I)
- −$498
- Tax est. 1.5%
- −$119 /mo · $1,425/yr
- Insurance
- −$40
- HOA
- −$0
- Vacancy / Maint / Mgmt
- −$185
- Net cashflow
- $40
Break-even live
UW: 25.0% down · 7.5% · 30yr · 1.5% tax · 5.0% vac · 8.0% maint · 8.0% mgmt
Financing live
Cash to close
- Down payment
- $23,750
- Closing costs
- $2,850
- Reserves months
- —
- Total cash needed
- —
Loan-product check · same deal, 3 products live
Conventional
25% down · 7.5% · 30yr
- Down + closing
- —
- Monthly P&I
- —
- Monthly cashflow
- —
- DSCR
- —
- Eligible?
- —
Personal DTI + credit; lowest rate.
DSCR
20% down · 8.5% · 30yr
- Down + closing
- —
- Monthly P&I
- —
- Monthly cashflow
- —
- DSCR
- —
- Eligible?
- —
No personal income docs; deal must DSCR.
Hard money
10% down · 12.0% · 12mo
- Down + closing
- —
- Monthly P&I
- —
- Monthly cashflow
- —
- DSCR
- —
- Eligible?
- —
Short-term bridge; refi at stabilization.
Listing history 16 events
-
2026-06-18days on market $94,999 Active 237 DOM
-
2026-06-17days on market $94,999 Active 236 DOM
-
2026-06-16days on market $94,999 Active 235 DOM
-
2026-06-15days on market $94,999 Active 234 DOM
-
2026-06-13days on market $94,999 Active 232 DOM
-
2026-06-12days on market $94,999 Active 231 DOM
-
2026-06-08days on market $94,999 Active 227 DOM
-
2026-06-07days on market $94,999 Active 226 DOM
-
2026-06-07days on market $94,999 Active 225 DOM
-
2026-06-04days on market $94,999 Active 222 DOM
-
2026-06-02days on market $94,999 Active 221 DOM
-
2026-06-01days on market $94,999 Active 220 DOM
-
2026-05-31days on market $94,999 Active 219 DOM
-
2026-05-31days on market $94,999 Active 218 DOM
-
2026-03-23price $94,999
-
2025-10-24$99,900 Active
ⓘ Source: listings_history table (triggers on properties + properties_extension) + one-shot
backfill from property_details.listing_events for pre-trigger history.
Nearby sold comps map
Loading sold comps map…
Walkable amenities ~0.75 mi
Loading nearby amenities…
Taxation est. · year 1
- Rental income
- $10,580
- − Mortgage interest
- −$5,321
- − Property taxes
- −$1,425
- − Insurance
- −$475
- − Repairs & maintenance
- −$846
- − Management
- −$846
- − Depreciation
- −$2,764
- Taxable loss
- −$1,098
- Est. tax savings @ 24.0%
- +$264
- After-tax cash flow
- $743/yr
For passive investors: Depreciation is non-cash, so a rental often shows a tax loss while cash-flowing — sheltering income. Rental losses are passive: they offset passive income freely, and up to $25,000/yr can offset ordinary (W-2) income if you actively participate and your MAGI is under $100k (phasing out to $0 by $150k); unused losses carry forward. On sale, claimed depreciation is recaptured at up to 25%, and gains may owe capital-gains tax (a 1031 exchange can defer both). Figures are a year-1 estimate at your 24.0% rate — not tax advice; consult a CPA.
Schools (NCES district)
- District
- Boyd County
- NCES district ID
- 2100620
- Math proficiency
- 20% ▼ -18.00%
- Reading proficiency
- 37% ▼ -17.00%
- Median HH income
- $47,479
- Composite
- 24.65/100
- National rank
- #7625
- State rank
- #115 of 165 in KY
Livability — Westwood
- Score
- 65/100
- State rank
- #267
- US rank
- #13071
Category grades
Schools grade is shown separately in the Schools card above.
Census & demographics
- Census place
- Westwood, KY
- Population (ZIP)
- 20,779
Population outlook (Boyd County) Hauer SSP2
- Today (2025)
- 46,137 people
- By 2030
- 44,585 · -3.4%
- By 2040
- 41,442 · -10.2%
- By 2050
- 38,313 · -17.0%
- By 2075
- 31,077 · -32.6%
- By 2100
- 23,432 · -49.2%
Race, ethnicity, and origin ACS 2023
- Neighborhood character
- Predominantly White (93%)
- Race & ethnicity
- White 93% Two or more races 3% Black 3% Hispanic / Latino 1%
- Common ancestry
- Serbian 4% Italian 3% Slovak 1%
- Foreign-born
- 1% · Canada
Political lean MEDSL · Boyd
- 2024 margin
- Solid R (+38.5) · D 30.0% · R 68.6% · Other 1.4%
- 2008→2024 swing
- -26.2pp toward R · 2008: -12.3pp · 2024: -38.5pp
- All cycles
- 2024: R+38.5 2020: R+33.2 2016: R+37.0 2012: R+16.3 2008: R+12.3
Not yet ingested
- Civics
- —
Market trends
- HPI YoY
- ▲ 3.98%
- Current HPI
- 299.41
- Rent YoY
- —
- Metro
- —
- State GDP YoY
- ▲ 1.81%
- F500 in state
- 4
Industry mix (Fortune 500 HQ in KY)
| Industry | F500 HQs | Revenue |
|---|---|---|
| Healthcare | 1 | $118B |
|
||
| Food / Beverage | 1 | $7B |
|
||
Price history
-4.9% since first listed2 events — show timeline
- 2026-03-23 Price Changed $94,999 AABOR
- 2025-10-24 Listed $99,900 AABOR
Cash-flow waterfall
monthlySold comps — $/sqft
last 12 mo · ≤1 miLoading sold comps…