 Duplex
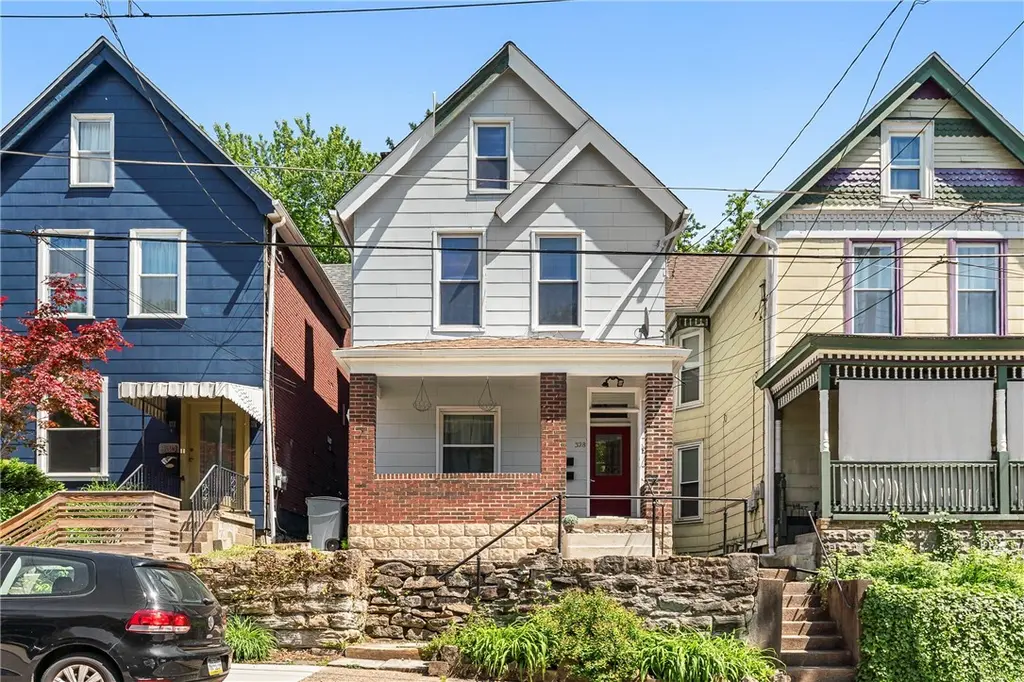
328 Pitt St · Wilkinsburg, PA
Flood risk 1/10 · Minimal
- FEMA flood zone
- X (unshaded)
- Chance of flooding over 30 yrs
- 0.0%
- Est. flood insurance / yr
- $473 – $860
Fire risk 1/10 · Minimal
- Est. fire insurance / yr
- $511 – $949
Heat risk 4/10 · Minor
- Hot days now (above 98°F)
- 7 days/yr
- Hot days in 30 yrs
- 17 days/yr
Wind risk 2/10 · Minimal
- Chance of severe wind over 30 yrs
- 0.0%
Air-quality risk 4/10 · Minor
- Unhealthy air days now
- 4 days/yr
- Unhealthy air days in 30 yrs
- 5 days/yr
Risk factors via First Street. Map © Google.
Why this score? — see what drove the C- grade
The composite is a weighted blend of 9 inputs, each scored 0–100. Each bar is that input's sub-score; the figure is the points it added to the 100-point composite (weight × sub-score).
- Cash flow +21.0/30.0
- ARV discount +7.5/15.0
- DSCR +6.7/10.0
- 1% rule +5.1/10.0
- Livability +3.8/5.0
- Rent growth +3.5/5.0
- Condition / age +2.5/5.0
- Schools +1.5/10.0
- Appreciation +0.0/10.0
$294,000
🖨 Deal sheet 📄 Offer letter ✓ Due diligence
Multi-family units
County records classify this as Multi-Family (2-4 Unit). Listing-text estimate: 2 units. confirmed
Listing remarks
Welcome to 328 Pitt Street, a well-maintained and thoughtfully updated duplex ideally situated in the vibrant Wilkinsburg/Regent Square/Edgewood corridor. This solid investment or owner-occupant opportunity features extensive improvements, including full insulation in the walls and attic, updated electrical with separate panels and meters, a roof replacement approximately six years ago, and newer windows. Additional updates include modern lighting, ceiling fans, and a newer main entry door. A shared entry foyer provides convenient access to both units and the basement. The occupied first-floor apartment offers a spacious living room, a fully equipped eat-in kitchen, two comfortable bedrooms
Key facts
- Updated electrical
- Roof replacement
- Newer windows
Tags
Property features AI
Finance
- Financial info: One unit currently vacant; the other unit rents for $950
Exterior
- Parking: On-street parking
- Utilities: Electricity available; Natural gas available; Public sewer; Public water
- Home design: Two-unit property
- Construction: Frame construction; Asphalt roof
- Exterior features: R2 zoning; Public transportation nearby
Interior
- Bedrooms: One unit with 3 bedrooms; One unit with 2 bedrooms
- Bathrooms: Each unit has 1 full bathroom
- Interior features: Unfinished basement
Neighborhood map
What this means for you Summary
Snapshot
- This is a 2 × 2-bed/1.0-bath units multifamily listed at $294k.
Deal economics
- At list price, monthly cash flow is $413 ($5k/yr) — positive. Per door: $206/mo.
- The deal already cash-flows at list — no discount required.
- Meets the 1% rule at list price ($3k rent vs $294k).
- Cap rate 8.0% vs local median 11.3% in Wilkinsburg — below-typical yield; the buyer is paying a premium for something (appreciation thesis, condition, location) that the cap rate doesn't capture.
Location & tenants
- Location reads 76/100 on livability (#411 in PA, #3,754 nationally) — a middle-class / working-renter tenant base. Strengths: commute A+, cost of living A+, housing A+; Watch: schools D+, health & safety D+, crime F.
- Wilkinsburg Borough SD (suburban): math 14% / reading 23% proficiency, ranked #503 of 539 in PA (top 93%) — low school quality limits family demand, transient renter base, plan for 1-2y turnover; 96% free/reduced lunch — lower-income household profile, screen leases tightly.
- Market conditions: Rents rising (+3.9%/yr); 118 active listings in the ZIP; 7 comparable units currently listed for rent nearby; rentals lingering (median 44d on market — plan ~5-8 weeks vacancy on turnover, expect pricing pressure); 57% of comp listings sitting > 30 days — soft ceiling on asking rent; 2,996 units permitted in Allegheny County in 2024 (1,588 in 5+ unit buildings).
- At $2,961/mo this rent would consume 65% of the median local household income ($55k/yr) (locally 1933% of renters already pay >50% of income on rent) — very limited rent-growth headroom before tenants either downsize or default.
Forward outlook
- Local home prices are declining (-3.0%/yr); year-one equity from $2k of loan paydown is wiped out by about $9k of value loss. Plan a longer hold.
Negotiation context
- Only 6 days on market — expect competitive offers; lowballing is unlikely to land.
- Current owner paid $24k; list at $294k implies a 1151% gain — meaningful room to come down on a strong offer.
Risks & watch-outs
- Watch-outs: built in 1900 — expect roof / HVAC / electrical / plumbing capex.
Questions for the listing agent
- Can we see the unit-by-unit rent roll, current vacancy, and any below-market leases? What's the average tenancy length?
- What capital expenditures (roof, boiler, parking lot, exteriors) have been made in the last 5 years, and what's planned in the next 2?
- Built in 1900 — when were the roof, HVAC, electrical panel, plumbing, and water heater last replaced?
- Is there a deadline driving the sale (1031 exchange, divorce, estate, relocation)? That informs how much negotiation room exists.
- Schools are D-rated, which usually means shorter tenancies and higher turnover. Who's the typical renter profile here, and what's been the actual vacancy rate?
- Crime grade is F in this area — have there been break-ins, vandalism, or insurance claims at this property in the last 3 years? What carrier currently insures it and at what premium?
- What's the average days-on-market for RENTAL listings here right now (not sales)? A rising rental-DOM trend means longer vacancies and softer asking-rent achievability than the comps imply.
- What's the recent tenant-quality profile in this submarket — average credit score on applications, eviction rate, late-payment / NSF rate, and stable-employment percentage? A property-management company in the area should have these aggregated.
- How much new apartment / multifamily construction is in the pipeline within 1–3 miles? Heavy new supply (>2% of stock underway) typically softens rents 12–24 months out; light construction supports rent growth.
Investment metrics
- 1% rule
- 1.01% ✓
- Cap rate
- 7.98%
- Cash-on-cash
- 6.02%
- DSCR
- 1.27
- GRM
- 8.3
CMA / ARV
No comps found within radius.
Projected returns pro-forma
-3.0% appreciation · 3.86% rent growth · sell at horizon
- IRR
- -6.1%
- Equity multiple
- 0.77×
- Total profit
- $-18,773
- Equity at exit
- $43,836
- IRR
- 4.5%
- Equity multiple
- 1.34×
- Total profit
- $28,232
- Equity at exit
- $25,420
Cash invested: $82,320 (down + closing). Projections, not guarantees.
Landlord ↔ Tenant lean methodology
- Overall (STATE)
- 62 Landlord-Friendly
- State Pennsylvania
- 62 Landlord-Friendly · EVEN
- County
- — inherits STATE
- City
- — inherits STATE
ZIP-level market 15221
- Home prices YoY
- -32.3%
- Rents YoY
- 3.9%
- Active inventory
- 118
- Price-to-rent
- 16.5×
Monthly cashflow live
- Estimated rent
- $2,961 high interval (Pro) →
- Mortgage (P&I)
- −$1,542
- Tax from tax record
- −$262 /mo · $3,143/yr
- Insurance
- −$122
- HOA
- −$0
- Vacancy / Maint / Mgmt
- −$622
- Net cashflow
- $413
Break-even live
2-unit breakdown (identical units grouped — click to expand)
| Units | Beds | Baths | Est. rent |
|---|---|---|---|
| 2× units | 2 | 1 | $2,962 |
| #1 | 2 | 1 | $1,481 |
| #2 | 2 | 1 | $1,481 |
| Total (2 units) | $2,961 | ||
UW: 25.0% down · 7.5% · 30yr · 1.5% tax · 5.0% vac · 8.0% maint · 8.0% mgmt
Financing live
Cash to close
- Down payment
- $73,500
- Closing costs
- $8,820
- Reserves months
- —
- Total cash needed
- —
Loan-product check · same deal, 3 products live
Conventional
25% down · 7.5% · 30yr
- Down + closing
- —
- Monthly P&I
- —
- Monthly cashflow
- —
- DSCR
- —
- Eligible?
- —
Personal DTI + credit; lowest rate.
DSCR
20% down · 8.5% · 30yr
- Down + closing
- —
- Monthly P&I
- —
- Monthly cashflow
- —
- DSCR
- —
- Eligible?
- —
No personal income docs; deal must DSCR.
Hard money
10% down · 12.0% · 12mo
- Down + closing
- —
- Monthly P&I
- —
- Monthly cashflow
- —
- DSCR
- —
- Eligible?
- —
Short-term bridge; refi at stabilization.
Rent comps 7 comps
| Address | Beds | Baths | Sqft | Rent | $/sqft | DOM | Units | Dist |
|---|---|---|---|---|---|---|---|---|
| 745 Franklin Ave Pittsburgh, PA | 4.0 | 2.0 | 1948 | $1,599 | $0.82 | 43d | 1 | 0.34mi |
| 515 Hill Ave Pittsburgh, PA | 4.0 | 1.0 | 1628 | $1,300 | $0.80 | 43d | 1 | 0.60mi |
| 1030 Ross Ave Pittsburgh, PA | 4.0 | 3.5 | 2856 | $2,200 | $0.77 | 1d | 1 | 0.61mi |
| 1148 East St Pittsburgh, PA | 3.0 | 3.0 | 1738 | $1,700 | $0.98 | 43d | 1 | 0.88mi |
| 2219 Manor Ave Pittsburgh, PA | 3.0 | 1.0 | 1638 | $1,600 | $0.98 | 23d | 1 | 1.30mi |
| 7009 Church St Pittsburgh, PA | 3.0 | 2.0 | 1800 | $1,550 | $0.86 | 43d | 1 | 1.35mi |
| 7138 Race St Pittsburgh, PA | 5.0 | 2.0 | 2500 | $2,500 | $1.00 | 1d | 1 | 1.41mi |
Listing history 6 events
-
2026-06-18days on market $294,000 Active 6 DOM
-
2026-06-17days on market $294,000 Active 5 DOM
-
2026-06-16days on market $294,000 Active 4 DOM
-
2026-06-15days on market $294,000 Active 3 DOM
-
2026-06-13remarks 699-char remark
-
2026-06-13$294,000 Active 1 DOM
ⓘ Source: listings_history table (triggers on properties + properties_extension) + one-shot
backfill from property_details.listing_events for pre-trigger history.
Tax reassessment forecast PA · Partial reset (capped growth)
- Current annual tax
- $3,143 · $262/mo
- Projected year-2 tax
- $3,894 · $325/mo
- Expected delta
- +$751/yr (+$63/mo · 23.9%)
ⓘ Screening estimate from a state-policy table — verify with the county assessor before closing.
Climate risk First Street
- Flood 1/10 Low FEMA zone X (unshaded) · 0% chance over 30 yrs
- Wildfire 1/10 Low
- Heat 4/10 Moderate 7 d/yr ≥98°F today · 17 d/yr by 30 yrs out
- Wind 2/10 Low 0% chance of damaging wind over 30 yrs
- Air quality 4/10 Moderate 4 unhealthy d/yr today · 5 by 30 yrs out
Nearby sold comps map
Loading sold comps map…
Walkable amenities ~0.75 mi
Loading nearby amenities…
Taxation est. · year 1
- Rental income
- $35,532
- − Mortgage interest
- −$16,469
- − Property taxes
- −$3,143
- − Insurance
- −$1,470
- − Repairs & maintenance
- −$2,843
- − Management
- −$2,843
- − Depreciation
- −$8,553
- Taxable income
- $212
- Est. tax owed @ 24.0%
- −$51
- After-tax cash flow
- $4,905/yr
For passive investors: Depreciation is non-cash, so a rental often shows a tax loss while cash-flowing — sheltering income. Rental losses are passive: they offset passive income freely, and up to $25,000/yr can offset ordinary (W-2) income if you actively participate and your MAGI is under $100k (phasing out to $0 by $150k); unused losses carry forward. On sale, claimed depreciation is recaptured at up to 25%, and gains may owe capital-gains tax (a 1031 exchange can defer both). Figures are a year-1 estimate at your 24.0% rate — not tax advice; consult a CPA.
Schools (NCES district)
- District
- Wilkinsburg Borough SD
- NCES district ID
- 4226370
- Math proficiency
- 14% ▼ -8.00%
- Reading proficiency
- 23% ▼ -9.00%
- Median HH income
- $32,204
- Composite
- 14.94/100
- National rank
- #9368
- State rank
- #503 of 539 in PA
Livability — Wilkinsburg
- Score
- 76/100
- State rank
- #411
- US rank
- #3754
Category grades
Schools grade is shown separately in the Schools card above.
Census & demographics
- Census place
- Wilkinsburg, PA
- County
- Allegheny County · 1,022,028 people
- City population
- 29,513
- Metro
- Pittsburgh, PA
- Population (ZIP)
- 29,374
- Household income
- $55,028
- Rent vs Own
- Severe rent burden
- 1933.0
Population outlook (Allegheny County) Hauer SSP2
- Today (2025)
- 1,250,282 people
- By 2030
- 1,256,482 · +0.5%
- By 2040
- 1,256,318 · +0.5%
- By 2050
- 1,244,169 · -0.5%
- By 2075
- 1,197,693 · -4.2%
- By 2100
- 1,093,187 · -12.6%
Race, ethnicity, and origin ACS 2023
- Neighborhood character
- Diverse neighborhood (Simpson 0.60)
- Race & ethnicity
- White 47% Black 43% Two or more races 7% Hispanic / Latino 4% Asian 1%
- Common ancestry
- Romanian 4% Lithuanian 2% Serbian 1%
- Foreign-born
- 4% · Canada, South Korea, China
- Languages at home
- 93% English-only · Spanish 2% French/Haitian/Cajun 1% Other Indo-European 1%
Political lean MEDSL · Allegheny
- 2024 margin
- Strong D (+20.3) · D 59.7% · R 39.4%
- 2008→2024 swing
- +4.8pp toward D · 2008: 15.5pp · 2024: 20.3pp
- All cycles
- 2024: D+20.3 2020: D+20.4 2016: D+16.4 2012: D+14.4 2008: D+15.5
Not yet ingested
- Civics
- —
Market trends
- HPI YoY
- ▼ -109.77%
- Current HPI
- 230.0486
- Rent YoY
- ▲ 3.86%
- Metro
- Pittsburgh, PA
- State GDP YoY
- ▲ 1.68%
- F500 in state
- 34
Industry mix (Fortune 500 HQ in PA)
| Industry | F500 HQs | Revenue |
|---|---|---|
| Healthcare | 2 | $309B |
|
||
| Insurance | 2 | $27B |
|
||
| Telecommunications / Media | 1 | $124B |
|
||
| Industrial Distribution | 1 | $22B |
|
||
| Financial Services | 1 | $20B |
|
||
| Chemicals / Materials | 1 | $18B |
|
||
Price history
+1151.1% since first listed2 events — show timeline
- 2026-06-11 Listed $294,000 West Penn MLS
- 1981-10-02 Sold (Public Records) $23,500 Public Records
Property tax history
-0.6%/yrLatest (2026): $3,143 · +3.0% YoY. Source: county tax records.
Cash-flow waterfall
monthlySold comps — $/sqft
last 12 mo · ≤1 miLoading sold comps…