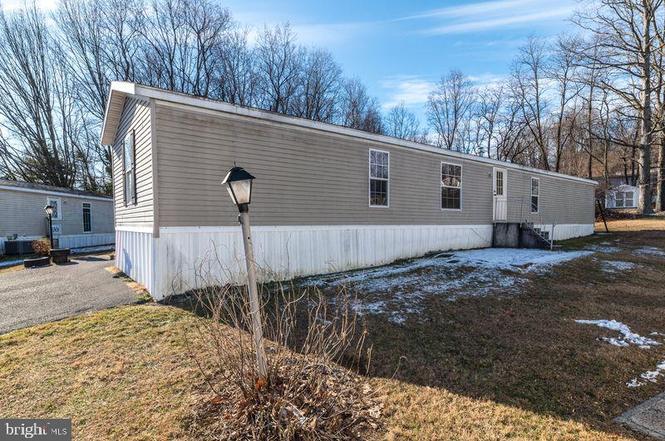
100 Waldon Cir · Longswamp, PA
Flood risk 4/10 · Minor
- FEMA flood zone
- X (unshaded)
- Chance of flooding over 30 yrs
- 0.24%
- Est. flood insurance / yr
- $507 – $1,088
Fire risk 5/10 · Moderate
- Est. fire insurance / yr
- $511 – $949
Heat risk 3/10 · Minor
- Hot days now (above 99°F)
- 6 days/yr
- Hot days in 30 yrs
- 13 days/yr
Wind risk 4/10 · Minor
- Chance of severe wind over 30 yrs
- 17.0%
Air-quality risk 3/10 · Minor
- Unhealthy air days now
- 2 days/yr
- Unhealthy air days in 30 yrs
- 3 days/yr
Risk factors via First Street. Map © Google.
Why this score? — see what drove the D+ grade
The composite is a weighted blend of 9 inputs, each scored 0–100. Each bar is that input's sub-score; the figure is the points it added to the 100-point composite (weight × sub-score).
- Cash flow +15.0/30.0
- ARV discount +7.5/15.0
- Schools +5.2/10.0
- 1% rule +5.0/10.0
- DSCR +5.0/10.0
- Rent growth +2.5/5.0
- Livability +2.5/5.0
- Condition / age +2.5/5.0
- Appreciation +0.0/10.0
$47,000
🖨 Deal sheet (PDF) 📄 Offer letter ✓ Due diligence
Listing remarks
Welcome to 100 Waldon Circle. This three bedroom two full bath home is ready for you, it's new owner!! Great floor plan!! Plenty of natural light. Situated at the end of a cul-de-sac. Enter into the living room and turn right to find the second and third bedrooms and full bathroom. Back through the living room you will love the large open eat-in kitchen with tons of storage and counter space. The laundry room and back entrance are conveniently located around the corner. Washer, dryer, and refrigerator stay with the sale. Through the kitchen on the other end is the main bedroom with ensuite and large closet. This home needs some TLC. Carpets were removed to save the new owner the cost of t
Key facts
- Large closet
- Tons of storage
- Cul-de-sac
Tags
Property features AI
Finance
- Other: Ownership listed as land lease
- Financial info: Land lease has approximately 1 year remaining; Annual ground rent listed under income/expense
- HOA & community: Monthly land lease / association fee of $615; HOA fee includes snow removal, common area maintenance, and trash
Exterior
- Parking: Driveway parking; Four driveway/total parking spaces
- Utilities: Public water; Public sewer; Municipal trash not provided
- Home design: Manufactured home; Frame construction; Shingle roof
- Construction: Frame construction; Shingle roof; Building not winterized; Mobile home make: DUTCH PARK SPECIAL; Mobile home dimensions approximately 16 ft by 80 ft
- Exterior features: Not in a federal flood zone; Ground rent exists; Above-grade and below-grade other structures noted
Interior
- Bedrooms: Three bedrooms on the main level
- Bathrooms: Two full bathrooms on the main level
- Heating & cooling: Forced air heating; Propane (owned) heating fuel; Electric hot water
- Interior features: No basement; Living area reported by assessor
Neighborhood map
What this means for you Summary
Snapshot
- This is a 3-bed/2.0-bath manufactured listed at $47k.
Deal economics
- At list price, monthly cash flow is $944 ($11k/yr) — positive.
- The deal already cash-flows at list — no discount required.
- Meets the 1% rule at list price ($2k rent vs $47k).
- Recommended offer: $44k (6.0% below list) — sets the bar for market timing.
Location & tenants
- Location reads: area grade D — affects rentability + tenant quality, not the cash-flow math above.
- Brandywine Heights Area SD (suburban): math 48% / reading 66% proficiency, ranked #241 of 658 in PA (top 37%) — acceptable for families but not a draw, mixed tenant base, ~2y average lease; only 20% free/reduced lunch — higher-income household profile.
- Market conditions: Rents flat; 157 active listings in the ZIP; high-income renter base; 258 units permitted in Berks County in 2024 (27 in 5+ unit buildings).
Forward outlook
- Local home prices are declining (-3.0%/yr); year-one equity from $325 of loan paydown is wiped out by about $1k of value loss. Plan a longer hold.
- Berks County population projected at +3% by 2050 — modest demand growth; plan on rents tracking national, not racing it.
- At projected returns (-3.0% appreciation + 0.1% rent growth), your $13k cash investment doubles in ~2 years — after that, you're playing with house money.
Negotiation context
- It's been on market 83 days — a 6% lower offer ($44k) is reasonable based on typical stale-listing flexibility.
- 3 sale attempts; this cycle's ask has dropped $8k (15%) from the opening price — seller is motivated, your offer sets the floor, not the list.
Risks & watch-outs
- Watch-outs: property tax is 2.8% of price; HOA is 25% of rent.
- Climate carrying-cost: moderate wildfire risk — expect insurance premiums to compound above CPI over the hold.
Questions for the listing agent
- It's been on market 83 days. Have you received any prior offers? Is the seller open to a 6% concession, seller financing, or rate buy-down credit?
- Property tax is high relative to price — has the assessment been appealed recently, and will the sale trigger a re-assessment?
- What does the HOA fee cover, when was the last increase, and are there any pending special assessments or reserve-fund shortfalls?
- Why hasn't it sold? Are there any deal-killer items the seller is aware of (foundation, flood, title, zoning, code violations)?
- Is there a deadline driving the sale (1031 exchange, divorce, estate, relocation)? That informs how much negotiation room exists.
- The area grade is low — what's the realistic commute time and amenity access for the typical tenant pool here? Any planned neighborhood developments (good or bad) we should know about?
- What's the average days-on-market for RENTAL listings here right now (not sales)? A rising rental-DOM trend means longer vacancies and softer asking-rent achievability than the comps imply.
- What's the recent tenant-quality profile in this submarket — average credit score on applications, eviction rate, late-payment / NSF rate, and stable-employment percentage? A property-management company in the area should have these aggregated.
- How much new for-sale + rental construction is in the pipeline within 1–3 miles? Heavy new supply typically softens prices + rents 12–24 months out; constrained supply supports both.
Investment metrics
- 1% rule
- 5.21% ✓
- Cap rate
- 30.40%
- Cash-on-cash
- 86.08%
- DSCR
- 4.83
- GRM
- 1.6
CMA / ARV
- ARV (on-the-fly)
- $128,000
- Comps found
- 2
Show comp detail 2 sales within ~0.75 mi
| Address | Dist | Beds/Ba | Sqft | Sold | Price | $/sf | Match |
|---|---|---|---|---|---|---|---|
| 194 Haddon Dr | 0.09mi | 3/2.0 | 1,344 (+5%) | 2mo | $133,900 | $100 | 86 |
| 62 Mansfield Dr | 0.08mi | 3/2.0 | 1,120 (-12%) | 23mo | $77,900 | $70 | 56 |
Match score weights: distance 35% · size 25% · config 20% · recency 20%. Top-matched comps best support the ARV.
Projected returns pro-forma
-3.0% appreciation · 0.13% rent growth · sell at horizon
- IRR
- 81.8%
- Equity multiple
- 4.50×
- Total profit
- $46,081
- Equity at exit
- $7,008
- IRR
- 84.2%
- Equity multiple
- 8.05×
- Total profit
- $92,724
- Equity at exit
- $4,064
Cash invested: $13,160 (down + closing). Projections, not guarantees.
Landlord ↔ Tenant lean methodology
- Overall (STATE)
- 62 Landlord-Friendly
- State Pennsylvania
- 62 Landlord-Friendly · EVEN
- County
- — inherits STATE
- City
- — inherits STATE
ZIP-level market 18062
- Home prices YoY
- -26.4%
- Rents YoY
- 0.1%
- Active inventory
- 157
- Price-to-rent
- 1.6×
Monthly cashflow live
- Estimated rent
- $2,449 medium interval (Pro) →
- Mortgage (P&I)
- −$246
- Tax from tax record
- −$110 /mo · $1,315/yr
- Insurance
- −$20
- HOA
- −$615
- Vacancy / Maint / Mgmt
- −$514
- Net cashflow
- $944
Break-even live
Sensitivity live
| Price | -10% $971 | -5% $957 | +0% $944 | +5% $931 | +10% $917 |
|---|---|---|---|---|---|
| Rent | -10% $751 | -5% $847 | +0% $944 | +5% $1,041 | +10% $1,137 |
| Rate | -1.0pp $968 | -0.5pp $956 | base $944 | +0.5pp $932 | +1.0pp $919 |
UW: 25.0% down · 7.5% · 30yr · 1.5% tax · 5.0% vac · 8.0% maint · 8.0% mgmt
Financing live
Cash to close
- Down payment
- $11,750
- Closing costs
- $1,410
- Reserves months
- —
- Total cash needed
- —
Loan-product check · same deal, 3 products live
Conventional
25% down · 7.5% · 30yr
- Down + closing
- —
- Monthly P&I
- —
- Monthly cashflow
- —
- DSCR
- —
- Eligible?
- —
Personal DTI + credit; lowest rate.
DSCR
20% down · 8.5% · 30yr
- Down + closing
- —
- Monthly P&I
- —
- Monthly cashflow
- —
- DSCR
- —
- Eligible?
- —
No personal income docs; deal must DSCR.
Hard money
10% down · 12.0% · 12mo
- Down + closing
- —
- Monthly P&I
- —
- Monthly cashflow
- —
- DSCR
- —
- Eligible?
- —
Short-term bridge; refi at stabilization.
HOA detail
- Monthly dues
- $615 · $7,380/yr
Listing history 23 events
-
2026-06-18days on market $47,000 Active 83 DOM
-
2026-06-17days on market $47,000 Active 82 DOM
-
2026-06-16days on market $47,000 Active 81 DOM
-
2026-06-15days on market $47,000 Active 80 DOM
-
2026-06-14days on market $47,000 Active 78 DOM
-
2026-06-13days on market $47,000 Active 77 DOM
-
2026-06-10days on market $47,000 Active 75 DOM
-
2026-06-09days on market $47,000 Active 74 DOM
-
2026-06-08days on market $47,000 Active 73 DOM
-
2026-06-07days on market $47,000 Active 72 DOM
-
2026-06-05days on market $47,000 Active 69 DOM
-
2026-06-03days on market $47,000 Active 68 DOM
-
2026-06-02days on market $47,000 Active 67 DOM
-
2026-06-01days on market $47,000 Active 66 DOM
-
2026-05-31days on market $47,000 Active 65 DOM
-
2026-05-31status $47,000 Active 64 DOM
-
2026-05-06status Pending
-
2026-05-04status Active
-
2026-05-01status Pending
-
2026-04-29status Active
-
2026-04-25status Pending
-
2026-04-17price $47,000
-
2026-02-24$55,000 Active
ⓘ Source: listings_history table (triggers on properties + properties_extension) + one-shot
backfill from property_details.listing_events for pre-trigger history.
Tax reassessment forecast PA · Partial reset (capped growth)
- Current annual tax
- $1,315 · $110/mo
- Projected year-2 tax
- $1,315 · $110/mo
- Expected delta
- $0/yr ($0/mo · 0.0%)
ⓘ Screening estimate from a state-policy table — verify with the county assessor before closing.
Climate risk First Street
- Flood 4/10 Moderate FEMA zone X (unshaded) · 24% chance over 30 yrs
- Wildfire 5/10 Major
- Heat 3/10 Moderate 6 d/yr ≥99°F today · 13 d/yr by 30 yrs out
- Wind 4/10 Moderate 17% chance of damaging wind over 30 yrs
- Air quality 3/10 Moderate 2 unhealthy d/yr today · 3 by 30 yrs out
Nearby sold comps map
Loading sold comps map…
Walkable amenities ~0.75 mi
Loading nearby amenities…
Taxation est. · year 1
- Rental income
- $29,387
- − Mortgage interest
- −$2,633
- − Property taxes
- −$1,315
- − Insurance
- −$235
- − Repairs & maintenance
- −$2,351
- − Management
- −$2,351
- − HOA
- −$7,380
- − Depreciation
- −$1,367
- Taxable income
- $11,755
- Est. tax owed @ 24.0%
- −$2,821
- After-tax cash flow
- $8,507/yr
For passive investors: Depreciation is non-cash, so a rental often shows a tax loss while cash-flowing — sheltering income. Rental losses are passive: they offset passive income freely, and up to $25,000/yr can offset ordinary (W-2) income if you actively participate and your MAGI is under $100k (phasing out to $0 by $150k); unused losses carry forward. On sale, claimed depreciation is recaptured at up to 25%, and gains may owe capital-gains tax (a 1031 exchange can defer both). Figures are a year-1 estimate at your 24.0% rate — not tax advice; consult a CPA.
Schools (NCES district)
- District
- Brandywine Heights Area SD
- NCES district ID
- 4204050
- Math proficiency
- 48% ▲ 1.00%
- Reading proficiency
- 66% ▼ -1.00%
- Median HH income
- $62,904
- Composite
- 51.52/100
- National rank
- #3670
- State rank
- #241 of 658 in PA
Livability — Longswamp
No livability data for this city. (Only ~50 U.S. cities are tracked.)
Census & demographics
- County
- Lehigh County · 333,019 people
- Metro
- Allentown-Bethlehem-Easton, PA-NJ
- Population (ZIP)
- 27,110
- Household income
- $110,675
- Rent vs Own
- Severe rent burden
- 537.0
Population outlook (Berks County) Hauer SSP2
- Today (2025)
- 425,767 people
- By 2030
- 428,814 · +0.7%
- By 2040
- 433,463 · +1.8%
- By 2050
- 439,426 · +3.2%
- By 2075
- 478,647 · +12.4%
- By 2100
- 518,507 · +21.8%
Race, ethnicity, and origin ACS 2023
- Neighborhood character
- Predominantly White (77%)
- Race & ethnicity
- White 77% Hispanic / Latino 10% Two or more races 10% Asian 5% Black 3%
- Hispanic origin (detail)
- Puerto Rican 4% Dominican 2%
- Common ancestry
- Romanian 5% Lithuanian 2% Subsaharan African 2%
- Foreign-born
- 11% · Canada, China, Jamaica
- Languages at home
- 83% English-only · Spanish 7% Other Indo-European 4% French/Haitian/Cajun 2%
Political lean MEDSL · Berks
- 2024 margin
- R (+12.2) · D 43.4% · R 55.6%
- 2008→2024 swing
- -21.4pp toward R · 2008: 9.2pp · 2024: -12.2pp
- All cycles
- 2024: R+12.2 2020: R+8.2 2016: R+10.2 2012: R+0.6 2008: D+9.2
Not yet ingested
- Civics
- —
Market trends
- HPI YoY
- ▼ -91.04%
- Current HPI
- 253.5939
- Rent YoY
- ▲ 0.13%
- Metro
- Allentown-Bethlehem-Easton, PA-NJ
- State GDP YoY
- ▲ 1.68%
- F500 in state
- 34
Industry mix (Fortune 500 HQ in PA)
| Industry | F500 HQs | Revenue |
|---|---|---|
| Healthcare | 2 | $309B |
|
||
| Insurance | 2 | $27B |
|
||
| Telecommunications / Media | 1 | $124B |
|
||
| Industrial Distribution | 1 | $22B |
|
||
| Financial Services | 1 | $20B |
|
||
| Chemicals / Materials | 1 | $18B |
|
||
Price history
-14.5% since first listed7 events — show timeline
- 2026-05-06 Pending — BRIGHT MLS
- 2026-05-04 Relisted — BRIGHT MLS
- 2026-05-01 Pending — BRIGHT MLS
- 2026-04-29 Relisted — BRIGHT MLS
- 2026-04-25 Pending — BRIGHT MLS
- 2026-04-17 Price Changed $47,000 BRIGHT MLS
- 2026-02-24 Listed $55,000 BRIGHT MLS
Property tax history
+1.2%/yrLatest (2026): $1,315 · +0.0% YoY. Source: county tax records.
Cash-flow waterfall
monthlySold comps — $/sqft
last 12 mo · ≤1 miLoading sold comps…