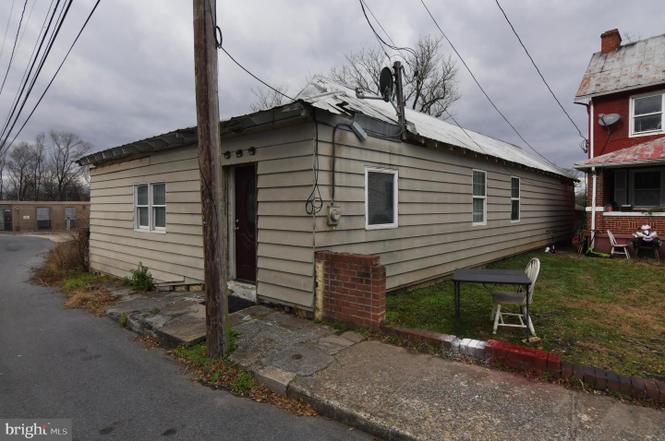
122 Five Point Ave · Martinsburg, WV
Flood risk 1/10 · Minimal
- FEMA flood zone
- X (unshaded)
- Chance of flooding over 30 yrs
- 0.0%
- Est. flood insurance / yr
- $507 – $1,088
Fire risk 3/10 · Minor
- Est. fire insurance / yr
- $787 – $1,461
Heat risk 5/10 · Moderate
- Hot days now (above 103°F)
- 7 days/yr
- Hot days in 30 yrs
- 16 days/yr
Wind risk 2/10 · Minimal
- Chance of severe wind over 30 yrs
- 2.0%
Air-quality risk 2/10 · Minimal
- Unhealthy air days now
- 0 days/yr
- Unhealthy air days in 30 yrs
- 1 days/yr
Risk factors via First Street. Map © Google.
Why this score? — see what drove the B grade
The composite is a weighted blend of 9 inputs, each scored 0–100. Each bar is that input's sub-score; the figure is the points it added to the 100-point composite (weight × sub-score).
- Cash flow +30.0/30.0
- 1% rule +10.0/10.0
- DSCR +10.0/10.0
- ARV discount +7.5/15.0
- Rent growth +4.1/5.0
- Livability +3.8/5.0
- Schools +2.6/10.0
- Condition / age +2.5/5.0
- Appreciation +0.0/10.0
$75,000
🖨 Deal sheet 📄 Offer letter ✓ Due diligence
Listing remarks
ONE-LEVEL LIVING WITH 3 BEDROOMS AND 2 FULL BATHS. GREAT OPPORTUNITY IN DOWNTOWN MARTINSBURG. EXCELLENT RENOVATION PROJECT FOR FLIPPERS AND OTHERS WHO ARE WILLING TO ROLL UP THEIR SLEEVES AND GET TO WORK. Sold strictly as-is, where-is. Cash only. This is one of six houses in various stages of interior demo/reno being offered for sale by this owner. Four building lots also are for sale. The Eastern Panhandle is one of the fastest growing areas of West Virginia. Residents of Martinsburg and Berkeley County are attracted to the small-town atmosphere, employment opportunities, restaurants, shopping, services, medical facilities, a revitalizing downtown, and access to major roads I-81, Rt. 9 and
Key facts
- Downtown martinsburg
- One level living
- 1,424 sq ft lot
Tags
Property features AI
Exterior
- Parking: On-street parking
- Utilities: Public water; Public sewer; Electric power
- Home design: Detached property; Major rehab needed
- Construction: Wood siding; Metal roof; Permanent foundation; Originally built (year source: assessor)
- Exterior features: Not in a federal flood zone; Tidal water: No; Other structures noted above and below grade
Interior
- Kitchen: Kitchen
- Bedrooms: Three bedrooms (all on the main level)
- Flooring: Laminate plank flooring; Ceramic tile flooring
- Bathrooms: Two full bathrooms (both on the main level)
- Heating & cooling: Forced air heating; Electric and natural gas heating fuel; Central air conditioning (electric)
- Interior features: Living room; No basement; Has one fireplace
- Laundry & utility: Hot water: Electric
Neighborhood map
What this means for you Summary
Snapshot
- This is a 3-bed/1.0-bath single-family listed at $75k.
Deal economics
- At list price, monthly cash flow is $730 ($9k/yr) — positive.
- The deal already cash-flows at list — no discount required.
- Meets the 1% rule at list price ($2k rent vs $75k).
- Recommended offer: $74k (1.5% below list) — sets the bar for market timing.
- Cap rate 18.0% vs local median 4.0% in Martinsburg — top-decile yield for the area; either an underpriced asset or a hidden risk that comps aren't pricing in. Stress-test before assuming the spread holds.
Location & tenants
- Location reads 75/100 on livability (#29 in WV, #4,057 nationally) — a middle-class / working-renter tenant base. Strengths: amenities A+, cost of living A+, housing A+; Watch: commute F, employment D-.
- Berkeley County Schools (other): math 21% / reading 38% proficiency, ranked #24 of 55 in WV (top 44%) — low school quality limits family demand, transient renter base, plan for 1-2y turnover.
- Zoned schools: Tuscarora Elementary School (409 students, 0% FRL); Martinsburg North Middle School (math 10% / reading 34%, grade F, #95 of 109 statewide, top 88%, 666 students, 0% FRL); Martinsburg High School (math 17% / reading 49%, grade F, #53 of 110 statewide, top 48%, 1,471 students, 0% FRL) — zoned schools average 0% FRL vs 42% district-wide (42 pts lower); this property's tenant base skews higher-income than the district average.
- Market conditions: Rents rising fast (+6.3%/yr); 109 active listings in the ZIP; 23 comparable units currently listed for rent nearby; rentals leasing fast (median 14d on market — plan ~1-2 weeks tenant-placement turnaround); 1,460 units permitted in Berkeley County in 2024 (16 in 5+ unit buildings).
Forward outlook
- Local home prices are declining (-3.0%/yr); year-one equity from $519 of loan paydown is wiped out by about $2k of value loss. Plan a longer hold.
- Berkeley County population projected at +25% by 2050 — long-run rental-demand tailwind backs the buy-and-hold thesis.
- At projected returns (-3.0% appreciation + 6.3% rent growth), your $21k cash investment doubles in ~3 years — after that, you're playing with house money.
Negotiation context
- It's been on market 29 days — a 2% lower offer ($74k) is reasonable based on typical stale-listing flexibility.
- 7 sale attempts since 27y ago with the ask held roughly flat each time — persistent listings suggest the price (not the market) is what's stuck; bring a comps-based counter.
- Current owner paid $15k; list at $75k implies a 400% gain — meaningful room to come down on a strong offer.
Risks & watch-outs
- Watch-outs: built in 1930 — expect roof / HVAC / electrical / plumbing capex.
- Climate carrying-cost: extreme-heat days projected 7→16/yr by 2055 (HVAC capex compounding) — expect insurance premiums to compound above CPI over the hold.
Questions for the listing agent
- Built in 1930 — when were the roof, HVAC, electrical panel, plumbing, and water heater last replaced?
- Is there a deadline driving the sale (1031 exchange, divorce, estate, relocation)? That informs how much negotiation room exists.
- What's the average days-on-market for RENTAL listings here right now (not sales)? A rising rental-DOM trend means longer vacancies and softer asking-rent achievability than the comps imply.
- What's the recent tenant-quality profile in this submarket — average credit score on applications, eviction rate, late-payment / NSF rate, and stable-employment percentage? A property-management company in the area should have these aggregated.
- How much new for-sale + rental construction is in the pipeline within 1–3 miles? Heavy new supply typically softens prices + rents 12–24 months out; constrained supply supports both.
Investment metrics
- 1% rule
- 2.02% ✓
- Cap rate
- 17.97%
- Cash-on-cash
- 41.72%
- DSCR
- 2.86
- GRM
- 4.1
CMA / ARV
- ARV (on-the-fly)
- $196,416
- Comps found
- 12
Show comp detail 12 sales within ~0.75 mi
| Address | Dist | Beds/Ba | Sqft | Sold | Price | $/sf | Match |
|---|---|---|---|---|---|---|---|
| 134 Pennsylvania Ave | 0.12mi | 2/1.0 (-1) | 916 (-13%) | 0mo | $160,000 | $175 | 67 |
| 227 N Tuskegee Dr | 0.47mi | 3/1.0 | 1,020 (-3%) | 10mo | $254,000 | $249 | 64 |
| 713 3rd St | 0.31mi | 2/1.0 (-1) | 1,000 (-5%) | 11mo | $215,000 | $215 | 62 |
| 212 Strine Ave | 0.36mi | 2/2.0 (-1) | 1,116 (+6%) | 3mo | $270,000 | $242 | 62 |
| 114 N Kentucky Ave | 0.69mi | 3/2.0 | 1,042 (-1%) | 2mo | $225,000 | $216 | 60 |
| 200 Rothwell Ave | 0.37mi | 3/2.0 | 1,152 (+9%) | 7mo | $229,000 | $199 | 58 |
| 477 E Burke St | 0.70mi | 2/1.0 (-1) | 1,040 (-2%) | 7mo | $114,000 | $110 | 54 |
| 639 W Race St | 0.54mi | 2/1.0 (-1) | 1,172 (+11%) | 2mo | $215,000 | $183 | 50 |
| 130 S Valley St | 0.73mi | 2/1.0 (-1) | 1,008 (-4%) | 5mo | $105,000 | $104 | 49 |
| 602 W Race St | 0.47mi | 2/1.0 (-1) | 1,204 (+14%) | 2mo | $167,000 | $139 | 48 |
| 103 S Valley St | 0.70mi | 3/2.0 | 1,148 (+9%) | 6mo | $120,000 | $105 | 44 |
| 312 Liberty St E | 0.35mi | 2/2.0 (-1) | 1,208 (+14%) | 10mo | $225,000 | $186 | 42 |
Match score weights: distance 35% · size 25% · config 20% · recency 20%. Top-matched comps best support the ARV.
Projected returns pro-forma
-3.0% appreciation · 6.3% rent growth · sell at horizon
- IRR
- 41.9%
- Equity multiple
- 2.88×
- Total profit
- $39,528
- Equity at exit
- $11,183
- IRR
- 49.5%
- Equity multiple
- 6.57×
- Total profit
- $117,057
- Equity at exit
- $6,485
Cash invested: $21,000 (down + closing). Projections, not guarantees.
Landlord ↔ Tenant lean methodology
- Overall (STATE)
- 83 Strongly Landlord-Friendly
- State West Virginia
- 83 Strongly Landlord-Friendly · R+22
- County
- — inherits STATE
- City
- — inherits STATE
ZIP-level market 25404
- Home prices YoY
- -10.7%
- Rents YoY
- 6.3%
- Active inventory
- 109
- Price-to-rent
- 4.1×
Monthly cashflow live
- Estimated rent
- $1,514 high interval (Pro) →
- Mortgage (P&I)
- −$393
- Tax from tax record
- −$41 /mo · $494/yr
- Insurance
- −$31
- HOA
- −$0
- Vacancy / Maint / Mgmt
- −$318
- Net cashflow
- $730
Break-even live
UW: 25.0% down · 7.5% · 30yr · 1.5% tax · 5.0% vac · 8.0% maint · 8.0% mgmt
Financing live
Cash to close
- Down payment
- $18,750
- Closing costs
- $2,250
- Reserves months
- —
- Total cash needed
- —
Loan-product check · same deal, 3 products live
Conventional
25% down · 7.5% · 30yr
- Down + closing
- —
- Monthly P&I
- —
- Monthly cashflow
- —
- DSCR
- —
- Eligible?
- —
Personal DTI + credit; lowest rate.
DSCR
20% down · 8.5% · 30yr
- Down + closing
- —
- Monthly P&I
- —
- Monthly cashflow
- —
- DSCR
- —
- Eligible?
- —
No personal income docs; deal must DSCR.
Hard money
10% down · 12.0% · 12mo
- Down + closing
- —
- Monthly P&I
- —
- Monthly cashflow
- —
- DSCR
- —
- Eligible?
- —
Short-term bridge; refi at stabilization.
Rent comps 23 comps
| Address | Beds | Baths | Sqft | Rent | $/sqft | DOM | Units | Dist |
|---|---|---|---|---|---|---|---|---|
| 721 2nd St Unit A Martinsburg, WV | 2.0 | 1.0 | 1412 | $1,180 | $0.84 | 13d | 1 | 0.26mi |
| 218 N College St Martinsburg, WV | 3.0 | 1.0 | 1200 | $1,330 | $1.11 | 21d | 1 | 0.33mi |
| 117 E Martin St Unit 1 Martinsburg, WV | 2.0 | 1.0 | 800 | $1,200 | $1.50 | 13d | 1 | 0.37mi |
| 226 N Raleigh St Martinsburg, WV | 3.0 | 1.0 | 1200 | $1,450 | $1.21 | 21d | 1 | 0.40mi |
| 316 N High St Martinsburg, WV | 3.0 | 1.5 | 1300 | $1,650 | $1.27 | 13d | 1 | 0.42mi |
| 589 Berkeley Cir Martinsburg, WV | 2.0 | 2.0 | 1160 | $1,970 | $1.70 | 12d | 1 | 0.55mi |
| 700 Thomas Ln Martinsburg, WV | 2.0 | 1.0 | 900 | $1,200 | $1.33 | 21d | 1 | 0.55mi |
| 200 E King St Martinsburg, WV | 2.0 | 1.0 | 900 | $900 | $1.00 | 13d | 1 | 0.57mi |
| 200 E King St Unit 10 Martinsburg, WV | 2.0 | 1.0 | 900 | $900 | $1.00 | 21d | 1 | 0.57mi |
| 215 W King St Apt B Martinsburg, WV | 2.0 | 2.0 | 1192 | $1,690 | $1.42 | 21d | 1 | 0.57mi |
| 311 W King St Martinsburg, WV | 3.0 | 1.0 | 800 | $950 | $1.19 | 21d | 1 | 0.58mi |
| 704 Thomas Ln Martinsburg, WV | 2.0 | 1.0 | 950 | $1,300 | $1.37 | 21d | 1 | 0.58mi |
| 116 S High St Martinsburg, WV | 2.0 | 1.0 | 1200 | $1,280 | $1.07 | 13d | 1 | 0.60mi |
| 320 W Stephen St Martinsburg, WV | 2.0 | 2.0 | 800 | $950 | $1.19 | 13d | 1 | 0.74mi |
| 600 W John St Martinsburg, WV | 1.0–2.0 | 1.0–2.0 | 976 | $2,026 | $2.08 | 13d | 14 | 0.76mi |
| 329 Porter Ave Martinsburg, WV | 2.0 | 1.0 | 800 | $1,000 | $1.25 | 13d | 1 | 0.88mi |
| 620 W Virginia Ave Martinsburg, WV | 3.0 | 1.0 | 1200 | $1,555 | $1.30 | 13d | 1 | 1.02mi |
| 1100 Myna Ct Martinsburg, WV | 2.0–3.0 | 2.0–2.5 | 1400 | $1,870 | $1.34 | 13d | 15 | 1.07mi |
| 653 Faulkner Ave Martinsburg, WV | 3.0 | 1.5 | 1442 | $1,450 | $1.01 | 21d | 1 | 1.13mi |
| 1123 Shepherdstown Rd Martinsburg, WV | 3.0 | 1.0 | 1429 | $1,900 | $1.33 | 21d | 1 | 1.18mi |
| 729 Faulkner Ave Martinsburg, WV | 2.0 | 1.0 | 864 | $1,350 | $1.56 | 13d | 1 | 1.25mi |
| 19 Tevis Cir Martinsburg, WV | 2.0 | 2.0 | 1128 | $1,545 | $1.37 | 13d | 5 | 1.28mi |
| 236 Trimble Ave Martinsburg, WV | 2.0 | 1.5 | 1200 | $1,350 | $1.12 | 13d | 1 | 1.33mi |
Listing history 23 events
-
2026-06-13status $75,000 Pending 29 DOM
-
2026-06-10days on market $75,000 Active 29 DOM
-
2026-06-09days on market $75,000 Active 28 DOM
-
2026-06-08days on market $75,000 Active 27 DOM
-
2026-06-07days on market $75,000 Active 26 DOM
-
2026-06-02days on market $75,000 Active 21 DOM
-
2026-06-01days on market $75,000 Active 20 DOM
-
2026-05-31days on market $75,000 Active 19 DOM
-
2026-05-30days on market $75,000 Active 18 DOM
-
2026-05-22status Active
-
2025-12-24historical
-
2025-12-14$75,000 Active
-
2020-09-30historical
-
2020-02-29$125,000 Active
-
2005-11-13historical
-
2005-05-16
-
2003-09-08historical
-
2003-03-09
-
2000-11-01soldstatus $15,000
-
2000-10-01historical
-
2000-08-10$20,000
-
2000-05-30historical
-
1999-04-13
ⓘ Source: listings_history table (triggers on properties + properties_extension) + one-shot
backfill from property_details.listing_events for pre-trigger history.
Tax reassessment forecast WV · Resets to sale price
- Current annual tax
- $494 · $41/mo
- Projected year-2 tax
- $494 · $41/mo
- Expected delta
- $0/yr ($0/mo · 0.0%)
ⓘ Screening estimate from a state-policy table — verify with the county assessor before closing.
Climate risk First Street
- Flood 1/10 Low FEMA zone X (unshaded) · 0% chance over 30 yrs
- Wildfire 3/10 Moderate
- Heat 5/10 Major 7 d/yr ≥103°F today · 16 d/yr by 30 yrs out
- Wind 2/10 Low 2% chance of damaging wind over 30 yrs
- Air quality 2/10 Low 0 unhealthy d/yr today · 1 by 30 yrs out
Nearby sold comps map
Loading sold comps map…
Walkable amenities ~0.75 mi
Loading nearby amenities…
Taxation est. · year 1
- Rental income
- $18,163
- − Mortgage interest
- −$4,201
- − Property taxes
- −$494
- − Insurance
- −$375
- − Repairs & maintenance
- −$1,453
- − Management
- −$1,453
- − Depreciation
- −$2,182
- Taxable income
- $8,006
- Est. tax owed @ 24.0%
- −$1,921
- After-tax cash flow
- $6,839/yr
For passive investors: Depreciation is non-cash, so a rental often shows a tax loss while cash-flowing — sheltering income. Rental losses are passive: they offset passive income freely, and up to $25,000/yr can offset ordinary (W-2) income if you actively participate and your MAGI is under $100k (phasing out to $0 by $150k); unused losses carry forward. On sale, claimed depreciation is recaptured at up to 25%, and gains may owe capital-gains tax (a 1031 exchange can defer both). Figures are a year-1 estimate at your 24.0% rate — not tax advice; consult a CPA.
Schools (NCES district)
- District
- Berkeley County Schools
- NCES district ID
- 5400060
- Math proficiency
- 21% ▼ -12.00%
- Reading proficiency
- 38% ▼ -6.00%
- Median HH income
- $54,599
- Composite
- 26.16/100
- National rank
- #7273
- State rank
- #24 of 55 in WV
Livability — Martinsburg
- Score
- 75/100
- State rank
- #29
- US rank
- #4057
Category grades
Schools grade is shown separately in the Schools card above.
Census & demographics
- Census place
- Martinsburg, WV
- County
- Berkeley County · 85,235 people
- City population
- 55,439
- Metro
- Hagerstown-Martinsburg, MD-WV
- Population (ZIP)
- 23,990
- Household income
- $70,633
- Rent vs Own
- Severe rent burden
- 833.0
Population outlook (Berkeley County) Hauer SSP2
- Today (2025)
- 127,359 people
- By 2030
- 134,684 · +5.8%
- By 2040
- 148,219 · +16.4%
- By 2050
- 159,300 · +25.1%
- By 2075
- 179,920 · +41.3%
- By 2100
- 183,896 · +44.4%
Race, ethnicity, and origin ACS 2023
- Neighborhood character
- Predominantly White (78%)
- Race & ethnicity
- White 78% Black 9% Two or more races 8% Hispanic / Latino 7% Asian 1%
- Hispanic origin (detail)
- Mexican 3% Puerto Rican 1%
- Common ancestry
- Slovak 3% Romanian 3% Italian 1%
- Foreign-born
- 6% · Canada, South Korea
- Languages at home
- 94% English-only · Spanish 5%
Political lean MEDSL · Berkeley
- 2024 margin
- Solid R (+35.8) · D 31.2% · R 67.0% · Other 1.8%
- 2008→2024 swing
- -22.8pp toward R · 2008: -13.0pp · 2024: -35.8pp
- All cycles
- 2024: R+35.8 2020: R+31.2 2016: R+37.2 2012: R+21.3 2008: R+13.0
Not yet ingested
- Civics
- —
Market trends
- HPI YoY
- ▼ -24.58%
- Current HPI
- 205.3277
- Rent YoY
- ▲ 6.30%
- Metro
- Hagerstown-Martinsburg, MD-WV
- State GDP YoY
- —
- F500 in state
- 0
Price history
+275.0% since first listed14 events — show timeline
- 2026-05-22 Relisted — BRIGHT MLS
- 2025-12-24 Listing Removed — BRIGHT MLS
- 2025-12-14 Listed $75,000 BRIGHT MLS
- 2020-09-30 Listing Removed — BRIGHT MLS
- 2020-02-29 Listed $125,000 BRIGHT MLS
- 2005-11-13 Delisted — MRIS
- 2005-05-16 Listed — MRIS
- 2003-09-08 Delisted — MRIS
- 2003-03-09 Listed — MRIS
- 2000-11-01 Sold (MLS) $15,000 MRIS
- 2000-10-01 Delisted — MRIS
- 2000-08-10 Listed $20,000 MRIS
- 2000-05-30 Delisted — MRIS
- 1999-04-13 Listed — MRIS
Property tax history
-3.6%/yrLatest (2025): $494 · -14.6% YoY. Source: county tax records.
Cash-flow waterfall
monthlySold comps — $/sqft
last 12 mo · ≤1 miLoading sold comps…