 🏷️ Likely Rental
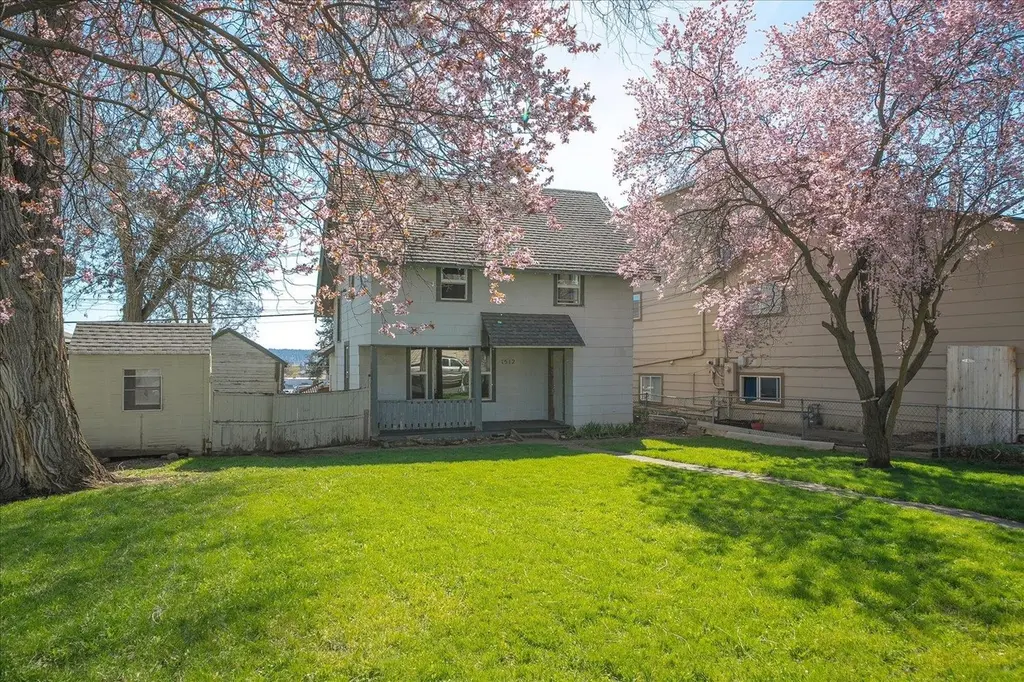
1512 E Dalton Ave · Spokane, WA
Flood risk 1/10 · Minimal
- FEMA flood zone
- X (unshaded)
- Chance of flooding over 30 yrs
- 0.0%
- Est. flood insurance / yr
- $473 – $860
Fire risk 1/10 · Minimal
- Est. fire insurance / yr
- $604 – $1,122
Heat risk 3/10 · Minor
- Hot days now (above 94°F)
- 7 days/yr
- Hot days in 30 yrs
- 15 days/yr
Wind risk 1/10 · Minimal
- Chance of severe wind over 30 yrs
- —
Air-quality risk 10/10 · Severe
- Unhealthy air days now
- 19 days/yr
- Unhealthy air days in 30 yrs
- 21 days/yr
Risk factors via First Street. Map © Google.
Why this score? — see what drove the D+ grade
The composite is a weighted blend of 9 inputs, each scored 0–100. Each bar is that input's sub-score; the figure is the points it added to the 100-point composite (weight × sub-score).
- ARV discount +15.0/15.0
- Cash flow +12.7/30.0
- Schools +4.6/10.0
- Livability +4.0/5.0
- DSCR +3.8/10.0
- 1% rule +3.5/10.0
- Rent growth +3.3/5.0
- Condition / age +2.5/5.0
- Appreciation +0.0/10.0
$189,000
🖨 Deal sheet (PDF) 📄 Offer letter ✓ Due diligence
Listing remarks
New Price $189,000 for a quick sale. Home sold AS-IS. Bring your toolbelt and vision—this home is ready to shine! This 2-bedroom, 2-bathroom, two-story home is full of potential and conveniently located just one block from Gonzaga Prep and close to shopping, dining, and everyday amenities. With solid bones and a functional layout, this home offers a great opportunity for first-time buyers looking to build equity or investors seeking their next project. Features include a newer hot water tank, new windows, and the roof is just a few years old. Enjoy morning coffee on the covered front porch and take advantage of the fenced front yard for added privacy. The home has been tenant-occupied
Key facts
- 6,007 sq ft lot
- Garage
- Built 1908
Property features AI
Finance
- Other: Below-grade finished area present; Living area approximately 1,737 total square feet
Exterior
- Parking: Detached garage; 1 garage space
- Utilities: High-speed internet available (Xfinity)
- Home design: Single-family residence; Two-story structure; Residential property
- Construction: Masonite exterior; Composition roof; Partial unfinished basement
- Exterior features: Deck; Patio; Fenced yard; Level lot; Garden; City bus service within ~6 blocks; Paved road frontage; City street frontage
Interior
- Kitchen: Free-standing range; Refrigerator
- Bedrooms: 2 bedrooms
- Heating & cooling: Natural gas forced-air heating
- Interior features: Hot water; Cathedral ceilings; Utility room
Neighborhood map
What this means for you Summary
Snapshot
- This is a 2-bed/1.0-bath single-family listed at $189k.
Deal economics
- At list price, monthly cash flow is $-20 ($-237/yr) — negative.
- To cash-flow at today's rent, offer at most $186k (1.8% below list).
- To meet the 1% rule (rent ≥ 1% of price), the offer needs to be $160k (15.2% below list).
- Recommended offer: $160k (15.2% below list) — sets the bar for 1% rule.
- Cap rate 6.2% vs local median 3.2% in Spokane — top-decile yield for the area; either an underpriced asset or a hidden risk that comps aren't pricing in. Stress-test before assuming the spread holds.
Location & tenants
- Location reads 80/100 on livability (#93 in WA, #1,822 nationally) — a professional / high-income tenant draw. Strengths: amenities A+, commute A+, housing A+; Watch: crime F.
- Spokane School District (urban): math 47% / reading 58% proficiency, ranked #136 of 291 in WA (top 47%) — acceptable for families but not a draw, mixed tenant base, ~2y average lease.
- Zoned schools: Bemiss Elementary (384 students, 87% FRL); Shaw Middle School (764 students, 88% FRL); Rogers High School (1,536 students, 83% FRL) — zoned schools average 86% FRL vs 50% district-wide (36 pts higher); higher-poverty schools than district average — tighter screening recommended.
- Market conditions: Rents rising (+3.2%/yr); 241 active listings in the ZIP; 19 comparable units currently listed for rent nearby; rentals at typical pace (median 23d on market — plan ~3-4 weeks tenant-placement turnaround); 3,608 units permitted in Spokane County in 2024 (1,792 in 5+ unit buildings).
- This rent runs 32% of the median local income ($60k/yr) — at the standard rent-burdened threshold; future hikes will face affordability resistance.
Forward outlook
- Local home prices are declining (-3.0%/yr); year-one equity from $1k of loan paydown is wiped out by about $6k of value loss. Plan a longer hold.
- Spokane County population projected at +13% by 2050 — modest demand growth; plan on rents tracking national, not racing it.
Negotiation context
- It's been on market 35 days — a 3% lower offer ($183k) is reasonable based on typical stale-listing flexibility.
- 2 sale attempts; this cycle's ask has dropped $21k (10%) from the opening price — seller is motivated, your offer sets the floor, not the list.
- Current owner paid $12k; list at $189k implies a 1468% gain — meaningful room to come down on a strong offer.
Risks & watch-outs
- Watch-outs: built in 1908 — expect roof / HVAC / electrical / plumbing capex.
Questions for the listing agent
- What do current leases actually rent for vs. the listed asking? Can we see a recent rent roll and the last 12 months of T-12 income?
- It's been on market 35 days. Have you received any prior offers? Is the seller open to a 15% concession, seller financing, or rate buy-down credit?
- Built in 1908 — when were the roof, HVAC, electrical panel, plumbing, and water heater last replaced?
- Is there a deadline driving the sale (1031 exchange, divorce, estate, relocation)? That informs how much negotiation room exists.
- Schools are B-rated — typically a magnet for longer-tenancy family renters. What's the average tenant stay here, and is there a school-zone premium baked into asking?
- Crime grade is F in this area — have there been break-ins, vandalism, or insurance claims at this property in the last 3 years? What carrier currently insures it and at what premium?
- The area grade is low — what's the realistic commute time and amenity access for the typical tenant pool here? Any planned neighborhood developments (good or bad) we should know about?
- What's the average days-on-market for RENTAL listings here right now (not sales)? A rising rental-DOM trend means longer vacancies and softer asking-rent achievability than the comps imply.
- What's the recent tenant-quality profile in this submarket — average credit score on applications, eviction rate, late-payment / NSF rate, and stable-employment percentage? A property-management company in the area should have these aggregated.
- How much new for-sale + rental construction is in the pipeline within 1–3 miles? Heavy new supply typically softens prices + rents 12–24 months out; constrained supply supports both.
Investment metrics
- 1% rule
- 0.85% ✗
- Cap rate
- 6.17%
- Cash-on-cash
- -0.45%
- DSCR
- 0.98
- GRM
- 9.8
CMA / ARV
- ARV (on-the-fly)
- $252,693
- Comps found
- 12
Show comp detail 12 sales within ~0.75 mi
| Address | Dist | Beds/Ba | Sqft | Sold | Price | $/sf | Match |
|---|---|---|---|---|---|---|---|
| 1507 E Bridgeport Ave | 0.16mi | 3/2.0 (+1) | 1,313 (-2%) | 1mo | $305,000 | $232 | 80 |
| 904 E Empire Ave | 0.61mi | 2/1.0 | 1,303 (-2%) | 1mo | $258,000 | $198 | 67 |
| 1317 E Dalton Ave | 0.14mi | 3/2.0 (+1) | 1,200 (-10%) | 5mo | $265,000 | $221 | 64 |
| 1627 E Lacrosse Ave | 0.65mi | 2/1.0 | 1,392 (+4%) | 3mo | $254,500 | $183 | 60 |
| 1421 E Carlisle Ave | 0.45mi | 3/1.0 (+1) | 1,441 (+8%) | 4mo | $272,400 | $189 | 57 |
| 3423 N Stone St | 0.56mi | 3/1.0 (+1) | 1,261 (-6%) | 5mo | $238,000 | $189 | 55 |
| 1114 E Providence Ave | 0.47mi | 3/2.0 (+1) | 1,425 (+7%) | 8mo | $290,000 | $204 | 52 |
| 2224 E Empire Ave | 0.68mi | 2/1.0 | 1,436 (+7%) | 5mo | $167,000 | $116 | 52 |
| 603 E Liberty Ave | 0.60mi | 3/1.0 (+1) | 1,463 (+9%) | 3mo | $270,000 | $185 | 48 |
| 548 E Dalton Ave | 0.64mi | 3/1.0 (+1) | 1,441 (+8%) | 7mo | $273,000 | $189 | 46 |
| 1654 E Rich Ave | 0.73mi | 3/1.0 (+1) | 1,476 (+10%) | 3mo | $270,000 | $183 | 41 |
| 2110 E Glass Ave | 0.50mi | 3/2.0 (+1) | 1,138 (-15%) | 4mo | $345,000 | $303 | 40 |
Match score weights: distance 35% · size 25% · config 20% · recency 20%. Top-matched comps best support the ARV.
Projected returns pro-forma
-3.0% appreciation · 3.25% rent growth · sell at horizon
- IRR
- -16.8%
- Equity multiple
- 0.41×
- Total profit
- $-31,469
- Equity at exit
- $28,181
- IRR
- -8.1%
- Equity multiple
- 0.48×
- Total profit
- $-27,310
- Equity at exit
- $16,341
Cash invested: $52,920 (down + closing). Projections, not guarantees.
Landlord ↔ Tenant lean methodology
- Overall (STATE)
- 28 Tenant-Leaning
- State Washington
- 28 Tenant-Leaning · D+8
- County
- — inherits STATE
- City
- — inherits STATE
ZIP-level market 99207
- Home prices YoY
- -21.3%
- Rents YoY
- 3.2%
- Active inventory
- 241
- Price-to-rent
- 9.8×
Monthly cashflow live
- Estimated rent
- $1,602 high interval (Pro) →
- Mortgage (P&I)
- −$991
- Tax from tax record
- −$215 /mo · $2,585/yr
- Insurance
- −$79
- HOA
- −$0
- Vacancy / Maint / Mgmt
- −$336
- Net cashflow
- $-20
Break-even live
Sensitivity live
| Price | -10% $87 | -5% $34 | +0% $-20 | +5% $-73 | +10% $-127 |
|---|---|---|---|---|---|
| Rent | -10% $-146 | -5% $-83 | +0% $-20 | +5% $44 | +10% $107 |
| Rate | -1.0pp $75 | -0.5pp $28 | base $-20 | +0.5pp $-69 | +1.0pp $-119 |
UW: 25.0% down · 7.5% · 30yr · 1.5% tax · 5.0% vac · 8.0% maint · 8.0% mgmt
Financing live
Cash to close
- Down payment
- $47,250
- Closing costs
- $5,670
- Reserves months
- —
- Total cash needed
- —
Loan-product check · same deal, 3 products live
Conventional
25% down · 7.5% · 30yr
- Down + closing
- —
- Monthly P&I
- —
- Monthly cashflow
- —
- DSCR
- —
- Eligible?
- —
Personal DTI + credit; lowest rate.
DSCR
20% down · 8.5% · 30yr
- Down + closing
- —
- Monthly P&I
- —
- Monthly cashflow
- —
- DSCR
- —
- Eligible?
- —
No personal income docs; deal must DSCR.
Hard money
10% down · 12.0% · 12mo
- Down + closing
- —
- Monthly P&I
- —
- Monthly cashflow
- —
- DSCR
- —
- Eligible?
- —
Short-term bridge; refi at stabilization.
Rent comps 19 comps
| Address | Beds | Baths | Sqft | Rent | $/sqft | DOM | Units | Dist |
|---|---|---|---|---|---|---|---|---|
| 1503 E Marietta Ave Spokane, WA | 2.0 | 1.5 | 993 | $1,775 | $1.79 | 16d | 1 | 0.32mi |
| 3316 N Nevada St Spokane, WA | 2.0 | 1.0 | 1250 | $1,395 | $1.12 | 25d | 1 | 0.39mi |
| 1007 E Carlisle Ave Spokane, WA | 2.0 | 1.5 | 1680 | $1,895 | $1.13 | 25d | 1 | 0.54mi |
| 3007 N Standard St Spokane, WA | 2.0 | 1.0 | 1178 | $1,500 | $1.27 | 16d | 1 | 0.62mi |
| 1107 E Walton Ave Spokane, WA | 3.0 | 1.0 | 1600 | $1,975 | $1.23 | 25d | 1 | 0.66mi |
| 3203 N Smith St Unit 12 Spokane, WA | 2.0 | 1.0 | 900 | $1,100 | $1.22 | 16d | 1 | 0.72mi |
| 1842 E South Riverton Ave Spokane, WA | 1.0–3.0 | 1.0–2.0 | 915 | $1,403 | $1.53 | 25d | 1 | 0.80mi |
| 717 E Lacrosse Ave Spokane, WA | 3.0 | 2.5 | 1680 | $1,995 | $1.19 | 16d | 1 | 0.82mi |
| 1608 E South Riverton Ave Spokane, WA | 3.0 | 2.0 | 1215 | $1,995 | $1.64 | 16d | 2 | 0.94mi |
| 2513 N Regal St Spokane, WA | 2.0 | 1.0 | 1000 | $1,538 | $1.54 | 16d | 3 | 0.96mi |
| 2112 N Astor St Spokane, WA | 3.0 | 1.0 | 1400 | $1,650 | $1.18 | 25d | 1 | 0.96mi |
| 1449 N Madelia St Spokane, WA | 2.0 | 1.5 | 1010 | $1,650 | $1.63 | 25d | 2 | 1.04mi |
| 2909 E Rockwell Ave Unit 2909 Spokane, WA | 2.0 | 1.0 | 1008 | $1,500 | $1.49 | 23d | 1 | 1.20mi |
| 139 W Gray Ct Unit 110 Spokane, WA | 2.0 | 1.0 | 935 | $1,295 | $1.39 | 25d | 1 | 1.23mi |
| 2011 E Desmet Ave Spokane, WA | 2.0 | 1.0 | 900 | $1,250 | $1.39 | 16d | 1 | 1.30mi |
| 3431 E Montgomery Ave #3433 Spokane, WA | 3.0 | 2.0 | 1056 | $1,795 | $1.70 | 25d | 1 | 1.42mi |
| 4207 N Normandie St Spokane, WA | 3.0 | 1.0 | 1556 | $2,300 | $1.48 | 23d | 1 | 1.43mi |
| 2523 E Desmet Ave Spokane, WA | 3.0 | 2.5 | 1500 | $1,700 | $1.13 | 16d | 1 | 1.44mi |
| 1411 E Iron Bridge Way Spokane, WA | 3.0 | 1.0–2.0 | 826 | $2,516 | $3.04 | 16d | 6 | 1.46mi |
Listing history 6 events
-
2026-05-31status $189,000 Pending 35 DOM
-
2026-05-09price $189,000
-
2026-05-09status Active
-
2026-04-26status Pending
-
2026-04-10$210,000 Active
-
1987-12-28soldstatus $12,056
ⓘ Source: listings_history table (triggers on properties + properties_extension) + one-shot
backfill from property_details.listing_events for pre-trigger history.
Tax reassessment forecast WA · Resets to sale price
- Current annual tax
- $2,585 · $215/mo
- Projected year-2 tax
- $2,585 · $215/mo
- Expected delta
- $0/yr ($0/mo · 0.0%)
ⓘ Screening estimate from a state-policy table — verify with the county assessor before closing.
Climate risk First Street
- Flood 1/10 Low FEMA zone X (unshaded) · 0% chance over 30 yrs
- Wildfire 1/10 Low
- Heat 3/10 Moderate 7 d/yr ≥94°F today · 15 d/yr by 30 yrs out
- Wind 1/10 Low
- Air quality 10/10 Extreme 19 unhealthy d/yr today · 21 by 30 yrs out
Nearby sold comps map
Loading sold comps map…
Walkable amenities ~0.75 mi
Loading nearby amenities…
Taxation est. · year 1
- Rental income
- $19,224
- − Mortgage interest
- −$10,587
- − Property taxes
- −$2,585
- − Insurance
- −$945
- − Repairs & maintenance
- −$1,538
- − Management
- −$1,538
- − Depreciation
- −$5,498
- Taxable loss
- −$3,467
- Est. tax savings @ 24.0%
- +$832
- After-tax cash flow
- $595/yr
For passive investors: Depreciation is non-cash, so a rental often shows a tax loss while cash-flowing — sheltering income. Rental losses are passive: they offset passive income freely, and up to $25,000/yr can offset ordinary (W-2) income if you actively participate and your MAGI is under $100k (phasing out to $0 by $150k); unused losses carry forward. On sale, claimed depreciation is recaptured at up to 25%, and gains may owe capital-gains tax (a 1031 exchange can defer both). Figures are a year-1 estimate at your 24.0% rate — not tax advice; consult a CPA.
Schools (NCES district)
- District
- Spokane School District
- NCES district ID
- 5308250
- Math proficiency
- 47% ▲ 1.00%
- Reading proficiency
- 58% ▲ 1.00%
- Median HH income
- $43,187
- Composite
- 46.1/100
- National rank
- #5477
- State rank
- #136 of 291 in WA
Livability — Spokane
- Score
- 80/100
- State rank
- #93
- US rank
- #1822
Category grades
Schools grade is shown separately in the Schools card above.
Census & demographics
- Census place
- Spokane, WA
- County
- Spokane County · 496,401 people
- City population
- 298,820
- Metro
- Spokane-Spokane Valley, WA
- Population (ZIP)
- 32,770
- Household income
- $60,452
- Rent vs Own
- Severe rent burden
- 1557.0
Population outlook (Spokane County) Hauer SSP2
- Today (2025)
- 531,314 people
- By 2030
- 549,278 · +3.4%
- By 2040
- 577,822 · +8.8%
- By 2050
- 598,188 · +12.6%
- By 2075
- 630,744 · +18.7%
- By 2100
- 622,360 · +17.1%
Race, ethnicity, and origin ACS 2023
- Neighborhood character
- Predominantly White (76%)
- Race & ethnicity
- White 76% Two or more races 10% Hispanic / Latino 8% Black 4% Asian 3% Native American 1%
- Hispanic origin (detail)
- Mexican 5%
- Common ancestry
- Portuguese 3% Lithuanian 3% Slovak 3%
- Foreign-born
- 6% · Canada, Vietnam, Philippines
- Languages at home
- 90% English-only · Spanish 3% Russian/Polish/Slavic 1% Other Asian/Pacific 1%
Political lean MEDSL · Spokane
- 2024 margin
- Toss-up / Even · D 46.0% · R 51.0% · Other 3.0%
- 2008→2024 swing
- -3.8pp toward R · 2008: -1.1pp · 2024: -5.0pp
- All cycles
- 2024: R+5.0 2020: R+4.3 2016: R+8.3 2012: R+6.3 2008: R+1.1
Not yet ingested
- Civics
- —
Market trends
- HPI YoY
- ▼ -103.43%
- Current HPI
- 381.758
- Rent YoY
- ▲ 3.25%
- Metro
- Spokane-Spokane Valley, WA
- State GDP YoY
- ▲ 4.65%
- F500 in state
- 22
Industry mix (Fortune 500 HQ in WA)
| Industry | F500 HQs | Revenue |
|---|---|---|
| Retail | 2 | $269B |
|
||
| Technology / Retail | 1 | $638B |
|
||
| Technology | 1 | $245B |
|
||
| Telecommunications | 1 | $38B |
|
||
| Food / Beverage | 1 | $36B |
|
||
| Automotive / Trucks | 1 | $34B |
|
||
Price history
+1467.7% since first listed5 events — show timeline
- 2026-05-09 Price Changed $189,000 SPOKANEMLS as Distributed by MLS Grid
- 2026-05-09 Relisted — SPOKANEMLS as Distributed by MLS Grid
- 2026-04-26 Pending — SPOKANEMLS as Distributed by MLS Grid
- 2026-04-10 Listed $210,000 SPOKANEMLS as Distributed by MLS Grid
- 1987-12-28 Sold (Public Records) $12,056 Public Records
Property tax history
+7.9%/yrLatest (2026): $2,585 · +7.5% YoY. Source: county tax records.
Cash-flow waterfall
monthlySold comps — $/sqft
last 12 mo · ≤1 miLoading sold comps…