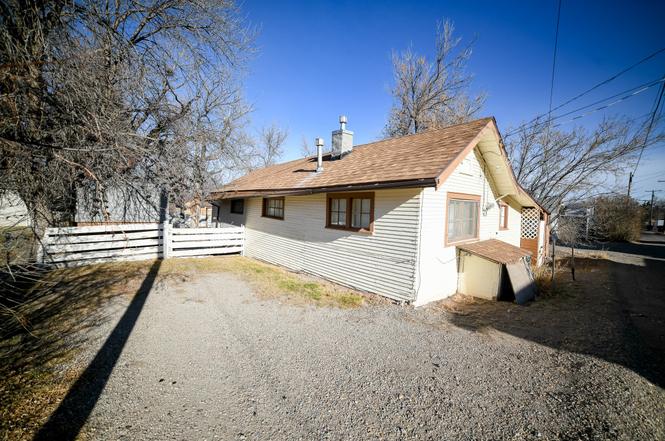
3216 2nd Ave N · Great Falls, MT
Flood risk 1/10 · Minimal
- FEMA flood zone
- X (unshaded)
- Chance of flooding over 30 yrs
- 0.0%
- Est. flood insurance / yr
- $507 – $1,088
Fire risk 3/10 · Minor
- Est. fire insurance / yr
- $918 – $1,706
Heat risk 2/10 · Minimal
- Hot days now (above 91°F)
- 6 days/yr
- Hot days in 30 yrs
- 12 days/yr
Wind risk 1/10 · Minimal
- Chance of severe wind over 30 yrs
- —
Air-quality risk 5/10 · Moderate
- Unhealthy air days now
- 8 days/yr
- Unhealthy air days in 30 yrs
- 9 days/yr
Risk factors via First Street. Map © Google.
Why this score? — see what drove the C- grade
The composite is a weighted blend of 9 inputs, each scored 0–100. Each bar is that input's sub-score; the figure is the points it added to the 100-point composite (weight × sub-score).
- Cash flow +21.6/30.0
- ARV discount +7.5/15.0
- DSCR +6.9/10.0
- 1% rule +5.1/10.0
- Rent growth +4.1/5.0
- Livability +3.9/5.0
- Schools +2.8/10.0
- Condition / age +2.5/5.0
- Appreciation +0.0/10.0
$95,000
🖨 Deal sheet 📄 Offer letter ✓ Due diligence
Key facts
- 7,492 sq ft lot
- Built 1922
- Listed 120 days
Property features AI
Finance
- Other: Public maintained, asphalt city street frontage
- HOA & community: Curbs, street lights, and sidewalks in the community
Exterior
- Parking: Alley access
- Utilities: Public water; Public sewer; Electricity connected; Natural gas available and connected; Phone available
- Home design: Single-family residence; One story
- Construction: Wood siding; Asphalt roof; Crawl space foundation (see remarks)
- Exterior features: Enclosed patio/porch; Wood fencing; Front yard; Level lot; Shed(s)
Interior
- Kitchen: Range (stove)
- Bathrooms: 1 full bathroom
- Heating & cooling: Natural gas heating; Forced air
- Interior features: Range (stove) included; Crawl space basement
- Laundry & utility: Washer hookup
Neighborhood map
What this means for you Summary
Snapshot
- This is a 1-bed/1.0-bath single-family listed at $95k.
Deal economics
- At list price, monthly cash flow is $144 ($2k/yr) — positive.
- The deal already cash-flows at list — no discount required.
- Meets the 1% rule at list price ($961 rent vs $95k).
- Recommended offer: $86k (9.0% below list) — sets the bar for market timing.
- Cap rate 8.1% vs local median 3.5% in Great Falls — top-decile yield for the area; either an underpriced asset or a hidden risk that comps aren't pricing in. Stress-test before assuming the spread holds.
Location & tenants
- Location reads 78/100 on livability (#19 in MT, #2,473 nationally) — a middle-class / working-renter tenant base. Strengths: amenities A+, cost of living A+, housing A+; Watch: schools C-, employment C-, crime F.
- Great Falls H S (urban): math 27% / reading 39% proficiency, ranked #79 of 116 in MT (top 68%) — families likely to look elsewhere, expect single-tenant / working-renter base with shorter leases.
- Market conditions: Rents rising fast (+6.5%/yr); 49 active listings in the ZIP; 223 units permitted in Cascade County in 2024 (37 in 5+ unit buildings).
Forward outlook
- Local home prices are declining (-3.0%/yr); year-one equity from $657 of loan paydown is wiped out by about $3k of value loss. Plan a longer hold.
- Cascade County population projected to shrink 5% by 2050 — rents likely to lag national; underwrite the cash flow, not the appreciation.
- At projected returns (-3.0% appreciation + 6.5% rent growth), your $27k cash investment doubles in ~10 years — after that, you're playing with house money.
Negotiation context
- It's been on market 120 days — a 9% lower offer ($86k) is reasonable based on typical stale-listing flexibility.
Risks & watch-outs
- Watch-outs: built in 1922 — expect roof / HVAC / electrical / plumbing capex.
Questions for the listing agent
- It's been on market 120 days. Have you received any prior offers? Is the seller open to a 9% concession, seller financing, or rate buy-down credit?
- Built in 1922 — when were the roof, HVAC, electrical panel, plumbing, and water heater last replaced?
- Why hasn't it sold? Are there any deal-killer items the seller is aware of (foundation, flood, title, zoning, code violations)?
- Is there a deadline driving the sale (1031 exchange, divorce, estate, relocation)? That informs how much negotiation room exists.
- Crime grade is F in this area — have there been break-ins, vandalism, or insurance claims at this property in the last 3 years? What carrier currently insures it and at what premium?
- What's the average days-on-market for RENTAL listings here right now (not sales)? A rising rental-DOM trend means longer vacancies and softer asking-rent achievability than the comps imply.
- What's the recent tenant-quality profile in this submarket — average credit score on applications, eviction rate, late-payment / NSF rate, and stable-employment percentage? A property-management company in the area should have these aggregated.
- How much new for-sale + rental construction is in the pipeline within 1–3 miles? Heavy new supply typically softens prices + rents 12–24 months out; constrained supply supports both.
Investment metrics
- 1% rule
- 1.01% ✓
- Cap rate
- 8.12%
- Cash-on-cash
- 6.51%
- DSCR
- 1.29
- GRM
- 8.2
CMA / ARV
No comps found within radius.
Projected returns pro-forma
-3.0% appreciation · 6.48% rent growth · sell at horizon
- IRR
- -2.6%
- Equity multiple
- 0.90×
- Total profit
- $-2,736
- Equity at exit
- $14,165
- IRR
- 10.4%
- Equity multiple
- 1.93×
- Total profit
- $24,753
- Equity at exit
- $8,214
Cash invested: $26,600 (down + closing). Projections, not guarantees.
Landlord ↔ Tenant lean methodology
- Overall (STATE)
- 82 Strongly Landlord-Friendly
- State Montana
- 82 Strongly Landlord-Friendly · R+11
- County
- — inherits STATE
- City
- — inherits STATE
ZIP-level market 59401
- Rents YoY
- 6.5%
- Active inventory
- 49
- Price-to-rent
- 8.2×
Monthly cashflow live
- Estimated rent
- $961 medium interval (Pro) →
- Mortgage (P&I)
- −$498
- Tax from tax record
- −$77 /mo · $925/yr
- Insurance
- −$40
- HOA
- −$0
- Vacancy / Maint / Mgmt
- −$202
- Net cashflow
- $144
Break-even live
UW: 25.0% down · 7.5% · 30yr · 1.5% tax · 5.0% vac · 8.0% maint · 8.0% mgmt
Financing live
Cash to close
- Down payment
- $23,750
- Closing costs
- $2,850
- Reserves months
- —
- Total cash needed
- —
Loan-product check · same deal, 3 products live
Conventional
25% down · 7.5% · 30yr
- Down + closing
- —
- Monthly P&I
- —
- Monthly cashflow
- —
- DSCR
- —
- Eligible?
- —
Personal DTI + credit; lowest rate.
DSCR
20% down · 8.5% · 30yr
- Down + closing
- —
- Monthly P&I
- —
- Monthly cashflow
- —
- DSCR
- —
- Eligible?
- —
No personal income docs; deal must DSCR.
Hard money
10% down · 12.0% · 12mo
- Down + closing
- —
- Monthly P&I
- —
- Monthly cashflow
- —
- DSCR
- —
- Eligible?
- —
Short-term bridge; refi at stabilization.
Listing history 2 events
-
2026-05-20status Pending
-
2026-01-20$95,000 Active
ⓘ Source: listings_history table (triggers on properties + properties_extension) + one-shot
backfill from property_details.listing_events for pre-trigger history.
Tax reassessment forecast MT · Resets to sale price
- Current annual tax
- $925 · $77/mo
- Projected year-2 tax
- $925 · $77/mo
- Expected delta
- $0/yr ($0/mo · 0.0%)
ⓘ Screening estimate from a state-policy table — verify with the county assessor before closing.
Climate risk First Street
- Flood 1/10 Low FEMA zone X (unshaded) · 0% chance over 30 yrs
- Wildfire 3/10 Moderate
- Heat 2/10 Low 6 d/yr ≥91°F today · 12 d/yr by 30 yrs out
- Wind 1/10 Low
- Air quality 5/10 Major 8 unhealthy d/yr today · 9 by 30 yrs out
Nearby sold comps map
Loading sold comps map…
Walkable amenities ~0.75 mi
Loading nearby amenities…
Taxation est. · year 1
- Rental income
- $11,531
- − Mortgage interest
- −$5,321
- − Property taxes
- −$925
- − Insurance
- −$475
- − Repairs & maintenance
- −$922
- − Management
- −$922
- − Depreciation
- −$2,764
- Taxable income
- $201
- Est. tax owed @ 24.0%
- −$48
- After-tax cash flow
- $1,683/yr
For passive investors: Depreciation is non-cash, so a rental often shows a tax loss while cash-flowing — sheltering income. Rental losses are passive: they offset passive income freely, and up to $25,000/yr can offset ordinary (W-2) income if you actively participate and your MAGI is under $100k (phasing out to $0 by $150k); unused losses carry forward. On sale, claimed depreciation is recaptured at up to 25%, and gains may owe capital-gains tax (a 1031 exchange can defer both). Figures are a year-1 estimate at your 24.0% rate — not tax advice; consult a CPA.
Schools (NCES district)
- District
- Great Falls H S
- NCES district ID
- 3013050
- Math proficiency
- 27% ▼ -6.00%
- Reading proficiency
- 39% ▼ -3.00%
- Median HH income
- $43,586
- Composite
- 28.03/100
- National rank
- #6846
- State rank
- #79 of 116 in MT
Livability — Great Falls
- Score
- 78/100
- State rank
- #19
- US rank
- #2473
Category grades
Schools grade is shown separately in the Schools card above.
Census & demographics
- Census place
- Great Falls, MT
- County
- Cascade County · 75,427 people
- City population
- 75,427
- Metro
- Great Falls, MT
- Population (ZIP)
- 13,255
- Household income
- $55,299
- Rent vs Own
- Severe rent burden
- 531.0
Population outlook (Cascade County) Hauer SSP2
- Today (2025)
- 81,936 people
- By 2030
- 81,376 · -0.7%
- By 2040
- 79,435 · -3.1%
- By 2050
- 77,906 · -4.9%
- By 2075
- 78,595 · -4.1%
- By 2100
- 79,997 · -2.4%
Race, ethnicity, and origin ACS 2023
- Neighborhood character
- Predominantly White (81%)
- Race & ethnicity
- White 81% Two or more races 7% Native American 7% Hispanic / Latino 6%
- Hispanic origin (detail)
- Mexican 4% Puerto Rican 1%
- Common ancestry
- Portuguese 7% Italian 4% Slovak 2%
- Foreign-born
- 1% · China, Canada
- Languages at home
- 96% English-only · Spanish 1% Chinese 1%
Political lean MEDSL · Cascade
- 2024 margin
- Strong R (+22.3) · D 37.3% · R 59.6% · Other 3.0%
- 2008→2024 swing
- -24.6pp toward R · 2008: 2.3pp · 2024: -22.3pp
- All cycles
- 2024: R+22.3 2020: R+19.7 2016: R+21.6 2012: R+9.1 2008: D+2.3
Not yet ingested
- Civics
- —
Market trends
- HPI YoY
- ▼ -119.63%
- Current HPI
- 198.2599
- Rent YoY
- ▲ 6.48%
- Metro
- Great Falls, MT
- State GDP YoY
- ▲ 3.41%
- F500 in state
- 2
Industry mix (Fortune 500 HQ in MT)
| Industry | F500 HQs | Revenue |
|---|---|---|
| Technology / Analytics | 1 | $2B |
|
||
Price history
2 events — show timeline
- 2026-05-20 Pending — MRMLS
- 2026-01-20 Listed $95,000 MRMLS
Property tax history
+2.7%/yrLatest (2025): $925 · -28.6% YoY. Source: county tax records.
Cash-flow waterfall
monthlySold comps — $/sqft
last 12 mo · ≤1 miLoading sold comps…