 Multi-family
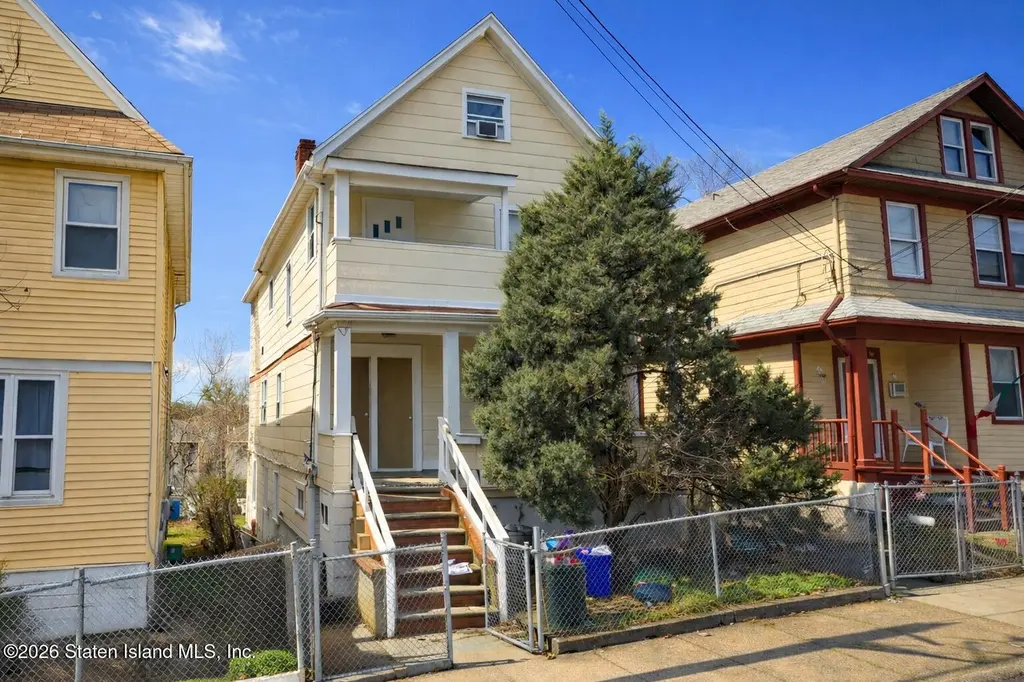
51 Taft Ave · New York, NY
Flood risk 1/10 · Minimal
- FEMA flood zone
- X (unshaded)
- Chance of flooding over 30 yrs
- 0.0%
- Est. flood insurance / yr
- $507 – $1,088
Fire risk 1/10 · Minimal
- Est. fire insurance / yr
- $691 – $1,283
Heat risk 7/10 · Major
- Hot days now (above 98°F)
- 7 days/yr
- Hot days in 30 yrs
- 15 days/yr
Wind risk 6/10 · Moderate
- Chance of severe wind over 30 yrs
- 54.0%
Air-quality risk 4/10 · Minor
- Unhealthy air days now
- 5 days/yr
- Unhealthy air days in 30 yrs
- 7 days/yr
Risk factors via First Street. Map © Google.
Why this score? — see what drove the B grade
The composite is a weighted blend of 9 inputs, each scored 0–100. Each bar is that input's sub-score; the figure is the points it added to the 100-point composite (weight × sub-score).
- Cash flow +30.0/30.0
- DSCR +10.0/10.0
- ARV discount +9.7/15.0
- 1% rule +8.2/10.0
- Schools +5.0/10.0
- Rent growth +4.0/5.0
- Livability +3.8/5.0
- Condition / age +2.5/5.0
- Appreciation +0.0/10.0
$619,999
🖨 Deal sheet 📄 Offer letter ✓ Due diligence
Multi-family units
County records classify this as Multi-Family (2-4 Unit). Listing-text estimate: 1 unit. estimate disagrees with records
Listing remarks MLS
REPLACED WINDOWS,NEW WATER HEATER,FINISHED BASEMENT.GOOD INCOME. Level 1: BAS-3/4BATH,BR,LR,SUMMER KIT,UTIL RM,LAUN RM. LV1-2BR,LR,DR,EIK,FULL BATH. LV2-3BR,LR,DR,EIK,FULL BATH.
Key facts
- Public transit
- Private entrances
- 2,500 sq ft lot
Tags
Property features AI
Finance
- Other: Taxes listed (amount omitted per instructions)
- Financial info: Two residential units (one unit listed with $1,600 monthly rent); Total of 1 unit reported as primary (see unit details)
Exterior
- Parking: On-street parking
- Utilities: 220 volt electric service
- Home design: Two-story multi-family building; Approximate year built
- Construction: Asbestos siding/materials; Total building area listed
- Exterior features: Lot approximately 25 x 100 (0.06 acres); Zoned R-4; Property condition described as good to excellent
Interior
- Bedrooms: Unit 1: 2 bedrooms; Unit 2 (2nd level): 4 bedrooms
- Bathrooms: 2 full bathrooms total (property)
- Heating & cooling: Natural gas heating; Hot water heating; Cooling via units
- Interior features: Finished basement; Unit air conditioning
Neighborhood map
What this means for you Summary
Snapshot
- This is a 6-bed/2.0-bath multifamily listed at $620k.
Deal economics
- At list price, monthly cash flow is $3k ($30k/yr) — positive.
- The deal already cash-flows at list — no discount required.
- Meets the 1% rule at list price ($8k rent vs $620k).
- Recommended offer: $583k (6.0% below list) — sets the bar for market timing.
- Cap rate 11.2% vs local median 2.6% in New York — top-decile yield for the area; either an underpriced asset or a hidden risk that comps aren't pricing in. Stress-test before assuming the spread holds.
Location & tenants
- Location reads 75/100 on livability (#268 in NY, #4,188 nationally) — a middle-class / working-renter tenant base. Strengths: amenities A+, commute A+, health & safety A; Watch: crime F, cost of living F.
- Market conditions: Rents rising fast (+6.1%/yr); 263 active listings in the ZIP; solid renter incomes; 480 units permitted in Richmond County in 2024 (22 in 5+ unit buildings).
- At $8,206/mo this rent would consume 115% of the median local household income ($86k/yr) (locally 2008% of renters already pay >50% of income on rent) — very limited rent-growth headroom before tenants either downsize or default.
Forward outlook
- Local home prices are declining (-3.0%/yr); year-one equity from $4k of loan paydown is wiped out by about $19k of value loss. Plan a longer hold.
- Richmond County population projected to shrink 5% by 2050 — rents likely to lag national; underwrite the cash flow, not the appreciation.
- At projected returns (-3.0% appreciation + 6.1% rent growth), your $174k cash investment doubles in ~6 years — after that, you're playing with house money.
Negotiation context
- It's been on market 76 days — a 6% lower offer ($583k) is reasonable based on typical stale-listing flexibility.
- 3 sale attempts since 24y ago with the ask held roughly flat each time — persistent listings suggest the price (not the market) is what's stuck; bring a comps-based counter.
- Current owner paid $360k; list at $620k implies a 72% gain — meaningful room to come down on a strong offer.
Risks & watch-outs
- Watch-outs: built in 1920 — expect roof / HVAC / electrical / plumbing capex.
- Climate carrying-cost: major wind risk, 54% chance of damaging wind over 30y; extreme-heat days projected 7→15/yr by 2055 (HVAC capex compounding) — expect insurance premiums to compound above CPI over the hold.
Questions for the listing agent
- It's been on market 76 days. Have you received any prior offers? Is the seller open to a 6% concession, seller financing, or rate buy-down credit?
- Built in 1920 — when were the roof, HVAC, electrical panel, plumbing, and water heater last replaced?
- Why hasn't it sold? Are there any deal-killer items the seller is aware of (foundation, flood, title, zoning, code violations)?
- Is there a deadline driving the sale (1031 exchange, divorce, estate, relocation)? That informs how much negotiation room exists.
- Schools are B-rated — typically a magnet for longer-tenancy family renters. What's the average tenant stay here, and is there a school-zone premium baked into asking?
- Crime grade is F in this area — have there been break-ins, vandalism, or insurance claims at this property in the last 3 years? What carrier currently insures it and at what premium?
- What's the average days-on-market for RENTAL listings here right now (not sales)? A rising rental-DOM trend means longer vacancies and softer asking-rent achievability than the comps imply.
- What's the recent tenant-quality profile in this submarket — average credit score on applications, eviction rate, late-payment / NSF rate, and stable-employment percentage? A property-management company in the area should have these aggregated.
- How much new apartment / multifamily construction is in the pipeline within 1–3 miles? Heavy new supply (>2% of stock underway) typically softens rents 12–24 months out; light construction supports rent growth.
Investment metrics
- 1% rule
- 1.32% ✓
- Cap rate
- 11.16%
- Cash-on-cash
- 17.39%
- DSCR
- 1.77
- GRM
- 6.3
CMA / ARV
- ARV (on-the-fly)
- $651,456
- Comps found
- 3
Show comp detail 3 sales within ~0.75 mi
| Address | Dist | Beds/Ba | Sqft | Sold | Price | $/sf | Match |
|---|---|---|---|---|---|---|---|
| 24 Webster Ave | 0.48mi | 5/2.5 (-1) | 2,024 (+8%) | 4mo | $705,000 | $348 | 53 |
| 106 Westervelt Ave | 0.27mi | 6/5.0 | 2,075 (+11%) | 11mo | $550,000 | $265 | 48 |
| 190 W Buchanan St | 0.53mi | 5/2.5 (-1) | 1,657 (-12%) | 3mo | $790,000 | $477 | 46 |
Match score weights: distance 35% · size 25% · config 20% · recency 20%. Top-matched comps best support the ARV.
Projected returns pro-forma
-3.0% appreciation · 6.07% rent growth · sell at horizon
- IRR
- 12.0%
- Equity multiple
- 1.49×
- Total profit
- $85,803
- Equity at exit
- $92,444
- IRR
- 23.2%
- Equity multiple
- 3.27×
- Total profit
- $394,918
- Equity at exit
- $53,606
Cash invested: $173,600 (down + closing). Projections, not guarantees.
Landlord ↔ Tenant lean methodology
- Overall (CITY)
- 0 Strongly Tenant-Friendly
- State New York
- 15 Strongly Tenant-Friendly · D+10
- County
- — inherits STATE
- City New York
- 0 Strongly Tenant-Friendly · D+34
ZIP-level market 10301
- Rents YoY
- 6.1%
- Active inventory
- 263
- Price-to-rent
- 18.9×
Monthly cashflow live
- Estimated rent
- $8,206 medium interval (Pro) →
- Mortgage (P&I)
- −$3,251
- Tax from tax record
- −$458 /mo · $5,491/yr
- Insurance
- −$258
- HOA
- −$0
- Vacancy / Maint / Mgmt
- −$1,723
- Net cashflow
- $2,516
Break-even live
3-unit breakdown (identical units grouped — click to expand)
| Units | Beds | Baths | Est. rent |
|---|---|---|---|
| 3× units | 2 | 1 | $8,205 |
| #1 | 2 | 1 | $2,735 |
| #2 | 2 | 1 | $2,735 |
| #3 | 2 | 1 | $2,735 |
| Total (3 units) | $8,206 | ||
UW: 25.0% down · 7.5% · 30yr · 1.5% tax · 5.0% vac · 8.0% maint · 8.0% mgmt
Financing live
Cash to close
- Down payment
- $155,000
- Closing costs
- $18,600
- Reserves months
- —
- Total cash needed
- —
Loan-product check · same deal, 3 products live
Conventional
25% down · 7.5% · 30yr
- Down + closing
- —
- Monthly P&I
- —
- Monthly cashflow
- —
- DSCR
- —
- Eligible?
- —
Personal DTI + credit; lowest rate.
DSCR
20% down · 8.5% · 30yr
- Down + closing
- —
- Monthly P&I
- —
- Monthly cashflow
- —
- DSCR
- —
- Eligible?
- —
No personal income docs; deal must DSCR.
Hard money
10% down · 12.0% · 12mo
- Down + closing
- —
- Monthly P&I
- —
- Monthly cashflow
- —
- DSCR
- —
- Eligible?
- —
Short-term bridge; refi at stabilization.
Listing history 19 events
-
2026-06-18days on market $619,999 Active 76 DOM
-
2026-06-17days on market $619,999 Active 75 DOM
-
2026-06-15days on market $619,999 Active 73 DOM
-
2026-06-13days on market $619,999 Active 71 DOM
-
2026-06-10days on market $619,999 Active 67 DOM
-
2026-06-08days on market $619,999 Active 66 DOM
-
2026-06-08days on market $619,999 Active 65 DOM
-
2026-06-04days on market $619,999 Active 62 DOM
-
2026-06-03days on market $619,999 Active 61 DOM
-
2026-06-01days on market $619,999 Active 59 DOM
-
2026-05-31days on market $619,999 Active 58 DOM
-
2026-05-21price $619,999
-
2026-04-03$649,999 Active
-
2016-02-17historical
-
2003-10-14soldstatus $360,000
-
2003-04-29$359,900
-
2002-07-30soldstatus $210,000 179-char remark
Show marketing remark (179 chars)
REPLACED WINDOWS,NEW WATER HEATER,FINISHED BASEMENT.GOOD INCOME. Level 1: BAS-3/4BATH,BR,LR,SUMMER KIT,UTIL RM,LAUN RM. LV1-2BR,LR,DR,EIK,FULL BATH. LV2-3BR,LR,DR,EIK,FULL BATH.
-
2002-03-18$229,000 179-char remark
Show marketing remark (179 chars)
REPLACED WINDOWS,NEW WATER HEATER,FINISHED BASEMENT.GOOD INCOME. Level 1: BAS-3/4BATH,BR,LR,SUMMER KIT,UTIL RM,LAUN RM. LV1-2BR,LR,DR,EIK,FULL BATH. LV2-3BR,LR,DR,EIK,FULL BATH.
-
1986-12-29soldstatus $102,500
ⓘ Source: listings_history table (triggers on properties + properties_extension) + one-shot
backfill from property_details.listing_events for pre-trigger history.
Tax reassessment forecast NY · Partial reset (capped growth)
- Current annual tax
- $5,491 · $458/mo
- Projected year-2 tax
- $7,984 · $665/mo
- Expected delta
- +$2,494/yr (+$208/mo · 45.4%)
ⓘ Screening estimate from a state-policy table — verify with the county assessor before closing.
Climate risk First Street
- Flood 1/10 Low FEMA zone X (unshaded) · 0% chance over 30 yrs
- Wildfire 1/10 Low
- Heat 7/10 Severe 7 d/yr ≥98°F today · 15 d/yr by 30 yrs out
- Wind 6/10 Major 54% chance of damaging wind over 30 yrs
- Air quality 4/10 Moderate 5 unhealthy d/yr today · 7 by 30 yrs out
Nearby sold comps map
Loading sold comps map…
Walkable amenities ~0.75 mi
Loading nearby amenities…
Taxation est. · year 1
- Rental income
- $98,472
- − Mortgage interest
- −$34,730
- − Property taxes
- −$5,491
- − Insurance
- −$3,100
- − Repairs & maintenance
- −$7,878
- − Management
- −$7,878
- − Depreciation
- −$18,036
- Taxable income
- $21,360
- Est. tax owed @ 24.0%
- −$5,126
- After-tax cash flow
- $25,060/yr
For passive investors: Depreciation is non-cash, so a rental often shows a tax loss while cash-flowing — sheltering income. Rental losses are passive: they offset passive income freely, and up to $25,000/yr can offset ordinary (W-2) income if you actively participate and your MAGI is under $100k (phasing out to $0 by $150k); unused losses carry forward. On sale, claimed depreciation is recaptured at up to 25%, and gains may owe capital-gains tax (a 1031 exchange can defer both). Figures are a year-1 estimate at your 24.0% rate — not tax advice; consult a CPA.
Schools (NCES district)
No district data.
Livability — New York
- Score
- 75/100
- State rank
- #268
- US rank
- #4188
Category grades
Schools grade is shown separately in the Schools card above.
Census & demographics
- Census place
- New York, NY
- County
- Richmond County · 404,174 people
- City population
- 7,731,280
- Metro
- New York-Newark-Jersey City, NY-NJ-PA
- Population (ZIP)
- 41,052
- Household income
- $85,609
- Rent vs Own
- Severe rent burden
- 2008.0
Population outlook (Richmond County) Hauer SSP2
- Today (2025)
- 482,784 people
- By 2030
- 481,831 · -0.2%
- By 2040
- 473,159 · -2.0%
- By 2050
- 457,242 · -5.3%
- By 2075
- 408,029 · -15.5%
- By 2100
- 341,459 · -29.3%
Race, ethnicity, and origin ACS 2023
- Neighborhood character
- Highly diverse neighborhood (Simpson 0.72)
- Race & ethnicity
- White 37% Hispanic / Latino 29% Black 23% Two or more races 16% Asian 7%
- Hispanic origin (detail)
- Mexican 5% Puerto Rican 10% Cuban 2% Dominican 6%
- Common ancestry
- Romanian 3% Scotch-Irish 2% Italian 1%
- Foreign-born
- 22% · Canada, China, Jamaica
- Languages at home
- 68% English-only · Spanish 16% Other Indo-European 5% Russian/Polish/Slavic 3%
Political lean MEDSL · Richmond
- 2024 margin
- Strong R (+29.8) · D 35.1% · R 64.9%
- 2008→2024 swing
- -25.7pp toward R · 2008: -4.0pp · 2024: -29.8pp
- All cycles
- 2024: R+29.8 2020: R+14.9 2016: R+16.8 2012: D+0.8 2008: R+4.0
Not yet ingested
- Civics
- —
Market trends
- HPI YoY
- ▼ -407.37%
- Current HPI
- 319.0616
- Rent YoY
- ▲ 6.07%
- Metro
- New York-Newark-Jersey City, NY-NJ-PA
- State GDP YoY
- ▲ 2.60%
- F500 in state
- 92
Industry mix (Fortune 500 HQ in NY)
| Industry | F500 HQs | Revenue |
|---|---|---|
| Financial Services | 10 | $950B |
|
||
| Consumer Goods | 9 | $162B |
|
||
| Insurance | 4 | $225B |
|
||
| Telecommunications | 2 | $144B |
|
||
| Pharmaceuticals | 2 | $112B |
|
||
| Media / Entertainment | 2 | $69B |
|
||
Price history
+504.9% since first listed8 events — show timeline
- 2026-05-21 Price Changed $619,999 SIBORMLS
- 2026-04-03 Listed $649,999 SIBORMLS
- 2016-02-17 Listing Removed — SIBORMLS
- 2003-10-14 Sold (Public Records) $360,000 Public Records
- 2003-04-29 Listed $359,900 SIBORMLS
- 2002-07-30 Sold (MLS) $210,000 SIBORMLS
- 2002-03-18 Listed $229,000 SIBORMLS
- 1986-12-29 Sold (Public Records) $102,500 Public Records
Property tax history
+5.9%/yrLatest (2025): $5,491 · +6.0% YoY. Source: county tax records.
Cash-flow waterfall
monthlySold comps — $/sqft
last 12 mo · ≤1 miLoading sold comps…