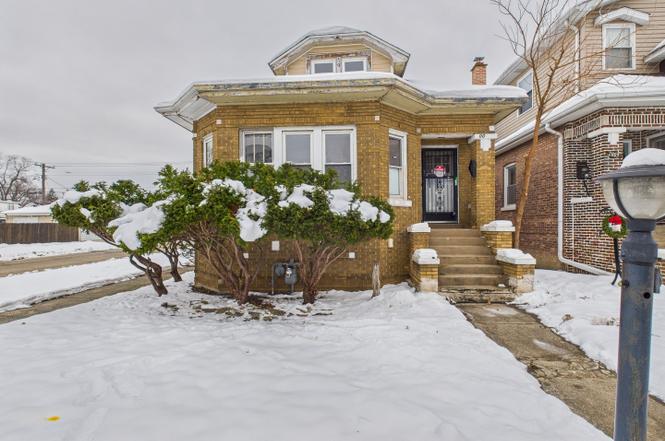
2001 S 11th Ave · Maywood, IL
Flood risk 1/10 · Minimal
- FEMA flood zone
- X (unshaded)
- Chance of flooding over 30 yrs
- 0.0%
- Est. flood insurance / yr
- $507 – $1,088
Fire risk 1/10 · Minimal
- Est. fire insurance / yr
- $804 – $1,492
Heat risk 3/10 · Minor
- Hot days now (above 100°F)
- 7 days/yr
- Hot days in 30 yrs
- 14 days/yr
Wind risk 2/10 · Minimal
- Chance of severe wind over 30 yrs
- 1.0%
Air-quality risk 5/10 · Moderate
- Unhealthy air days now
- 6 days/yr
- Unhealthy air days in 30 yrs
- 8 days/yr
Risk factors via First Street. Map © Google.
Why this score? — see what drove the C+ grade
The composite is a weighted blend of 9 inputs, each scored 0–100. Each bar is that input's sub-score; the figure is the points it added to the 100-point composite (weight × sub-score).
- Cash flow +20.2/30.0
- ARV discount +15.0/15.0
- 1% rule +8.8/10.0
- DSCR +6.4/10.0
- Livability +3.9/5.0
- Rent growth +2.5/5.0
- Condition / age +2.5/5.0
- Schools +1.9/10.0
- Appreciation +0.0/10.0
$179,900
🖨 Deal sheet 📄 Offer letter ✓ Due diligence
Listing remarks
Located on a large corner lot, this spacious brick bungalow offers an expansive floor plan and tons of upside! As you walk into the home you will love the character and charm of the natural hardwood floors which run throughout the property, the octagon layout in the living room offers more space than a traditional bungalow with tons of windows to allow natural sunlight into the home. There are two bedrooms on the main level with an additional two bedrooms on the second level. The basement is finished as well and provides additional living space. This home offers amazing upside and should be looked at today.
Key facts
- 4,375 sq ft lot
- 2 garage spots
- Built 1926
Neighborhood map
What this means for you Summary
Snapshot
- This is a 3-bed/1.5-bath single-family listed at $180k.
Deal economics
- At list price, monthly cash flow is $228 ($3k/yr) — positive.
- The deal already cash-flows at list — no discount required.
- Meets the 1% rule at list price ($2k rent vs $180k).
- Cap rate 7.8% vs local median 4.5% in Maywood — top-decile yield for the area; either an underpriced asset or a hidden risk that comps aren't pricing in. Stress-test before assuming the spread holds.
Location & tenants
- Location reads 78/100 on livability (#146 in IL, #2,694 nationally) — a middle-class / working-renter tenant base. Strengths: commute A+, cost of living A+, housing A+; Watch: health & safety C-, crime D+, schools F.
- Maywood-Melrose Park-Broadview 89 (suburban): math 14% / reading 21% proficiency, ranked #738 of 919 in IL (top 80%) — low school quality limits family demand, transient renter base, plan for 1-2y turnover; 74% free/reduced lunch — lower-income household profile, screen leases tightly.
- Market conditions: 72 active listings in the ZIP; 10 comparable units currently listed for rent nearby; rentals leasing fast (median 7d on market — plan ~1-2 weeks tenant-placement turnaround); 6,272 units permitted in Cook County in 2024 (4,658 in 5+ unit buildings).
- This rent runs 43% of the median local income ($69k/yr) — at the standard rent-burdened threshold; future hikes will face affordability resistance.
Forward outlook
- Local home prices are declining (-3.0%/yr); year-one equity from $1k of loan paydown is wiped out by about $5k of value loss. Plan a longer hold.
Negotiation context
- Only 14 days on market — expect competitive offers; lowballing is unlikely to land.
- 4 sale attempts since 12y ago with the ask held roughly flat each time — persistent listings suggest the price (not the market) is what's stuck; bring a comps-based counter.
Risks & watch-outs
- Watch-outs: property tax is 4.8% of price; built in 1926 — expect roof / HVAC / electrical / plumbing capex.
Questions for the listing agent
- Built in 1926 — when were the roof, HVAC, electrical panel, plumbing, and water heater last replaced?
- Property tax is high relative to price — has the assessment been appealed recently, and will the sale trigger a re-assessment?
- Is there a deadline driving the sale (1031 exchange, divorce, estate, relocation)? That informs how much negotiation room exists.
- Schools are F-rated, which usually means shorter tenancies and higher turnover. Who's the typical renter profile here, and what's been the actual vacancy rate?
- Crime grade is D in this area — have there been break-ins, vandalism, or insurance claims at this property in the last 3 years? What carrier currently insures it and at what premium?
- What's the average days-on-market for RENTAL listings here right now (not sales)? A rising rental-DOM trend means longer vacancies and softer asking-rent achievability than the comps imply.
- What's the recent tenant-quality profile in this submarket — average credit score on applications, eviction rate, late-payment / NSF rate, and stable-employment percentage? A property-management company in the area should have these aggregated.
- How much new for-sale + rental construction is in the pipeline within 1–3 miles? Heavy new supply typically softens prices + rents 12–24 months out; constrained supply supports both.
Investment metrics
- 1% rule
- 1.38% ✓
- Cap rate
- 7.81%
- Cash-on-cash
- 5.43%
- DSCR
- 1.24
- GRM
- 6.0
CMA / ARV
- ARV (on-the-fly)
- $281,736
- Comps found
- 12
Show comp detail 12 sales within ~0.75 mi
| Address | Dist | Beds/Ba | Sqft | Sold | Price | $/sf | Match |
|---|---|---|---|---|---|---|---|
| 1844 S 13th Ave | 0.22mi | 3/1.5 | 1,404 (-9%) | 1mo | $177,000 | $126 | 73 |
| 1840 S 7th Ave | 0.26mi | 3/1.0 | 1,444 (-7%) | 2mo | $161,500 | $112 | 73 |
| 1920 S 6th Ave | 0.29mi | 4/3.0 (+1) | 1,589 (+3%) | 8mo | $360,000 | $227 | 64 |
| 2122 S 2nd Ave | 0.57mi | 3/2.0 | 1,500 (-3%) | 6mo | $300,000 | $200 | 61 |
| 2422 S 12th Ave | 0.56mi | 2/1.5 (-1) | 1,500 (-3%) | 4mo | $297,500 | $198 | 60 |
| 2428 S 12th Ave | 0.58mi | 4/1.5 (+1) | 1,500 (-3%) | 4mo | $305,000 | $203 | 60 |
| 1923 S 4th Ave | 0.45mi | 3/2.0 | 1,680 (+8%) | 7mo | $306,000 | $182 | 57 |
| 1710 S 2nd Ave | 0.61mi | 3/2.0 | 1,400 (-10%) | 4mo | $250,000 | $179 | 50 |
| 1911 S 18th Ave | 0.45mi | 4/1.0 (+1) | 1,340 (-13%) | 1mo | $130,000 | $97 | 48 |
| 2512 S 14th Ave | 0.70mi | 3/2.0 | 1,402 (-9%) | 5mo | $180,000 | $128 | 45 |
| 2032 S 22nd Ave | 0.74mi | 3/2.0 | 1,408 (-9%) | 6mo | $235,000 | $167 | 43 |
| 2432 S 13th Ave | 0.60mi | 4/2.0 (+1) | 1,372 (-11%) | 4mo | $287,000 | $209 | 42 |
Match score weights: distance 35% · size 25% · config 20% · recency 20%. Top-matched comps best support the ARV.
Projected returns pro-forma
-3.0% appreciation · 3.0% rent growth · sell at horizon
- IRR
- -7.7%
- Equity multiple
- 0.72×
- Total profit
- $-14,302
- Equity at exit
- $26,824
- IRR
- 2.1%
- Equity multiple
- 1.15×
- Total profit
- $7,613
- Equity at exit
- $15,554
Cash invested: $50,372 (down + closing). Projections, not guarantees.
Landlord ↔ Tenant lean methodology
- Overall (STATE)
- 43 Moderately Tenant-Leaning
- State Illinois
- 43 Moderately Tenant-Leaning · D+7
- County
- — inherits STATE
- City
- — inherits STATE
ZIP-level market 60153
- Home prices YoY
- -20.5%
- Active inventory
- 72
- Price-to-rent
- 6.0×
Monthly cashflow live
- Estimated rent
- $2,486 high interval (Pro) →
- Mortgage (P&I)
- −$943
- Tax from tax record
- −$718 /mo · $8,617/yr
- Insurance
- −$75
- HOA
- −$0
- Vacancy / Maint / Mgmt
- −$522
- Net cashflow
- $228
Break-even live
UW: 25.0% down · 7.5% · 30yr · 1.5% tax · 5.0% vac · 8.0% maint · 8.0% mgmt
Financing live
Cash to close
- Down payment
- $44,975
- Closing costs
- $5,397
- Reserves months
- —
- Total cash needed
- —
Loan-product check · same deal, 3 products live
Conventional
25% down · 7.5% · 30yr
- Down + closing
- —
- Monthly P&I
- —
- Monthly cashflow
- —
- DSCR
- —
- Eligible?
- —
Personal DTI + credit; lowest rate.
DSCR
20% down · 8.5% · 30yr
- Down + closing
- —
- Monthly P&I
- —
- Monthly cashflow
- —
- DSCR
- —
- Eligible?
- —
No personal income docs; deal must DSCR.
Hard money
10% down · 12.0% · 12mo
- Down + closing
- —
- Monthly P&I
- —
- Monthly cashflow
- —
- DSCR
- —
- Eligible?
- —
Short-term bridge; refi at stabilization.
Rent comps 10 comps
| Address | Beds | Baths | Sqft | Rent | $/sqft | DOM | Units | Dist |
|---|---|---|---|---|---|---|---|---|
| 1610 S 4th Ave Maywood, IL | 3.0 | 2.5 | 1754 | $4,500 | $2.57 | 1d | 1 | 0.55mi |
| 2036 S 1st Ave Maywood, IL | 4.0 | 2.0 | 1363 | $2,750 | $2.02 | 1d | 1 | 0.64mi |
| 410 School St Unit 1B Maywood, IL | 3.0 | 2.0 | 1218 | $2,200 | $1.81 | 1d | 1 | 0.90mi |
| 1814 Warren St Unit 2W Maywood, IL | 3.0 | 1.0 | 1200 | $2,500 | $2.08 | 1d | 1 | 0.99mi |
| 1814 Warren St Maywood, IL | 3.0 | 1.0 | 1200 | $2,500 | $2.08 | 10d | 1 | 0.99mi |
| 218 S 13th Ave Unit 2 Maywood, IL | 2.0 | 1.0 | 1050 | $1,650 | $1.57 | 4d | 1 | 1.20mi |
| 723 Manchester Ave Westchester, IL | 3.0 | 2.0 | 1151 | $2,721 | $2.36 | 24d | 1 | 1.25mi |
| 624 Norfolk Ave Unit 1237891P Westchester, IL | 3.0 | 2.0 | 1646 | $12,991 | $7.89 | 20d | 1 | 1.35mi |
| 1056 Des Plaines Ave Forest Park, IL | 3.0 | 1.5 | 1450 | $2,295 | $1.58 | 7d | 1 | 1.44mi |
| 7753 Van Buren St #212 Forest Park, IL | 2.0 | 2.0 | 1289 | $2,800 | $2.17 | 10d | 1 | 1.47mi |
Listing history 11 events
-
2026-01-21status Pending
-
2026-01-07status Active
-
2025-12-29status Pending
-
2025-12-29$179,900 Active
-
2015-05-24historical
-
2015-05-18New
-
2015-04-30historical
-
2014-11-06price
-
2014-10-13New
-
2005-06-27soldstatus $206,000
-
2004-09-22soldstatus $122,000
ⓘ Source: listings_history table (triggers on properties + properties_extension) + one-shot
backfill from property_details.listing_events for pre-trigger history.
Tax reassessment forecast IL · Partial reset (capped growth)
- Current annual tax
- $8,617 · $718/mo
- Projected year-2 tax
- $8,617 · $718/mo
- Expected delta
- $0/yr ($0/mo · 0.0%)
ⓘ Screening estimate from a state-policy table — verify with the county assessor before closing.
Climate risk First Street
- Flood 1/10 Low FEMA zone X (unshaded) · 0% chance over 30 yrs
- Wildfire 1/10 Low
- Heat 3/10 Moderate 7 d/yr ≥100°F today · 14 d/yr by 30 yrs out
- Wind 2/10 Low 100% chance of damaging wind over 30 yrs
- Air quality 5/10 Major 6 unhealthy d/yr today · 8 by 30 yrs out
Nearby sold comps map
Loading sold comps map…
Walkable amenities ~0.75 mi
Loading nearby amenities…
Taxation est. · year 1
- Rental income
- $29,836
- − Mortgage interest
- −$10,077
- − Property taxes
- −$8,617
- − Insurance
- −$900
- − Repairs & maintenance
- −$2,387
- − Management
- −$2,387
- − Depreciation
- −$5,233
- Taxable income
- $236
- Est. tax owed @ 24.0%
- −$57
- After-tax cash flow
- $2,677/yr
For passive investors: Depreciation is non-cash, so a rental often shows a tax loss while cash-flowing — sheltering income. Rental losses are passive: they offset passive income freely, and up to $25,000/yr can offset ordinary (W-2) income if you actively participate and your MAGI is under $100k (phasing out to $0 by $150k); unused losses carry forward. On sale, claimed depreciation is recaptured at up to 25%, and gains may owe capital-gains tax (a 1031 exchange can defer both). Figures are a year-1 estimate at your 24.0% rate — not tax advice; consult a CPA.
Schools (NCES district)
- District
- Maywood-Melrose Park-Broadview 89
- NCES district ID
- 1725110
- Math proficiency
- 14% ▲ 1.00%
- Reading proficiency
- 21% ▲ 4.00%
- Median HH income
- $45,567
- Composite
- 18.75/100
- National rank
- #14003
- State rank
- #738 of 919 in IL
Livability — Maywood
- Score
- 78/100
- State rank
- #146
- US rank
- #2694
Category grades
Schools grade is shown separately in the Schools card above.
Census & demographics
- Census place
- Maywood, IL
- County
- Cook County · 4,486,803 people
- City population
- 23,201
- Metro
- Chicago-Naperville-Elgin, IL-IN-WI
- Population (ZIP)
- 23,201
- Household income
- $68,815
- Rent vs Own
- Severe rent burden
- 869.0
Population outlook (Cook County) Hauer SSP2
- Today (2025)
- 5,347,519 people
- By 2030
- 5,357,703 · +0.2%
- By 2040
- 5,324,924 · -0.4%
- By 2050
- 5,230,762 · -2.2%
- By 2075
- 4,785,735 · -10.5%
- By 2100
- 4,188,836 · -21.7%
Race, ethnicity, and origin ACS 2023
- Neighborhood character
- Diverse neighborhood (Simpson 0.56)
- Race & ethnicity
- Black 57% Hispanic / Latino 33% Two or more races 11% White 6%
- Hispanic origin (detail)
- Mexican 28% Puerto Rican 3%
- Common ancestry
- Romanian 1% British 1%
- Foreign-born
- 14% · Canada, Jamaica
- Languages at home
- 68% English-only · Spanish 30% French/Haitian/Cajun 2%
Political lean MEDSL · Cook
- 2024 margin
- Solid D (+42.0) · D 70.4% · R 28.4% · Other 1.2%
- 2008→2024 swing
- -11.4pp toward R · 2008: 53.4pp · 2024: 42.0pp
- All cycles
- 2024: D+42.0 2020: D+50.3 2016: D+53.0 2012: D+49.4 2008: D+53.4
Not yet ingested
- Civics
- —
Market trends
- HPI YoY
- ▼ -86.90%
- Current HPI
- 336.2159
- Rent YoY
- —
- Metro
- Chicago-Naperville-Elgin, IL-IN-WI
- State GDP YoY
- ▲ 1.59%
- F500 in state
- 60
Industry mix (Fortune 500 HQ in IL)
| Industry | F500 HQs | Revenue |
|---|---|---|
| Insurance | 4 | $201B |
|
||
| Consumer Goods | 4 | $87B |
|
||
| Industrial Machinery | 3 | $64B |
|
||
| Healthcare | 2 | $55B |
|
||
| Retail / Pharmacy | 1 | $148B |
|
||
| Agriculture / Food | 1 | $86B |
|
||
Price history
+47.5% since first listed11 events — show timeline
- 2026-01-21 Pending — MRED as Distributed by MLS Grid
- 2026-01-07 Relisted — MRED as Distributed by MLS Grid
- 2025-12-29 Pending — MRED as Distributed by MLS Grid
- 2025-12-29 Listed $179,900 MRED as Distributed by MLS Grid
- 2015-05-24 Listing Removed — MRED as Distributed by MLS Grid
- 2015-05-18 Listed — MRED as Distributed by MLS Grid
- 2015-04-30 Listing Removed — MRED as Distributed by MLS Grid
- 2014-11-06 Price Changed — MRED as Distributed by MLS Grid
- 2014-10-13 Listed — MRED as Distributed by MLS Grid
- 2005-06-27 Sold (Public Records) $206,000 Public Records
- 2004-09-22 Sold (Public Records) $122,000 Public Records
Property tax history
+4.5%/yrLatest (2023): $8,617 · -15.5% YoY. Source: county tax records.
Cash-flow waterfall
monthlySold comps — $/sqft
last 12 mo · ≤1 miLoading sold comps…