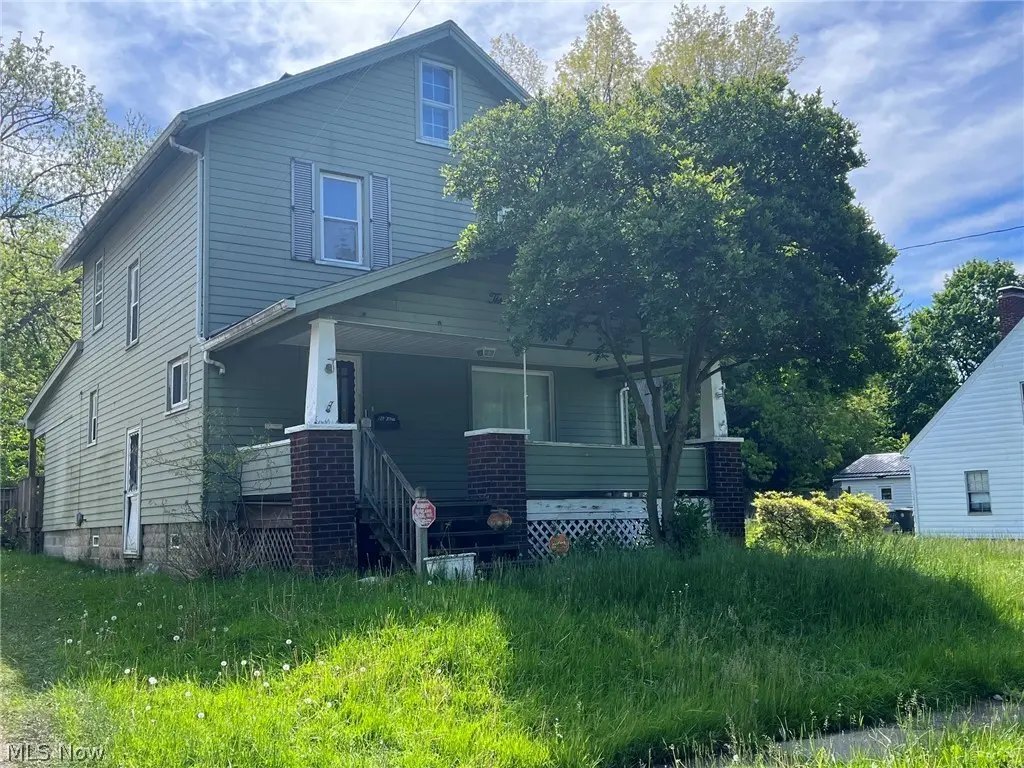
304 Lowell Ave NE · Warren, OH
Flood risk 1/10 · Minimal
- FEMA flood zone
- X (unshaded)
- Chance of flooding over 30 yrs
- 0.0%
- Est. flood insurance / yr
- $473 – $860
Fire risk 1/10 · Minimal
- Est. fire insurance / yr
- $713 – $1,323
Heat risk 3/10 · Minor
- Hot days now (above 97°F)
- 7 days/yr
- Hot days in 30 yrs
- 15 days/yr
Wind risk 1/10 · Minimal
- Chance of severe wind over 30 yrs
- —
Air-quality risk 3/10 · Minor
- Unhealthy air days now
- 1 days/yr
- Unhealthy air days in 30 yrs
- 4 days/yr
Risk factors via First Street. Map © Google.
Why this score? — see what drove the B+ grade
The composite is a weighted blend of 9 inputs, each scored 0–100. Each bar is that input's sub-score; the figure is the points it added to the 100-point composite (weight × sub-score).
- Cash flow +30.0/30.0
- ARV discount +15.0/15.0
- DSCR +10.0/10.0
- 1% rule +9.9/10.0
- Livability +3.7/5.0
- Rent growth +2.5/5.0
- Condition / age +2.5/5.0
- Schools +2.2/10.0
- Appreciation +0.0/10.0
$89,900
🖨 Deal sheet 📄 Offer letter ✓ Due diligence
Listing remarks MLS
Looking for a lot of living space for an amazing price??? This 3 bedroom home has 2 oversized living spaces, an eat in kitchen with new cupboards throughout and a full and half bath. There is a huge 2 car garage, a great wood deck and a beautiful front porch. At this price, this home won't last long!
Key facts
- Decorative staircase
- Finished attic
- Beamed ceilings
Tags
Property features AI
Exterior
- Parking: Detached 2-car garage; Driveway
- Utilities: Public water; Public sewer
- Home design: Two-story single-family home; Block foundation
- Construction: Asphalt construction details; Asphalt/fiberglass roof; Built according to public records (year built source)
- Exterior features: Deck; Porch; Backyard with fire pit; Exterior lighting; Back yard fencing; City lot
Interior
- Kitchen: Eat-in kitchen with patio doors and breakfast bar; Refrigerator; Dishwasher; Microwave
- Bedrooms: Master bedroom on second level with closet and natural wood floors; Second-level bedroom with 2 windows, closet, and natural wood floors; Second-level bedroom with one window, closet, and natural wood floors
- Flooring: Natural wood floors in bedrooms and living room; Laminate flooring in dining room and first-level half bath; Linoleum in family room
- Bathrooms: Full master bathroom on second level with tub/shower, double bowl sink, toilet and storage; Half bathroom on first level with mirror, toilet and sink
- Heating & cooling: Forced-air gas heating; Central air conditioning; Ceiling fans
- Interior features: Beamed ceilings; Built-in bookcases; Ceiling fans; Crown molding; Eat-in kitchen; Laminate countertops; Storage; Natural woodwork; Double-pane windows; Window treatments
- Laundry & utility: Laundry located in basement
Neighborhood map
What this means for you Summary
Snapshot
- This is a 3-bed/1.0-bath single-family listed at $90k.
Deal economics
- At list price, monthly cash flow is $485 ($6k/yr) — positive.
- The deal already cash-flows at list — no discount required.
- Meets the 1% rule at list price ($1k rent vs $90k).
- Recommended offer: $87k (3.0% below list) — sets the bar for market timing.
- Cap rate 12.8% vs local median 6.0% in Warren — top-decile yield for the area; either an underpriced asset or a hidden risk that comps aren't pricing in. Stress-test before assuming the spread holds.
Location & tenants
- Location reads 73/100 on livability (#312 in OH) — a middle-class / working-renter tenant base. Strengths: cost of living A+, health & safety A+, housing A; Watch: crime D-, commute F, employment F.
- Warren City (urban): math 22% / reading 32% proficiency, ranked #599 of 656 in OH (top 91%) — low school quality limits family demand, transient renter base, plan for 1-2y turnover; 75% free/reduced lunch — lower-income household profile, screen leases tightly.
- Market conditions: 107 active listings in the ZIP; 129 units permitted in Trumbull County in 2024 (0 in 5+ unit buildings).
- This rent runs 33% of the median local income ($49k/yr) — at the standard rent-burdened threshold; future hikes will face affordability resistance.
Forward outlook
- Local home prices are declining (-3.0%/yr); year-one equity from $622 of loan paydown is wiped out by about $3k of value loss. Plan a longer hold.
- Trumbull County population projected at -22% by 2050 — secular population decline; favor cash flow + early exit over multi-decade hold.
- At projected returns (-3.0% appreciation + 3.0% rent growth), your $25k cash investment doubles in ~6 years — after that, you're playing with house money.
Negotiation context
- It's been on market 35 days — a 3% lower offer ($87k) is reasonable based on typical stale-listing flexibility.
- 2 sale attempts since 6y ago with the ask held roughly flat each time — persistent listings suggest the price (not the market) is what's stuck; bring a comps-based counter.
- Current owner paid $36k; list at $90k implies a 150% gain — meaningful room to come down on a strong offer.
Risks & watch-outs
- Watch-outs: built in 1919 — expect roof / HVAC / electrical / plumbing capex.
Questions for the listing agent
- It's been on market 35 days. Have you received any prior offers? Is the seller open to a 3% concession, seller financing, or rate buy-down credit?
- Built in 1919 — when were the roof, HVAC, electrical panel, plumbing, and water heater last replaced?
- Is there a deadline driving the sale (1031 exchange, divorce, estate, relocation)? That informs how much negotiation room exists.
- Crime grade is D in this area — have there been break-ins, vandalism, or insurance claims at this property in the last 3 years? What carrier currently insures it and at what premium?
- What's the average days-on-market for RENTAL listings here right now (not sales)? A rising rental-DOM trend means longer vacancies and softer asking-rent achievability than the comps imply.
- What's the recent tenant-quality profile in this submarket — average credit score on applications, eviction rate, late-payment / NSF rate, and stable-employment percentage? A property-management company in the area should have these aggregated.
- How much new for-sale + rental construction is in the pipeline within 1–3 miles? Heavy new supply typically softens prices + rents 12–24 months out; constrained supply supports both.
Investment metrics
- 1% rule
- 1.49% ✓
- Cap rate
- 12.77%
- Cash-on-cash
- 23.12%
- DSCR
- 2.03
- GRM
- 5.6
CMA / ARV
- ARV (median comp)
- $116,505
- List price
- $89,900
- Delta
- -22.84%
- Verdict
- UNDERPRICED
- Comps
- 20 within 1.0 mi
Show comp detail 12 sales within ~0.75 mi
| Address | Dist | Beds/Ba | Sqft | Sold | Price | $/sf | Match |
|---|---|---|---|---|---|---|---|
| 146 Bonnie Brae Ave NE | 0.22mi | 4/2.0 (+1) | 1,850 (-9%) | 3mo | $155,000 | $84 | 64 |
| 451 Fairmount Ave NE | 0.23mi | 4/2.5 (+1) | 1,941 (-4%) | 10mo | $125,000 | $64 | 64 |
| 1528 Sunset | 0.29mi | 4/2.0 (+1) | 1,844 (-9%) | 4mo | $195,000 | $106 | 59 |
| 210 Fairmount Ave NE | 0.25mi | 4/2.0 (+1) | 1,768 (-13%) | 1mo | $170,000 | $96 | 58 |
| 199 Genesee Ave NE | 0.49mi | 3/2.0 | 1,920 (-5%) | 10mo | $166,000 | $86 | 56 |
| 165 Oak Knoll Ave NE | 0.44mi | 3/2.0 | 1,800 (-11%) | 3mo | $185,000 | $103 | 55 |
| 454 Washington St NE | 0.59mi | 3/1.0 | 1,830 (-10%) | 2mo | $65,000 | $36 | 55 |
| 246 Oak Knoll Ave SE | 0.56mi | 3/2.0 | 1,828 (-10%) | 8mo | $152,000 | $83 | 47 |
| 254 Genesee Ave NE | 0.51mi | 3/2.5 | 2,265 (+12%) | 12mo | $290,000 | $128 | 40 |
| 548 Adelaide Ave SE | 0.71mi | 4/1.5 (+1) | 1,786 (-12%) | 7mo | $62,500 | $35 | 34 |
| 1054 Genesee Ave NE | 0.74mi | 4/2.5 (+1) | 1,823 (-10%) | 5mo | $229,500 | $126 | 34 |
| 506 Oak Knoll Ave SE | 0.65mi | 4/2.0 (+1) | 1,753 (-13%) | 8mo | $202,500 | $116 | 32 |
Match score weights: distance 35% · size 25% · config 20% · recency 20%. Top-matched comps best support the ARV.
Projected returns pro-forma
-3.0% appreciation · 3.0% rent growth · sell at horizon
- IRR
- 16.1%
- Equity multiple
- 1.65×
- Total profit
- $16,310
- Equity at exit
- $13,404
- IRR
- 24.7%
- Equity multiple
- 3.14×
- Total profit
- $53,933
- Equity at exit
- $7,773
Cash invested: $25,172 (down + closing). Projections, not guarantees.
Landlord ↔ Tenant lean methodology
- Overall (STATE)
- 73 Landlord-Friendly
- State Ohio
- 73 Landlord-Friendly · R+6
- County
- — inherits STATE
- City
- — inherits STATE
ZIP-level market 44483
- Home prices YoY
- -16.3%
- Active inventory
- 107
- Price-to-rent
- 5.6×
Monthly cashflow live
- Estimated rent
- $1,338 medium interval (Pro) →
- Mortgage (P&I)
- −$471
- Tax from tax record
- −$63 /mo · $753/yr
- Insurance
- −$37
- HOA
- −$0
- Vacancy / Maint / Mgmt
- −$281
- Net cashflow
- $485
Break-even live
UW: 25.0% down · 7.5% · 30yr · 1.5% tax · 5.0% vac · 8.0% maint · 8.0% mgmt
Financing live
Cash to close
- Down payment
- $22,475
- Closing costs
- $2,697
- Reserves months
- —
- Total cash needed
- —
Loan-product check · same deal, 3 products live
Conventional
25% down · 7.5% · 30yr
- Down + closing
- —
- Monthly P&I
- —
- Monthly cashflow
- —
- DSCR
- —
- Eligible?
- —
Personal DTI + credit; lowest rate.
DSCR
20% down · 8.5% · 30yr
- Down + closing
- —
- Monthly P&I
- —
- Monthly cashflow
- —
- DSCR
- —
- Eligible?
- —
No personal income docs; deal must DSCR.
Hard money
10% down · 12.0% · 12mo
- Down + closing
- —
- Monthly P&I
- —
- Monthly cashflow
- —
- DSCR
- —
- Eligible?
- —
Short-term bridge; refi at stabilization.
Listing history 21 events
-
2026-06-19days on market $89,900 Active 35 DOM
-
2026-06-18days on market $89,900 Active 34 DOM
-
2026-06-17days on market $89,900 Active 33 DOM
-
2026-06-16days on market $89,900 Active 32 DOM
-
2026-06-15days on market $89,900 Active 31 DOM
-
2026-06-14days on market $89,900 Active 29 DOM
-
2026-06-13days on market $89,900 Active 28 DOM
-
2026-06-10days on market $89,900 Active 26 DOM
-
2026-06-09days on market $89,900 Active 25 DOM
-
2026-06-08days on market $89,900 Active 24 DOM
-
2026-06-07days on market $89,900 Active 23 DOM
-
2026-06-05days on market $89,900 Active 20 DOM
-
2026-06-02days on market $89,900 Active 18 DOM
-
2026-06-01days on market $89,900 Active 17 DOM
-
2026-05-31days on market $89,900 Active 16 DOM
-
2026-05-30days on market $89,900 Active 15 DOM
-
2026-05-15$89,900 Active 846-char remark
-
2020-11-24soldstatus $36,000
-
2020-11-23soldstatus $36,000 Closed 302-char remark
Show marketing remark (302 chars)
Looking for a lot of living space for an amazing price??? This 3 bedroom home has 2 oversized living spaces, an eat in kitchen with new cupboards throughout and a full and half bath. There is a huge 2 car garage, a great wood deck and a beautiful front porch. At this price, this home won't last long!
-
2020-10-29status Pending 302-char remark
Show marketing remark (302 chars)
Looking for a lot of living space for an amazing price??? This 3 bedroom home has 2 oversized living spaces, an eat in kitchen with new cupboards throughout and a full and half bath. There is a huge 2 car garage, a great wood deck and a beautiful front porch. At this price, this home won't last long!
-
2020-10-26$39,000 Active 302-char remark
Show marketing remark (302 chars)
Looking for a lot of living space for an amazing price??? This 3 bedroom home has 2 oversized living spaces, an eat in kitchen with new cupboards throughout and a full and half bath. There is a huge 2 car garage, a great wood deck and a beautiful front porch. At this price, this home won't last long!
ⓘ Source: listings_history table (triggers on properties + properties_extension) + one-shot
backfill from property_details.listing_events for pre-trigger history.
Tax reassessment forecast OH · Partial reset (capped growth)
- Current annual tax
- $753 · $63/mo
- Projected year-2 tax
- $1,078 · $90/mo
- Expected delta
- +$324/yr (+$27/mo · 43.1%)
ⓘ Screening estimate from a state-policy table — verify with the county assessor before closing.
Climate risk First Street
- Flood 1/10 Low FEMA zone X (unshaded) · 0% chance over 30 yrs
- Wildfire 1/10 Low
- Heat 3/10 Moderate 7 d/yr ≥97°F today · 15 d/yr by 30 yrs out
- Wind 1/10 Low
- Air quality 3/10 Moderate 1 unhealthy d/yr today · 4 by 30 yrs out
Nearby sold comps map
Loading sold comps map…
Walkable amenities ~0.75 mi
Loading nearby amenities…
Taxation est. · year 1
- Rental income
- $16,050
- − Mortgage interest
- −$5,036
- − Property taxes
- −$753
- − Insurance
- −$450
- − Repairs & maintenance
- −$1,284
- − Management
- −$1,284
- − Depreciation
- −$2,615
- Taxable income
- $4,628
- Est. tax owed @ 24.0%
- −$1,111
- After-tax cash flow
- $4,709/yr
For passive investors: Depreciation is non-cash, so a rental often shows a tax loss while cash-flowing — sheltering income. Rental losses are passive: they offset passive income freely, and up to $25,000/yr can offset ordinary (W-2) income if you actively participate and your MAGI is under $100k (phasing out to $0 by $150k); unused losses carry forward. On sale, claimed depreciation is recaptured at up to 25%, and gains may owe capital-gains tax (a 1031 exchange can defer both). Figures are a year-1 estimate at your 24.0% rate — not tax advice; consult a CPA.
Schools (NCES district)
- District
- Warren City
- NCES district ID
- 3904499
- Math proficiency
- 22% ▼ -16.00%
- Reading proficiency
- 32% ▼ -9.00%
- Median HH income
- $28,222
- Composite
- 21.6/100
- National rank
- #8299
- State rank
- #599 of 656 in OH
Livability — Warren
- Score
- 73/100
- State rank
- #312
- US rank
- #5068
Category grades
Schools grade is shown separately in the Schools card above.
Census & demographics
- Census place
- Warren, OH
- County
- Trumbull County · 61,158 people
- City population
- 25,805
- Metro
- Youngstown-Warren-Boardman, OH-PA
- Population (ZIP)
- 25,805
- Household income
- $49,017
- Rent vs Own
- Severe rent burden
- 989.0
Population outlook (Trumbull County) Hauer SSP2
- Today (2025)
- 191,696 people
- By 2030
- 184,015 · -4.0%
- By 2040
- 166,810 · -13.0%
- By 2050
- 149,857 · -21.8%
- By 2075
- 115,769 · -39.6%
- By 2100
- 83,617 · -56.4%
Race, ethnicity, and origin ACS 2023
- Neighborhood character
- Predominantly White (77%)
- Race & ethnicity
- White 77% Black 14% Two or more races 7% Hispanic / Latino 4%
- Common ancestry
- Romanian 3% Slovak 2% Italian 1%
- Foreign-born
- 2% · Canada
- Languages at home
- 96% English-only · Other Indo-European 2% Spanish 2%
Political lean MEDSL · Trumbull
- 2024 margin
- R (+16.8) · D 41.2% · R 58.0%
- 2008→2024 swing
- -39.2pp toward R · 2008: 22.4pp · 2024: -16.8pp
- All cycles
- 2024: R+16.8 2020: R+10.6 2016: R+6.4 2012: D+22.2 2008: D+22.4
Not yet ingested
- Civics
- —
Market trends
- HPI YoY
- ▼ -42.50%
- Current HPI
- 218.3455
- Rent YoY
- —
- Metro
- Youngstown-Warren-Boardman, OH-PA
- State GDP YoY
- ▲ 1.98%
- F500 in state
- 48
Industry mix (Fortune 500 HQ in OH)
| Industry | F500 HQs | Revenue |
|---|---|---|
| Insurance | 3 | $145B |
|
||
| Industrial Machinery | 3 | $49B |
|
||
| Financial Services | 3 | $24B |
|
||
| Consumer Goods | 2 | $93B |
|
||
| Aerospace / Defense | 2 | $47B |
|
||
| Utilities | 2 | $33B |
|
||
Price history
+130.5% since first listed5 events — show timeline
- 2026-05-15 Listed $89,900 MLSNOW
- 2020-11-24 Sold (Public Records) $36,000 Public Records
- 2020-11-23 Sold (MLS) $36,000 MLSNOW
- 2020-10-29 Pending — MLSNOW
- 2020-10-26 Listed $39,000 MLSNOW
Property tax history
+4.5%/yrLatest (2025): $753 · +1.9% YoY. Source: county tax records.
Cash-flow waterfall
monthlySold comps — $/sqft
last 12 mo · ≤1 miLoading sold comps…