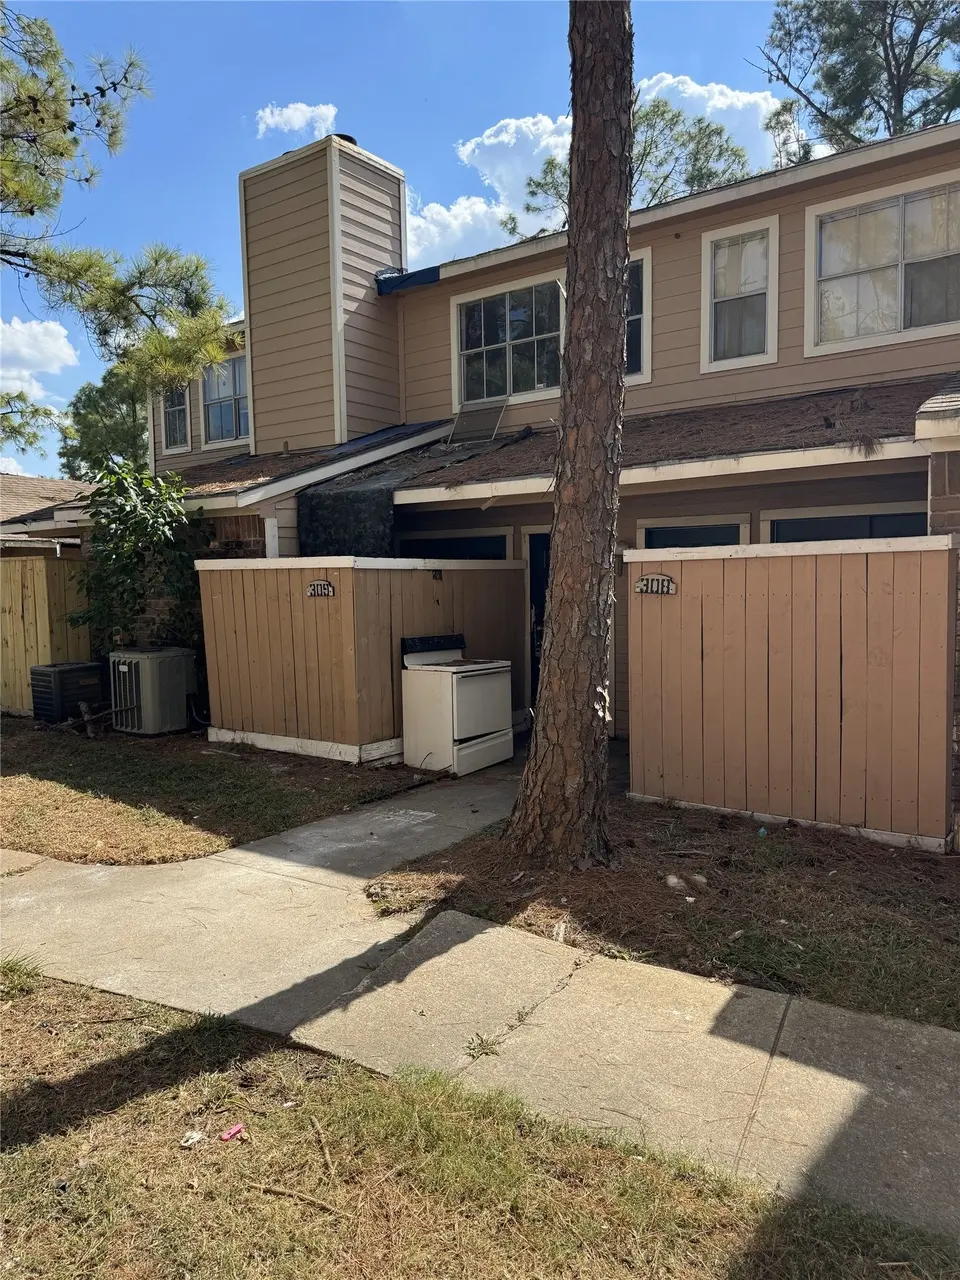
7402 Alabonson Rd #309 · Houston, TX
Flood risk 4/10 · Minor
- FEMA flood zone
- X (shaded)
- Chance of flooding over 30 yrs
- 0.21%
- Est. flood insurance / yr
- $507 – $1,088
Fire risk 1/10 · Minimal
- Est. fire insurance / yr
- $1,222 – $2,270
Heat risk 9/10 · Severe
- Hot days now (above 109°F)
- 7 days/yr
- Hot days in 30 yrs
- 24 days/yr
Wind risk 8/10 · Major
- Chance of severe wind over 30 yrs
- 99.0%
Air-quality risk 3/10 · Minor
- Unhealthy air days now
- 3 days/yr
- Unhealthy air days in 30 yrs
- 4 days/yr
Risk factors via First Street. Map © Google.
Why this score? — see what drove the C+ grade
The composite is a weighted blend of 9 inputs, each scored 0–100. Each bar is that input's sub-score; the figure is the points it added to the 100-point composite (weight × sub-score).
- Cash flow +21.9/30.0
- ARV discount +15.0/15.0
- 1% rule +10.0/10.0
- DSCR +7.0/10.0
- Livability +3.7/5.0
- Condition / age +2.5/5.0
- Rent growth +2.2/5.0
- Schools +1.5/10.0
- Appreciation +0.0/10.0
$52,900
🖨 Deal sheet (PDF) 📄 Offer letter ✓ Due diligence
Listing remarks
Welcome to your dream home! This fully remodeled property has been beautifully updated inside and out, including brand-new vinyl floor throughout and appliances including brand-new refrigerator. The modern kitchen features stunning granite countertops, brand-new cabinets and appliances. Enjoy the spacious living room, which includes a fireplace perfect for relaxing evenings. Upstairs, you'll find generously sized bedroom with modern vanity and sink in its bathroom. Low property tax and highly motivated seller!
Key facts
- Brand-new cabinets
- Remodeled property
- Modern kitchen
Tags
Property features AI
Finance
- Other: Seller disclosure available
- HOA & community: Managed by Castlerock Property Management; Monthly association fee of $242; HOA covers common areas and maintenance of grounds and structure; Gated community amenity
Exterior
- Parking: Controlled access
- Security: Controlled access
- Utilities: Public water; Public sewer
- Home design: Residential property; 2 stories; Entry level spans first and second levels
- Construction: Built in 1984; Brick and wood siding exterior; Composition roof; Slab foundation
- Exterior features: Gated community; Asphalt and concrete road surfaces
Interior
- Kitchen: Electric oven and electric range; Dishwasher; Disposal; Microwave; Refrigerator
- Bedrooms: Primary bedroom on second level; Living room on first level; Total of 2 rooms
- Flooring: Vinyl flooring
- Bathrooms: 1 full bathroom; 1 half bathroom
- Heating & cooling: Central heating (electric); Central air conditioning (electric)
- Interior features: Wood-burning fireplace (1); Primary bedroom with private bath; Tub and shower
- Laundry & utility: Washer and dryer included; Electric dryer hookup
Neighborhood map
What this means for you Summary
Snapshot
- This is a 1-bed/1.5-bath townhouse listed at $53k.
Deal economics
- At list price, monthly cash flow is $84 ($1k/yr) — positive.
- The deal already cash-flows at list — no discount required.
- Meets the 1% rule at list price ($974 rent vs $53k).
- Recommended offer: $52k (1.5% below list) — sets the bar for market timing.
- Cap rate 8.2% vs local median 3.2% in Houston — top-decile yield for the area; either an underpriced asset or a hidden risk that comps aren't pricing in. Stress-test before assuming the spread holds.
Location & tenants
- Location reads 74/100 on livability (#184 in TX, #4,771 nationally) — a middle-class / working-renter tenant base. Strengths: amenities A+, cost of living A+, housing A+; Watch: crime F.
- Aldine ISD (suburban): math 16% / reading 21% proficiency, ranked #790 of 826 in TX (top 96%) — low school quality limits family demand, transient renter base, plan for 1-2y turnover; 79% free/reduced lunch — lower-income household profile, screen leases tightly.
- Zoned schools: Smith El (math 7% / reading 10%, grade F, #4,298 of 4,322 statewide, top 99%, 555 students, 94% FRL); Hoffman Middle (math 17% / reading 24%, grade F, #1,407 of 1,662 statewide, top 86%, 637 students, 91% FRL); Eisenhower H S (math 16% / reading 23%, grade F, #1,424 of 1,632 statewide, top 88%, 2,855 students, 83% FRL).
- Market conditions: Rents soft (-1.0%/yr); 471 active listings in the ZIP; 8 comparable units currently listed for rent nearby; rentals lingering (median 45d on market — plan ~5-8 weeks vacancy on turnover, expect pricing pressure); 50% of comp listings sitting > 30 days — soft ceiling on asking rent; 29,883 units permitted in Harris County in 2024 (8,621 in 5+ unit buildings).
Forward outlook
- Local home prices are declining (-3.0%/yr); year-one equity from $366 of loan paydown is wiped out by about $2k of value loss. Plan a longer hold.
- Harris County population projected at +47% by 2050 — long-run rental-demand tailwind backs the buy-and-hold thesis.
Negotiation context
- It's been on market 15 days — a 2% lower offer ($52k) is reasonable based on typical stale-listing flexibility.
- 10 sale attempts since 2y ago with the ask held roughly flat each time — persistent listings suggest the price (not the market) is what's stuck; bring a comps-based counter.
- Current owner paid $16k; list at $53k implies a 231% gain — meaningful room to come down on a strong offer.
Risks & watch-outs
- Watch-outs: property tax is 3.3% of price; HOA is 25% of rent.
- Climate carrying-cost: severe wind risk, 99% chance of damaging wind over 30y; extreme-heat days projected 7→24/yr by 2055 (HVAC capex compounding) — expect insurance premiums to compound above CPI over the hold.
Questions for the listing agent
- Property tax is high relative to price — has the assessment been appealed recently, and will the sale trigger a re-assessment?
- What does the HOA fee cover, when was the last increase, and are there any pending special assessments or reserve-fund shortfalls?
- Is there a deadline driving the sale (1031 exchange, divorce, estate, relocation)? That informs how much negotiation room exists.
- Schools are D-rated, which usually means shorter tenancies and higher turnover. Who's the typical renter profile here, and what's been the actual vacancy rate?
- Crime grade is F in this area — have there been break-ins, vandalism, or insurance claims at this property in the last 3 years? What carrier currently insures it and at what premium?
- What's the average days-on-market for RENTAL listings here right now (not sales)? A rising rental-DOM trend means longer vacancies and softer asking-rent achievability than the comps imply.
- What's the recent tenant-quality profile in this submarket — average credit score on applications, eviction rate, late-payment / NSF rate, and stable-employment percentage? A property-management company in the area should have these aggregated.
- How much new for-sale + rental construction is in the pipeline within 1–3 miles? Heavy new supply typically softens prices + rents 12–24 months out; constrained supply supports both.
Investment metrics
- 1% rule
- 1.84% ✓
- Cap rate
- 8.19%
- Cash-on-cash
- 6.77%
- DSCR
- 1.30
- GRM
- 4.5
CMA / ARV
- ARV (median comp)
- $65,333
- List price
- $52,900
- Delta
- -15.97%
- Verdict
- UNDERPRICED
- Comps
- 13 within 1.0 mi
Show comp detail 5 sales within ~0.75 mi
| Address | Dist | Beds/Ba | Sqft | Sold | Price | $/sf | Match |
|---|---|---|---|---|---|---|---|
| 7402 Alabonson Rd #301 | 0.00mi | 1/1.5 | 690 (0%) | 4mo | $48,000 | $70 | 97 |
| 7402 Alabonson Rd #401 | 0.00mi | 1/1.0 | 663 (-4%) | 13mo | $49,999 | $75 | 81 |
| 7402 Alabonson Rd #206 | 0.00mi | 1/1.0 | 663 (-4%) | 18mo | $69,900 | $105 | 76 |
| 7402 Alabonson Rd #510 | 0.00mi | 1/1.0 | 663 (-4%) | 22mo | $76,000 | $115 | 73 |
| 7402 Alabonson Rd #203 | 0.00mi | 1/1.0 | 663 (-4%) | 23mo | $65,000 | $98 | 72 |
Match score weights: distance 35% · size 25% · config 20% · recency 20%. Top-matched comps best support the ARV.
Projected returns pro-forma
-3.0% appreciation · 0.0% rent growth · sell at horizon
- IRR
- -11.5%
- Equity multiple
- 0.60×
- Total profit
- $-5,893
- Equity at exit
- $7,888
- IRR
- -12.8%
- Equity multiple
- 0.43×
- Total profit
- $-8,451
- Equity at exit
- $4,574
Cash invested: $14,812 (down + closing). Projections, not guarantees.
Landlord ↔ Tenant lean methodology
- Overall (STATE)
- 87 Strongly Landlord-Friendly
- State Texas
- 87 Strongly Landlord-Friendly · R+5
- County
- — inherits STATE
- City
- — inherits STATE
ZIP-level market 77088
- Home prices YoY
- -23.2%
- Rents YoY
- -1.0%
- Active inventory
- 471
- Price-to-rent
- 4.5×
Monthly cashflow live
- Estimated rent
- $974 high interval (Pro) →
- Mortgage (P&I)
- −$277
- Tax from tax record
- −$145 /mo · $1,734/yr
- Insurance
- −$22
- HOA
- −$242
- Vacancy / Maint / Mgmt
- −$205
- Net cashflow
- $84
Break-even live
Sensitivity live
| Price | -10% $114 | -5% $99 | +0% $84 | +5% $69 | +10% $54 |
|---|---|---|---|---|---|
| Rent | -10% $7 | -5% $45 | +0% $84 | +5% $122 | +10% $161 |
| Rate | -1.0pp $110 | -0.5pp $97 | base $84 | +0.5pp $70 | +1.0pp $56 |
UW: 25.0% down · 7.5% · 30yr · 1.5% tax · 5.0% vac · 8.0% maint · 8.0% mgmt
Financing live
Cash to close
- Down payment
- $13,225
- Closing costs
- $1,587
- Reserves months
- —
- Total cash needed
- —
Loan-product check · same deal, 3 products live
Conventional
25% down · 7.5% · 30yr
- Down + closing
- —
- Monthly P&I
- —
- Monthly cashflow
- —
- DSCR
- —
- Eligible?
- —
Personal DTI + credit; lowest rate.
DSCR
20% down · 8.5% · 30yr
- Down + closing
- —
- Monthly P&I
- —
- Monthly cashflow
- —
- DSCR
- —
- Eligible?
- —
No personal income docs; deal must DSCR.
Hard money
10% down · 12.0% · 12mo
- Down + closing
- —
- Monthly P&I
- —
- Monthly cashflow
- —
- DSCR
- —
- Eligible?
- —
Short-term bridge; refi at stabilization.
Rent comps 8 comps
| Address | Beds | Baths | Sqft | Rent | $/sqft | DOM | Units | Dist |
|---|---|---|---|---|---|---|---|---|
| 7352 Alabonson Rd Houston, TX | 1.0 | 1.0 | 664 | $800 | $1.20 | 45d | 1 | 0.07mi |
| 7302 Alabonson Rd Houston, TX | 1.0–2.0 | 1.0–2.0 | 823 | $650 | $0.79 | 22d | 49 | 0.12mi |
| 5856 W Gulf Bank Rd Houston, TX | 1.0 | 1.0 | 692 | $745 | $1.08 | 45d | 1 | 0.59mi |
| 7058 W Gulf Bank Rd Houston, TX | 2.0 | 2.0–2.5 | 870 | $1,364 | $1.57 | 4d | 3 | 0.82mi |
| 5306 W Gulf Bank Rd Unit 1204 Houston, TX | 1.0 | 1.0 | 611 | $805 | $1.32 | 45d | 1 | 1.10mi |
| 5306 W Gulf Bank Rd Unit 1204 Houston, TX | 1.0 | 1.0 | 611 | $805 | $1.32 | 23d | 1 | 1.10mi |
| 5300 W Gulf Bank Rd Houston, TX | 1.0–2.0 | 1.0–2.0 | 762 | $695 | $0.91 | 23d | 1 | 1.19mi |
| 5300 W Gulf Bank Rd Houston, TX | 1.0–2.0 | 1.0–2.0 | 762 | $795 | $1.04 | 45d | 1 | 1.19mi |
HOA detail
- Monthly dues
- $242 · $2,904/yr
Listing history 41 events
-
2026-06-21days on market $52,900 Active 15 DOM
-
2026-06-18days on market $52,900 Active 12 DOM
-
2026-06-17days on market $52,900 Active 11 DOM
-
2026-06-16days on market $52,900 Active 10 DOM
-
2026-06-15price $52,900 Active 9 DOM
-
2026-06-15days on market $54,900 Active 9 DOM
-
2026-06-13days on market $54,900 Active 7 DOM
-
2026-06-13days on market $54,900 Active 6 DOM
-
2026-06-09days on market $54,900 Active 3 DOM
-
2026-06-08days on market $54,900 Active 2 DOM
-
2026-06-07remarks 515-char remark
-
2026-06-07days on market $54,900 Active 1 DOM
-
2026-05-31days on market $54,900 Active 153 DOM
-
2026-01-01$950
-
2025-12-29historical
-
2025-12-29$54,900 Active 469-char remark
-
2025-12-27price $54,900
-
2025-10-23price $57,900
-
2025-09-10price $59,900
-
2025-08-17$62,900 Active
-
2025-07-31historical
-
2025-07-02price $64,900
-
2025-06-20price $67,900
-
2025-04-15$68,900 Active
-
2025-04-15historical
-
2025-03-09historical $975
-
2025-02-04$69,900 Active
-
2025-02-04historical
-
2025-01-03price $71,900
-
2024-12-05$72,900 Active
-
2024-12-05historical
-
2024-12-04historical $975
-
2024-12-04$975
-
2024-11-22price $72,900
-
2024-10-13$74,900 Active
-
2024-10-02$1,050
-
2024-08-23soldstatus
-
2005-11-07soldstatus
-
2004-01-16soldstatus
-
2000-06-07soldstatus
-
1993-01-01soldstatus $16,000
ⓘ Source: listings_history table (triggers on properties + properties_extension) + one-shot
backfill from property_details.listing_events for pre-trigger history.
Tax reassessment forecast TX · Resets to sale price
- Current annual tax
- $1,734 · $145/mo
- Projected year-2 tax
- $1,734 · $145/mo
- Expected delta
- $0/yr ($0/mo · 0.0%)
ⓘ Screening estimate from a state-policy table — verify with the county assessor before closing.
Climate risk First Street
- Flood 4/10 Moderate FEMA zone X (shaded) · 21% chance over 30 yrs
- Wildfire 1/10 Low
- Heat 9/10 Extreme 7 d/yr ≥109°F today · 24 d/yr by 30 yrs out
- Wind 8/10 Severe 99% chance of damaging wind over 30 yrs
- Air quality 3/10 Moderate 3 unhealthy d/yr today · 4 by 30 yrs out
Nearby sold comps map
Loading sold comps map…
Walkable amenities ~0.75 mi
Loading nearby amenities…
Taxation est. · year 1
- Rental income
- $11,689
- − Mortgage interest
- −$2,963
- − Property taxes
- −$1,734
- − Insurance
- −$264
- − Repairs & maintenance
- −$935
- − Management
- −$935
- − HOA
- −$2,904
- − Depreciation
- −$1,539
- Taxable income
- $414
- Est. tax owed @ 24.0%
- −$99
- After-tax cash flow
- $903/yr
For passive investors: Depreciation is non-cash, so a rental often shows a tax loss while cash-flowing — sheltering income. Rental losses are passive: they offset passive income freely, and up to $25,000/yr can offset ordinary (W-2) income if you actively participate and your MAGI is under $100k (phasing out to $0 by $150k); unused losses carry forward. On sale, claimed depreciation is recaptured at up to 25%, and gains may owe capital-gains tax (a 1031 exchange can defer both). Figures are a year-1 estimate at your 24.0% rate — not tax advice; consult a CPA.
Schools (NCES district)
- District
- Aldine ISD
- NCES district ID
- 4807710
- Math proficiency
- 16% ▼ -23.00%
- Reading proficiency
- 21% ▼ -11.00%
- Median HH income
- $37,081
- Composite
- 15.42/100
- National rank
- #9317
- State rank
- #790 of 826 in TX
Livability — Houston
- Score
- 74/100
- State rank
- #184
- US rank
- #4771
Category grades
Schools grade is shown separately in the Schools card above.
Census & demographics
- County
- Harris County · 4,702,590 people
- City population
- 3,226,434
- Metro
- Houston-The Woodlands-Sugar Land, TX
- Population (ZIP)
- 57,047
- Household income
- $54,411
- Rent vs Own
- Severe rent burden
- 2294.0
Population outlook (Harris County) Hauer SSP2
- Today (2025)
- 5,571,493 people
- By 2030
- 6,089,821 · +9.3%
- By 2040
- 7,142,806 · +28.2%
- By 2050
- 8,185,864 · +46.9%
- By 2075
- 10,574,329 · +89.8%
- By 2100
- 12,109,958 · +117.4%
Race, ethnicity, and origin ACS 2023
- Neighborhood character
- Diverse neighborhood (Simpson 0.59)
- Race & ethnicity
- Hispanic / Latino 52% Black 37% Two or more races 18% White 6% Asian 4%
- Hispanic origin (detail)
- Mexican 36%
- Common ancestry
- Lithuanian 1%
- Foreign-born
- 25% · Canada, Vietnam, China
- Languages at home
- 49% English-only · Spanish 47% Vietnamese 3%
Political lean MEDSL · Harris
- 2024 margin
- Lean D (+5.5) · D 52.0% · R 46.4% · Other 1.6%
- 2008→2024 swing
- +3.9pp toward D · 2008: 1.6pp · 2024: 5.5pp
- All cycles
- 2024: D+5.5 2020: D+13.3 2016: D+12.4 2012: D+0.1 2008: D+1.6
Not yet ingested
- Civics
- —
Market trends
- HPI YoY
- ▼ -98.37%
- Current HPI
- 325.0499
- Rent YoY
- ▼ -1.01%
- Metro
- Houston-The Woodlands-Sugar Land, TX
- State GDP YoY
- ▲ 3.95%
- F500 in state
- 110
Industry mix (Fortune 500 HQ in TX)
| Industry | F500 HQs | Revenue |
|---|---|---|
| Energy | 16 | $1,198B |
|
||
| Technology | 5 | $198B |
|
||
| Engineering / Construction | 4 | $72B |
|
||
| Energy Services | 3 | $60B |
|
||
| Utilities | 3 | $41B |
|
||
| Healthcare | 2 | $330B |
|
||
Price history
+230.6% since first listed32 events — show timeline
- 2026-06-15 Price Changed $52,900 HARMLS
- 2026-06-06 Listed $54,900 HARMLS
- 2026-06-01 Rental Removed $950 HARMLS
- 2026-05-31 Listing Removed — HARMLS
- 2026-01-01 Listed for Rent $950 HARMLS
- 2025-12-29 Listing Removed — HARMLS
- 2025-12-29 Listed $54,900 HARMLS
- 2025-12-27 Price Changed $54,900 HARMLS
- 2025-10-23 Price Changed $57,900 HARMLS
- 2025-09-10 Price Changed $59,900 HARMLS
- 2025-08-17 Listed $62,900 HARMLS
- 2025-07-31 Listing Removed — HARMLS
- 2025-07-02 Price Changed $64,900 HARMLS
- 2025-06-20 Price Changed $67,900 HARMLS
- 2025-04-15 Listing Removed — HARMLS
- 2025-04-15 Listed $68,900 HARMLS
- 2025-03-09 Rental Removed $975 HARMLS
- 2025-02-04 Listing Removed — HARMLS
- 2025-02-04 Listed $69,900 HARMLS
- 2025-01-03 Price Changed $71,900 HARMLS
- 2024-12-05 Listing Removed — HARMLS
- 2024-12-05 Listed $72,900 HARMLS
- 2024-12-04 Rental Removed $975 HARMLS
- 2024-12-04 Listed for Rent $975 HARMLS
- 2024-11-22 Price Changed $72,900 HARMLS
- 2024-10-13 Listed $74,900 HARMLS
- 2024-10-02 Listed for Rent $1,050 HARMLS
- 2024-08-23 Sold (Public Records) — Public Records
- 2005-11-07 Sold (Public Records) — Public Records
- 2004-01-16 Sold (Public Records) — Public Records
- 2000-06-07 Sold (Public Records) — Public Records
- 1993-01-01 Sold (Public Records) $16,000 Public Records
Property tax history
+11.6%/yrLatest (2025): $1,734 · +9.7% YoY. Source: county tax records.
Cash-flow waterfall
monthlySold comps — $/sqft
last 12 mo · ≤1 miLoading sold comps…