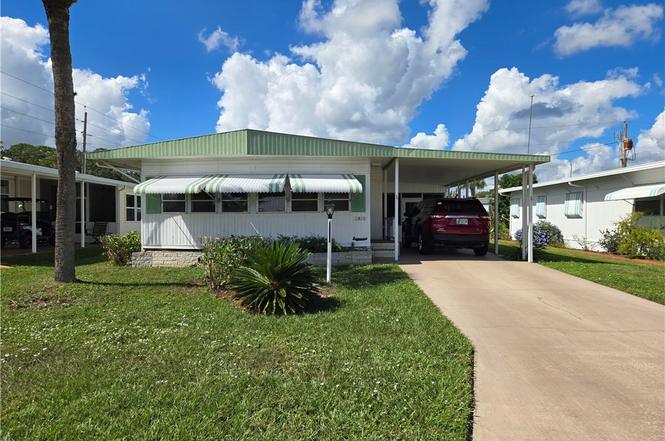
3035 Roger St · Sebring, FL
Flood risk 4/10 · Minor
- FEMA flood zone
- X (unshaded)
- Chance of flooding over 30 yrs
- 0.22%
- Est. flood insurance / yr
- $507 – $1,088
Fire risk 5/10 · Moderate
- Est. fire insurance / yr
- $947 – $1,759
Heat risk 8/10 · Major
- Hot days now (above 108°F)
- 7 days/yr
- Hot days in 30 yrs
- 25 days/yr
Wind risk 9/10 · Severe
- Chance of severe wind over 30 yrs
- 99.0%
Air-quality risk 2/10 · Minimal
- Unhealthy air days now
- 2 days/yr
- Unhealthy air days in 30 yrs
- 2 days/yr
Risk factors via First Street. Map © Google.
Why this score? — see what drove the B- grade
The composite is a weighted blend of 9 inputs, each scored 0–100. Each bar is that input's sub-score; the figure is the points it added to the 100-point composite (weight × sub-score).
- Cash flow +30.0/30.0
- 1% rule +10.0/10.0
- DSCR +10.0/10.0
- ARV discount +7.5/15.0
- Schools +3.6/10.0
- Livability +3.3/5.0
- Rent growth +2.9/5.0
- Condition / age +2.5/5.0
- Appreciation +0.0/10.0
$38,000
🖨 Deal sheet (PDF) 📄 Offer letter ✓ Due diligence
Listing remarks
Home in popular Hammock Mobile Estates retirement community located close to shopping, restaurants, hospitals and downtown Sebring. This spacious double wide home has a family room plus screened porch giving ample room to entertain or just playing cards. Lower lot rent at just $475 makes this an affordable winter home or your retirement home. Park amenities include entertainment nights, holiday dinners at the clubhouse, coffee hours, bingo and shuffleboard plus planned trips to local shows. Maybe you just want to relax in the heated pool or go golfing, its your choice. This community is close to walking trails, great fishing in numerous freshwater lakes and golf courses.
Key facts
- Freshwater lakes
- Lower lot rent
- Screened porch
Tags
Property features AI
Finance
- Other: Located in a mobile home park (Hammock Mobile Estates); Roads are paved; Zoning: M2; Accessibility: grip-accessible features
- HOA & community: Senior community; Clubhouse; Land lease: $475/month
Exterior
- Parking: Carport (2 spaces)
- Utilities: Public water; Public sewer; Sewer available; Other sewer connection
- Home design: Manufactured in park (mobile home); Double wide; One level
- Construction: Frame construction; Metal roof
- Exterior features: Awnings; Enclosed patio/porch; Front porch; Screened porch; Side porch; Shed(s); Workshop; Community pool; No private pool
Interior
- Kitchen: Dishwasher; Microwave; Oven; Range; Refrigerator
- Flooring: Carpet; Laminate; Simulated wood
- Bathrooms: 2 full bathrooms
- Heating & cooling: Central heating (electric); Central air conditioning (electric)
- Interior features: Ceiling fans; High-speed internet; Blinds; Furnished
- Laundry & utility: Washer; Dryer
Neighborhood map
What this means for you Summary
Snapshot
- This is a 2-bed/2.0-bath manufactured listed at $38k.
Deal economics
- At list price, monthly cash flow is $720 ($9k/yr) — positive.
- The deal already cash-flows at list — no discount required.
- Meets the 1% rule at list price ($1k rent vs $38k).
- Recommended offer: $33k (12.0% below list) — sets the bar for market timing.
- Cap rate 29.0% vs local median 4.3% in Sebring — top-decile yield for the area; either an underpriced asset or a hidden risk that comps aren't pricing in. Stress-test before assuming the spread holds.
Location & tenants
- Location reads 66/100 on livability (#618 in FL) — a middle-class / working-renter tenant base. Strengths: cost of living A+, housing A+, health & safety A; Watch: amenities F, commute F, employment F.
- Highlands (other): math 45% / reading 43% proficiency, ranked #54 of 73 in FL (top 74%) — families likely to look elsewhere, expect single-tenant / working-renter base with shorter leases; 68% free/reduced lunch — lower-income household profile, screen leases tightly.
- Zoned schools: Sebring Middle School (math 52% / reading 40%, grade D+, #300 of 571 statewide, top 53%, 815 students, 64% FRL); Sebring High School (math 32% / reading 48%, grade F, #296 of 667 statewide, top 45%, 1,809 students, 56% FRL).
- Market conditions: Rents rising (+1.6%/yr); 707 active listings in the ZIP; 1 comparable units currently listed for rent nearby; 980 units permitted in Highlands County in 2024 (80 in 5+ unit buildings).
Forward outlook
- Local home prices are declining (-3.0%/yr); year-one equity from $263 of loan paydown is wiped out by about $1k of value loss. Plan a longer hold.
- At projected returns (-3.0% appreciation + 1.6% rent growth), your $11k cash investment doubles in ~2 years — after that, you're playing with house money.
Negotiation context
- It's been on market 209 days — a 12% lower offer ($33k) is reasonable based on typical stale-listing flexibility.
- 2 sale attempts; this cycle's ask has dropped $22k (37%) from the opening price — seller is motivated, your offer sets the floor, not the list.
Risks & watch-outs
- Climate carrying-cost: severe wind risk, 99% chance of damaging wind over 30y; moderate wildfire risk; extreme-heat days projected 7→25/yr by 2055 (HVAC capex compounding) — expect insurance premiums to compound above CPI over the hold.
Questions for the listing agent
- It's been on market 209 days. Have you received any prior offers? Is the seller open to a 12% concession, seller financing, or rate buy-down credit?
- Built in 1978 — when were the roof, HVAC, electrical panel, plumbing, and water heater last replaced?
- Why hasn't it sold? Are there any deal-killer items the seller is aware of (foundation, flood, title, zoning, code violations)?
- Is there a deadline driving the sale (1031 exchange, divorce, estate, relocation)? That informs how much negotiation room exists.
- Schools are D-rated, which usually means shorter tenancies and higher turnover. Who's the typical renter profile here, and what's been the actual vacancy rate?
- What's the average days-on-market for RENTAL listings here right now (not sales)? A rising rental-DOM trend means longer vacancies and softer asking-rent achievability than the comps imply.
- What's the recent tenant-quality profile in this submarket — average credit score on applications, eviction rate, late-payment / NSF rate, and stable-employment percentage? A property-management company in the area should have these aggregated.
- How much new for-sale + rental construction is in the pipeline within 1–3 miles? Heavy new supply typically softens prices + rents 12–24 months out; constrained supply supports both.
Investment metrics
- 1% rule
- 3.28% ✓
- Cap rate
- 29.04%
- Cash-on-cash
- 81.23%
- DSCR
- 4.61
- GRM
- 2.5
CMA / ARV
- ARV (on-the-fly)
- $147,840
- Comps found
- 12
Show comp detail 12 sales within ~0.75 mi
| Address | Dist | Beds/Ba | Sqft | Sold | Price | $/sf | Match |
|---|---|---|---|---|---|---|---|
| 2713 Roger St | 0.22mi | 2/2.0 | 1,152 (-14%) | 2mo | $120,000 | $104 | 65 |
| 1523 Caribbean Rd | 0.72mi | 2/2.0 | 1,368 (+2%) | 1mo | $150,000 | $110 | 62 |
| 1543 St Thomas Ave | 0.62mi | 2/2.0 | 1,344 (0%) | 13mo | $97,000 | $72 | 61 |
| 2209 Bahama Rd W | 0.61mi | 2/2.0 | 1,344 (0%) | 16mo | $130,000 | $97 | 59 |
| 3009 Hammock Ter | 0.33mi | 3/2.0 (+1) | 1,512 (+12%) | 1mo | $150,000 | $99 | 58 |
| 2844 Louis St | 0.15mi | 2/2.0 | 1,164 (-13%) | 21mo | $105,000 | $90 | 53 |
| 2109 Caribbean Rd | 0.70mi | 3/2.0 (+1) | 1,344 (0%) | 12mo | $159,900 | $119 | 52 |
| 1528 Caribbean Rd | 0.71mi | 2/2.0 | 1,248 (-7%) | 6mo | $154,900 | $124 | 50 |
| 1553 Caribbean Rd | 0.58mi | 2/2.0 | 1,296 (-4%) | 21mo | $160,000 | $123 | 49 |
| 1534 Caribbean Rd | 0.68mi | 2/2.0 | 1,276 (-5%) | 17mo | $180,000 | $141 | 46 |
| 1507 Caribbean Rd | 0.74mi | 3/2.0 (+1) | 1,188 (-12%) | 2mo | $155,000 | $130 | 39 |
| 1525 Caribbean Rd | 0.71mi | 2/2.0 | 1,488 (+11%) | 12mo | $145,000 | $97 | 39 |
Match score weights: distance 35% · size 25% · config 20% · recency 20%. Top-matched comps best support the ARV.
Projected returns pro-forma
-3.0% appreciation · 1.65% rent growth · sell at horizon
- IRR
- 79.9%
- Equity multiple
- 4.58×
- Total profit
- $38,065
- Equity at exit
- $5,666
- IRR
- 83.0%
- Equity multiple
- 9.05×
- Total profit
- $85,620
- Equity at exit
- $3,286
Cash invested: $10,640 (down + closing). Projections, not guarantees.
Landlord ↔ Tenant lean methodology
- Overall (STATE)
- 87 Strongly Landlord-Friendly
- State Florida
- 87 Strongly Landlord-Friendly · R+3
- County
- — inherits STATE
- City
- — inherits STATE
ZIP-level market 33872
- Home prices YoY
- -25.8%
- Rents YoY
- 1.6%
- Active inventory
- 707
- Price-to-rent
- 2.5×
Monthly cashflow live
- Estimated rent
- $1,248 medium interval (Pro) →
- Mortgage (P&I)
- −$199
- Tax from tax record
- −$51 /mo · $608/yr
- Insurance
- −$16
- HOA
- −$0
- Lot rent leased land?
- −$0
- Vacancy / Maint / Mgmt
- −$262
- Net cashflow
- $720
Break-even live
Sensitivity live
| Price | -10% $742 | -5% $731 | +0% $720 | +5% $710 | +10% $699 |
|---|---|---|---|---|---|
| Rent | -10% $622 | -5% $671 | +0% $720 | +5% $770 | +10% $819 |
| Rate | -1.0pp $739 | -0.5pp $730 | base $720 | +0.5pp $710 | +1.0pp $700 |
UW: 25.0% down · 7.5% · 30yr · 1.5% tax · 5.0% vac · 8.0% maint · 8.0% mgmt
Financing live
Cash to close
- Down payment
- $9,500
- Closing costs
- $1,140
- Reserves months
- —
- Total cash needed
- —
Loan-product check · same deal, 3 products live
Conventional
25% down · 7.5% · 30yr
- Down + closing
- —
- Monthly P&I
- —
- Monthly cashflow
- —
- DSCR
- —
- Eligible?
- —
Personal DTI + credit; lowest rate.
DSCR
20% down · 8.5% · 30yr
- Down + closing
- —
- Monthly P&I
- —
- Monthly cashflow
- —
- DSCR
- —
- Eligible?
- —
No personal income docs; deal must DSCR.
Hard money
10% down · 12.0% · 12mo
- Down + closing
- —
- Monthly P&I
- —
- Monthly cashflow
- —
- DSCR
- —
- Eligible?
- —
Short-term bridge; refi at stabilization.
Rent comps 1 comps
| Address | Beds | Baths | Sqft | Rent | $/sqft | DOM | Units | Dist |
|---|---|---|---|---|---|---|---|---|
| 2545 Brunns Rd Sebring, FL | 3.0 | 2.0 | 1248 | $1,600 | $1.28 | 23d | 1 | 0.36mi |
Listing history 20 events
-
2026-06-23pricedays on market $38,000 Active 209 DOM
-
2026-06-21days on market $49,900 Active 208 DOM
-
2026-06-19days on market $49,900 Active 206 DOM
-
2026-06-18days on market $49,900 Active 205 DOM
-
2026-06-17days on market $49,900 Active 204 DOM
-
2026-06-16days on market $49,900 Active 203 DOM
-
2026-06-15days on market $49,900 Active 202 DOM
-
2026-06-14days on market $49,900 Active 200 DOM
-
2026-06-10days on market $49,900 Active 197 DOM
-
2026-06-09days on market $49,900 Active 196 DOM
-
2026-06-08days on market $49,900 Active 195 DOM
-
2026-06-07days on market $49,900 Active 194 DOM
-
2026-06-02days on market $49,900 Active 189 DOM
-
2026-06-01days on market $49,900 Active 188 DOM
-
2026-05-31days on market $49,900 Active 187 DOM
-
2026-05-30days on market $49,900 Active 186 DOM
-
2026-05-27status Active
-
2026-04-23historical
-
2026-02-24price $49,900
-
2025-10-23$59,900 Active
ⓘ Source: listings_history table (triggers on properties + properties_extension) + one-shot
backfill from property_details.listing_events for pre-trigger history.
Tax reassessment forecast FL · Resets to sale price
- Current annual tax
- $608 · $51/mo
- Projected year-2 tax
- $608 · $51/mo
- Expected delta
- $0/yr ($0/mo · 0.0%)
ⓘ Screening estimate from a state-policy table — verify with the county assessor before closing.
Climate risk First Street
- Flood 4/10 Moderate FEMA zone X (unshaded) · 22% chance over 30 yrs
- Wildfire 5/10 Major
- Heat 8/10 Severe 7 d/yr ≥108°F today · 25 d/yr by 30 yrs out
- Wind 9/10 Extreme 99% chance of damaging wind over 30 yrs
- Air quality 2/10 Low 2 unhealthy d/yr today · 2 by 30 yrs out
Nearby sold comps map
Loading sold comps map…
Walkable amenities ~0.75 mi
Loading nearby amenities…
Taxation est. · year 1
- Rental income
- $14,978
- − Mortgage interest
- −$2,129
- − Property taxes
- −$608
- − Insurance
- −$190
- − Repairs & maintenance
- −$1,198
- − Management
- −$1,198
- − Depreciation
- −$1,105
- Taxable income
- $8,549
- Est. tax owed @ 24.0%
- −$2,052
- After-tax cash flow
- $6,591/yr
For passive investors: Depreciation is non-cash, so a rental often shows a tax loss while cash-flowing — sheltering income. Rental losses are passive: they offset passive income freely, and up to $25,000/yr can offset ordinary (W-2) income if you actively participate and your MAGI is under $100k (phasing out to $0 by $150k); unused losses carry forward. On sale, claimed depreciation is recaptured at up to 25%, and gains may owe capital-gains tax (a 1031 exchange can defer both). Figures are a year-1 estimate at your 24.0% rate — not tax advice; consult a CPA.
Schools (NCES district)
- District
- Highlands
- NCES district ID
- 1200840
- Math proficiency
- 45% ▼ -7.00%
- Reading proficiency
- 43% ▼ -3.00%
- Median HH income
- $35,276
- Composite
- 36.42/100
- National rank
- #4672
- State rank
- #54 of 73 in FL
Livability — Sebring
- Score
- 66/100
- State rank
- #618
- US rank
- #11992
Category grades
Schools grade is shown separately in the Schools card above.
Census & demographics
- County
- Highlands County · 98,898 people
- City population
- 50,797
- Metro
- Sebring-Avon Park, FL
- Population (ZIP)
- 13,746
- Household income
- $69,578
- Rent vs Own
- Severe rent burden
- 222.0
Population outlook (Highlands County) Hauer SSP2
- Today (2025)
- 99,674 people
- By 2030
- 99,615 · -0.1%
- By 2040
- 99,342 · -0.3%
- By 2050
- 98,242 · -1.4%
- By 2075
- 93,291 · -6.4%
- By 2100
- 79,894 · -19.8%
Race, ethnicity, and origin ACS 2023
- Neighborhood character
- Majority White (65%)
- Race & ethnicity
- White 65% Hispanic / Latino 22% Two or more races 11% Black 5% Asian 4% Native American 1%
- Hispanic origin (detail)
- Mexican 5% Puerto Rican 9% Cuban 3%
- Common ancestry
- Romanian 2% Russian 2% Slovak 2%
- Foreign-born
- 12% · Canada, Jamaica
- Languages at home
- 79% English-only · Spanish 16% Other Asian/Pacific 2% Other Indo-European 1%
Political lean MEDSL · Highlands
- 2024 margin
- Solid R (+40.8) · D 29.3% · R 70.1%
- 2008→2024 swing
- -22.7pp toward R · 2008: -18.1pp · 2024: -40.8pp
- All cycles
- 2024: R+40.8 2020: R+34.4 2016: R+32.0 2012: R+23.0 2008: R+18.1
Not yet ingested
- Civics
- —
Market trends
- HPI YoY
- ▼ -78.20%
- Current HPI
- 225.3761
- Rent YoY
- ▲ 1.65%
- Metro
- Sebring-Avon Park, FL
- State GDP YoY
- ▲ 3.28%
- F500 in state
- 36
Industry mix (Fortune 500 HQ in FL)
| Industry | F500 HQs | Revenue |
|---|---|---|
| Industrial Technology | 2 | $29B |
|
||
| Insurance | 2 | $17B |
|
||
| Retail | 1 | $60B |
|
||
| Technology Distribution | 1 | $58B |
|
||
| Homebuilding | 1 | $35B |
|
||
| Technology Manufacturing | 1 | $35B |
|
||
Price history
-16.7% since first listed4 events — show timeline
- 2026-05-27 Relisted — HAOR as distributed by MLS GRID
- 2026-04-23 Delisted — HAOR as distributed by MLS GRID
- 2026-02-24 Price Changed $49,900 HAOR as distributed by MLS GRID
- 2025-10-23 Listed $59,900 HAOR as distributed by MLS GRID
Property tax history
+9.5%/yrLatest (2025): $608 · +11.7% YoY. Source: county tax records.
Cash-flow waterfall
monthlySold comps — $/sqft
last 12 mo · ≤1 miLoading sold comps…