 Duplex
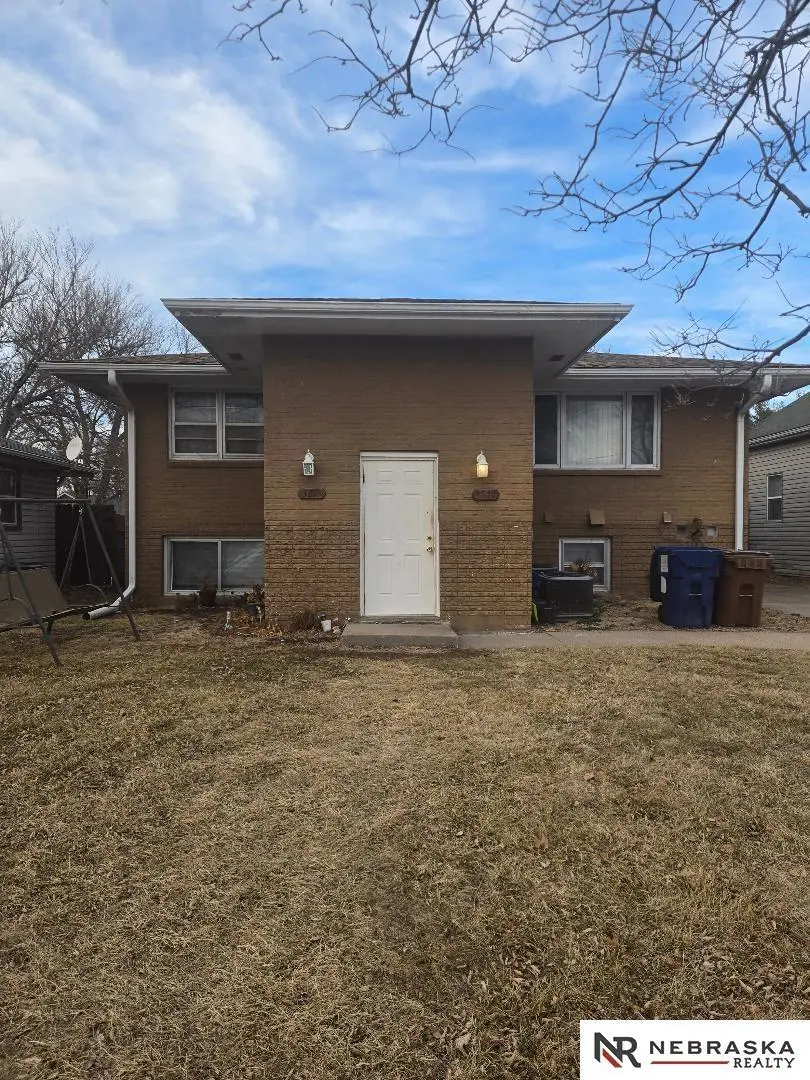
3210 Y St · Lincoln, NE
Flood risk 1/10 · Minimal
- FEMA flood zone
- X (unshaded)
- Chance of flooding over 30 yrs
- 0.0%
- Est. flood insurance / yr
- $507 – $1,088
Fire risk 1/10 · Minimal
- Est. fire insurance / yr
- $1,161 – $2,155
Heat risk 3/10 · Minor
- Hot days now (above 104°F)
- 7 days/yr
- Hot days in 30 yrs
- 16 days/yr
Wind risk 2/10 · Minimal
- Chance of severe wind over 30 yrs
- —
Air-quality risk 1/10 · Minimal
- Unhealthy air days now
- 0 days/yr
- Unhealthy air days in 30 yrs
- 0 days/yr
Risk factors via First Street. Map © Google.
Why this score? — see what drove the C+ grade
The composite is a weighted blend of 9 inputs, each scored 0–100. Each bar is that input's sub-score; the figure is the points it added to the 100-point composite (weight × sub-score).
- Cash flow +22.9/30.0
- ARV discount +14.5/15.0
- DSCR +7.3/10.0
- 1% rule +5.9/10.0
- Schools +4.4/10.0
- Livability +4.2/5.0
- Rent growth +3.1/5.0
- Condition / age +2.5/5.0
- Appreciation +0.0/10.0
$190,000
🖨 Deal sheet (PDF) 📄 Offer letter ✓ Due diligence
Multi-family units
County records classify this as Multi-Family (2-4 Unit). Listing-text estimate: 2 units. confirmed
Listing remarks MLS
2 Unit Duplex 1 bedroom and 2 bedroom Units
Key facts
- 6,550 sq ft lot
- 2 parking spots
- Built 1963
Neighborhood map
What this means for you Summary
Snapshot
- This is a 1×1bd/1.0ba + 1×2bd/1.0ba units multifamily listed at $190k.
Deal economics
- At list price, monthly cash flow is $332 ($4k/yr) — positive. Per door: $166/mo.
- The deal already cash-flows at list — no discount required.
- Meets the 1% rule at list price ($2k rent vs $190k).
- Recommended offer: $179k (6.0% below list) — sets the bar for market timing.
- Cap rate 8.4% vs local median 3.0% in Lincoln — top-decile yield for the area; either an underpriced asset or a hidden risk that comps aren't pricing in. Stress-test before assuming the spread holds.
Location & tenants
- Location reads 85/100 on livability (#5 in NE, #545 nationally) — a professional / high-income tenant draw. Strengths: amenities A+, cost of living A+, housing A+; Watch: crime D+.
- Lincoln Public Schools (urban): math 50% / reading 53% proficiency, ranked #59 of 111 in NE (top 53%) — acceptable for families but not a draw, mixed tenant base, ~2y average lease.
- Market conditions: Rents rising (+2.4%/yr); 59 active listings in the ZIP; 10 comparable units currently listed for rent nearby; rentals lingering (median 45d on market — plan ~5-8 weeks vacancy on turnover, expect pricing pressure); 70% of comp listings sitting > 30 days — soft ceiling on asking rent; 1,940 units permitted in Lancaster County in 2024 (895 in 5+ unit buildings).
- At $2,065/mo this rent would consume 46% of the median local household income ($54k/yr) (locally 820% of renters already pay >50% of income on rent) — very limited rent-growth headroom before tenants either downsize or default.
Forward outlook
- Local home prices are declining (-3.0%/yr); year-one equity from $1k of loan paydown is wiped out by about $6k of value loss. Plan a longer hold.
- Lancaster County population projected at +37% by 2050 — long-run rental-demand tailwind backs the buy-and-hold thesis.
Negotiation context
- It's been on market 82 days — a 6% lower offer ($179k) is reasonable based on typical stale-listing flexibility.
- 4 sale attempts since 10y ago; this cycle's ask has dropped $25k (12%) from the opening price — seller is motivated, your offer sets the floor, not the list.
- Current owner paid $114k; list at $190k implies a 67% gain — meaningful room to come down on a strong offer.
Questions for the listing agent
- It's been on market 82 days. Have you received any prior offers? Is the seller open to a 6% concession, seller financing, or rate buy-down credit?
- Can we see the unit-by-unit rent roll, current vacancy, and any below-market leases? What's the average tenancy length?
- What capital expenditures (roof, boiler, parking lot, exteriors) have been made in the last 5 years, and what's planned in the next 2?
- Built in 1963 — when were the roof, HVAC, electrical panel, plumbing, and water heater last replaced?
- Why hasn't it sold? Are there any deal-killer items the seller is aware of (foundation, flood, title, zoning, code violations)?
- Is there a deadline driving the sale (1031 exchange, divorce, estate, relocation)? That informs how much negotiation room exists.
- Schools are A-rated — typically a magnet for longer-tenancy family renters. What's the average tenant stay here, and is there a school-zone premium baked into asking?
- Crime grade is D in this area — have there been break-ins, vandalism, or insurance claims at this property in the last 3 years? What carrier currently insures it and at what premium?
- What's the average days-on-market for RENTAL listings here right now (not sales)? A rising rental-DOM trend means longer vacancies and softer asking-rent achievability than the comps imply.
- What's the recent tenant-quality profile in this submarket — average credit score on applications, eviction rate, late-payment / NSF rate, and stable-employment percentage? A property-management company in the area should have these aggregated.
- How much new apartment / multifamily construction is in the pipeline within 1–3 miles? Heavy new supply (>2% of stock underway) typically softens rents 12–24 months out; light construction supports rent growth.
Investment metrics
- 1% rule
- 1.09% ✓
- Cap rate
- 8.39%
- Cash-on-cash
- 7.49%
- DSCR
- 1.33
- GRM
- 7.7
CMA / ARV
- ARV (median comp)
- $225,056
- List price
- $190,000
- Delta
- -15.58%
- Verdict
- UNDERPRICED
- Comps
- 20 within 1.0 mi
Show comp detail 9 sales within ~0.75 mi
| Address | Dist | Beds/Ba | Sqft | Sold | Price | $/sf | Match |
|---|---|---|---|---|---|---|---|
| 3210 Y St | 0.00mi | 3/2.0 (-1) | 1,824 (0%) | 1mo | $190,000 | $104 | 94 |
| 2917 Holdrege St | 0.33mi | 4/2.0 | 1,813 (-1%) | 12mo | $225,000 | $124 | 73 |
| 2840 Starr St | 0.34mi | 4/3.0 | 1,900 (+4%) | 1mo | $195,000 | $103 | 72 |
| 3218 Holdrege St | 0.25mi | 3/2.0 (-1) | 1,988 (+9%) | 11mo | $225,000 | $113 | 59 |
| 3123 R St | 0.54mi | 5/2.0 (+1) | 1,900 (+4%) | 9mo | $155,000 | $82 | 56 |
| 360/362 N 35 St | 0.60mi | 4/2.0 | 1,746 (-4%) | 12mo | $250,000 | $143 | 55 |
| 2745 Q St | 0.71mi | 4/2.0 | 1,836 (+1%) | 18mo | $115,000 | $63 | 51 |
| 2905 Vine St | 0.39mi | 3/2.0 (-1) | 1,566 (-14%) | 18mo | $198,000 | $126 | 39 |
| 221 N 33rd St | 0.68mi | 4/2.0 | 1,566 (-14%) | 18mo | $155,500 | $99 | 30 |
Match score weights: distance 35% · size 25% · config 20% · recency 20%. Top-matched comps best support the ARV.
Projected returns pro-forma
-3.0% appreciation · 2.39% rent growth · sell at horizon
- IRR
- -5.5%
- Equity multiple
- 0.80×
- Total profit
- $-10,873
- Equity at exit
- $28,330
- IRR
- 3.4%
- Equity multiple
- 1.24×
- Total profit
- $12,755
- Equity at exit
- $16,428
Cash invested: $53,200 (down + closing). Projections, not guarantees.
Landlord ↔ Tenant lean methodology
- Overall (STATE)
- 83 Strongly Landlord-Friendly
- State Nebraska
- 83 Strongly Landlord-Friendly · R+13
- County
- — inherits STATE
- City
- — inherits STATE
ZIP-level market 68503
- Rents YoY
- 2.4%
- Active inventory
- 59
- Price-to-rent
- 16.0×
Monthly cashflow live
- Estimated rent
- $2,065 high interval (Pro) →
- Mortgage (P&I)
- −$996
- Tax from tax record
- −$224 /mo · $2,684/yr
- Insurance
- −$79
- HOA
- −$0
- Vacancy / Maint / Mgmt
- −$434
- Net cashflow
- $332
Break-even live
Sensitivity live
| Price | -10% $440 | -5% $386 | +0% $332 | +5% $278 | +10% $225 |
|---|---|---|---|---|---|
| Rent | -10% $169 | -5% $251 | +0% $332 | +5% $414 | +10% $495 |
| Rate | -1.0pp $428 | -0.5pp $380 | base $332 | +0.5pp $283 | +1.0pp $233 |
2-unit breakdown (identical units grouped — click to expand)
| Units | Beds | Baths | Est. rent |
|---|---|---|---|
| 1× unit | 1 | 1 | $987 |
| 1× unit | 2 | 1 | $1,078 |
| Total (2 units) | $2,065 | ||
UW: 25.0% down · 7.5% · 30yr · 1.5% tax · 5.0% vac · 8.0% maint · 8.0% mgmt
Financing live
Cash to close
- Down payment
- $47,500
- Closing costs
- $5,700
- Reserves months
- —
- Total cash needed
- —
Loan-product check · same deal, 3 products live
Conventional
25% down · 7.5% · 30yr
- Down + closing
- —
- Monthly P&I
- —
- Monthly cashflow
- —
- DSCR
- —
- Eligible?
- —
Personal DTI + credit; lowest rate.
DSCR
20% down · 8.5% · 30yr
- Down + closing
- —
- Monthly P&I
- —
- Monthly cashflow
- —
- DSCR
- —
- Eligible?
- —
No personal income docs; deal must DSCR.
Hard money
10% down · 12.0% · 12mo
- Down + closing
- —
- Monthly P&I
- —
- Monthly cashflow
- —
- DSCR
- —
- Eligible?
- —
Short-term bridge; refi at stabilization.
Rent comps 10 comps
| Address | Beds | Baths | Sqft | Rent | $/sqft | DOM | Units | Dist |
|---|---|---|---|---|---|---|---|---|
| 3548 R St Unit A Lincoln, NE | 4.0 | 3.5 | 1328 | $2,550 | $1.92 | 45d | 1 | 0.60mi |
| 2253 Orchard St Unit 1 Lincoln, NE | 4.0 | 3.0 | 2000 | $2,400 | $1.20 | 45d | 1 | 0.70mi |
| 2245 Holdrege St Lincoln, NE | 4.0 | 1.0 | 1422 | $1,900 | $1.34 | 45d | 1 | 0.73mi |
| 2608 Q St Unit 2 Lincoln, NE | 4.0 | 2.0 | 1575 | $1,550 | $0.98 | 45d | 1 | 0.76mi |
| 3811 Baldwin Ave Lincoln, NE | 1.0–3.0 | 1.0–2.0 | 1015 | $1,489 | $1.47 | 15d | 14 | 0.99mi |
| 4630 Starr St Unit 4630 Lincoln, NE | 3.0 | 1.0 | 1460 | $1,250 | $0.86 | 45d | 1 | 1.03mi |
| 2039 Q St Unit 102 Lincoln, NE | 3.0 | 3.0 | 1450 | $1,595 | $1.10 | 45d | 1 | 1.08mi |
| 2039 Q St Unit 103 Lincoln, NE | 3.0 | 3.0 | 1450 | $1,695 | $1.17 | 45d | 1 | 1.08mi |
| 4602 Saint Paul Ave Unit 3 Lincoln, NE | 4.0 | 1.0 | 1344 | $1,550 | $1.15 | 15d | 1 | 1.41mi |
| 420 S 18th St Lincoln, NE | 1.0–3.0 | 1.0–2.0 | 996 | $1,499 | $1.51 | 15d | 8 | 1.48mi |
Listing history 12 events
-
2026-05-11status Pending 43-char remark
Show marketing remark (43 chars)
2 Unit Duplex 1 bedroom and 2 bedroom Units
-
2026-05-05price $190,000 43-char remark
Show marketing remark (43 chars)
2 Unit Duplex 1 bedroom and 2 bedroom Units
-
2026-03-27price $205,000 43-char remark
Show marketing remark (43 chars)
2 Unit Duplex 1 bedroom and 2 bedroom Units
-
2026-03-06status Back On Market 43-char remark
Show marketing remark (43 chars)
2 Unit Duplex 1 bedroom and 2 bedroom Units
-
2026-03-04status Pending 43-char remark
Show marketing remark (43 chars)
2 Unit Duplex 1 bedroom and 2 bedroom Units
-
2026-02-16$215,000 New 43-char remark
Show marketing remark (43 chars)
2 Unit Duplex 1 bedroom and 2 bedroom Units
-
2016-08-19soldstatus $113,500 479-char remark
Show marketing remark (479 chars)
Cash Flow solid brick Duplex looking for its new owner.Great investment property with great updates and improvements done by seller. A new roof in 2011 and new bathroom fixtures. Fresh interior and exterior paint in 2015, new kitchen counters and cabinets in 2013. New flooring in the basement apartment. Property is closed to UNL East Campus and UNL.Large backyard for expansion with Storage areas galore and garden area.Upper unit rents for $725 and Lower unit rents for $400 .
-
2016-07-08historical 479-char remark
Show marketing remark (479 chars)
Cash Flow solid brick Duplex looking for its new owner.Great investment property with great updates and improvements done by seller. A new roof in 2011 and new bathroom fixtures. Fresh interior and exterior paint in 2015, new kitchen counters and cabinets in 2013. New flooring in the basement apartment. Property is closed to UNL East Campus and UNL.Large backyard for expansion with Storage areas galore and garden area.Upper unit rents for $725 and Lower unit rents for $400 .
-
2016-05-05historical
-
2016-05-04$115,500 479-char remark
Show marketing remark (479 chars)
Cash Flow solid brick Duplex looking for its new owner.Great investment property with great updates and improvements done by seller. A new roof in 2011 and new bathroom fixtures. Fresh interior and exterior paint in 2015, new kitchen counters and cabinets in 2013. New flooring in the basement apartment. Property is closed to UNL East Campus and UNL.Large backyard for expansion with Storage areas galore and garden area.Upper unit rents for $725 and Lower unit rents for $400 .
-
2016-02-03$117,500
-
2006-07-14soldstatus $111,000
ⓘ Source: listings_history table (triggers on properties + properties_extension) + one-shot
backfill from property_details.listing_events for pre-trigger history.
Tax reassessment forecast NE · Resets to sale price
- Current annual tax
- $2,684 · $224/mo
- Projected year-2 tax
- $3,287 · $274/mo
- Expected delta
- +$603/yr (+$50/mo · 22.5%)
ⓘ Screening estimate from a state-policy table — verify with the county assessor before closing.
Climate risk First Street
- Flood 1/10 Low FEMA zone X (unshaded) · 0% chance over 30 yrs
- Wildfire 1/10 Low
- Heat 3/10 Moderate 7 d/yr ≥104°F today · 16 d/yr by 30 yrs out
- Wind 2/10 Low
- Air quality 1/10 Low 0 unhealthy d/yr today · 0 by 30 yrs out
Nearby sold comps map
Loading sold comps map…
Walkable amenities ~0.75 mi
Loading nearby amenities…
Taxation est. · year 1
- Rental income
- $24,780
- − Mortgage interest
- −$10,643
- − Property taxes
- −$2,684
- − Insurance
- −$950
- − Repairs & maintenance
- −$1,982
- − Management
- −$1,982
- − Depreciation
- −$5,527
- Taxable income
- $1,011
- Est. tax owed @ 24.0%
- −$243
- After-tax cash flow
- $3,743/yr
For passive investors: Depreciation is non-cash, so a rental often shows a tax loss while cash-flowing — sheltering income. Rental losses are passive: they offset passive income freely, and up to $25,000/yr can offset ordinary (W-2) income if you actively participate and your MAGI is under $100k (phasing out to $0 by $150k); unused losses carry forward. On sale, claimed depreciation is recaptured at up to 25%, and gains may owe capital-gains tax (a 1031 exchange can defer both). Figures are a year-1 estimate at your 24.0% rate — not tax advice; consult a CPA.
Schools (NCES district)
- District
- Lincoln Public Schools
- NCES district ID
- 3172840
- Math proficiency
- 50% ▼ -6.00%
- Reading proficiency
- 53% ▼ -3.00%
- Median HH income
- $50,273
- Composite
- 44.05/100
- National rank
- #2880
- State rank
- #59 of 111 in NE
Livability — Lincoln
- Score
- 85/100
- State rank
- #5
- US rank
- #545
Category grades
Schools grade is shown separately in the Schools card above.
Census & demographics
- Census place
- Lincoln, NE
- County
- Lancaster County · 291,509 people
- City population
- 291,509
- Metro
- Lincoln, NE
- Population (ZIP)
- 15,867
- Household income
- $54,232
- Rent vs Own
- Severe rent burden
- 820.0
Population outlook (Lancaster County) Hauer SSP2
- Today (2025)
- 352,806 people
- By 2030
- 377,899 · +7.1%
- By 2040
- 428,582 · +21.5%
- By 2050
- 483,103 · +36.9%
- By 2075
- 632,390 · +79.2%
- By 2100
- 759,513 · +115.3%
Race, ethnicity, and origin ACS 2023
- Neighborhood character
- Diverse neighborhood (Simpson 0.62)
- Race & ethnicity
- White 59% Hispanic / Latino 12% Black 12% Two or more races 10% Asian 10%
- Hispanic origin (detail)
- Mexican 8%
- Common ancestry
- Lithuanian 2% Romanian 2% Portuguese 2%
- Foreign-born
- 19% · Canada, Vietnam, China
- Languages at home
- 73% English-only · Spanish 7% Other Indo-European 5% Vietnamese 5%
Political lean MEDSL · Lancaster
- 2024 margin
- Toss-up / Even · D 51.4% · R 47.1% · Other 1.5%
- 2008→2024 swing
- -0.7pp no change · 2008: 5.0pp · 2024: 4.3pp
- All cycles
- 2024: D+4.3 2020: D+7.8 2016: D+0.1 2012: R+1.0 2008: D+5.0
Not yet ingested
- Civics
- —
Market trends
- HPI YoY
- ▼ -145.46%
- Current HPI
- 260.3421
- Rent YoY
- ▲ 2.39%
- Metro
- Lincoln, NE
- State GDP YoY
- ▲ 0.68%
- F500 in state
- 2
Industry mix (Fortune 500 HQ in NE)
| Industry | F500 HQs | Revenue |
|---|---|---|
| Conglomerate | 1 | $371B |
|
||
Price history
+71.2% since first listed12 events — show timeline
- 2026-05-11 Pending — GPRMLS
- 2026-05-05 Price Changed $190,000 GPRMLS
- 2026-03-27 Price Changed $205,000 GPRMLS
- 2026-03-06 Relisted — GPRMLS
- 2026-03-04 Pending — GPRMLS
- 2026-02-16 Listed $215,000 GPRMLS
- 2016-08-19 Sold (MLS) $113,500 GPRMLS
- 2016-07-08 Listing Removed — GPRMLS
- 2016-05-05 Listing Removed — GPRMLS
- 2016-05-04 Listed $115,500 GPRMLS
- 2016-02-03 Listed $117,500 GPRMLS
- 2006-07-14 Sold (Public Records) $111,000 Public Records
Property tax history
+1.9%/yrLatest (2025): $2,684 · +2.9% YoY. Source: county tax records.
Cash-flow waterfall
monthlySold comps — $/sqft
last 12 mo · ≤1 miLoading sold comps…