207 S Jackson St · Frankton, IN
Flood risk 1/10 · Minimal
- FEMA flood zone
- X (unshaded)
- Chance of flooding over 30 yrs
- 0.0%
- Est. flood insurance / yr
- $507 – $1,088
Fire risk 1/10 · Minimal
- Est. fire insurance / yr
- $717 – $1,331
Heat risk 3/10 · Minor
- Hot days now (above 100°F)
- 7 days/yr
- Hot days in 30 yrs
- 18 days/yr
Wind risk 2/10 · Minimal
- Chance of severe wind over 30 yrs
- —
Air-quality risk 4/10 · Minor
- Unhealthy air days now
- 3 days/yr
- Unhealthy air days in 30 yrs
- 5 days/yr
Risk factors via First Street. Map © Google.
Why this score? — see what drove the D grade
The composite is a weighted blend of 9 inputs, each scored 0–100. Each bar is that input's sub-score; the figure is the points it added to the 100-point composite (weight × sub-score).
- ARV discount +15.0/15.0
- Appreciation +10.0/10.0
- Cash flow +4.9/30.0
- Schools +3.5/10.0
- Livability +3.3/5.0
- Rent growth +2.5/5.0
- Condition / age +2.5/5.0
- 1% rule +0.0/10.0
- DSCR +0.0/10.0
$160,000
🖨 Deal sheet (PDF) 📄 Offer letter ✓ Due diligence
Listing remarks MLS
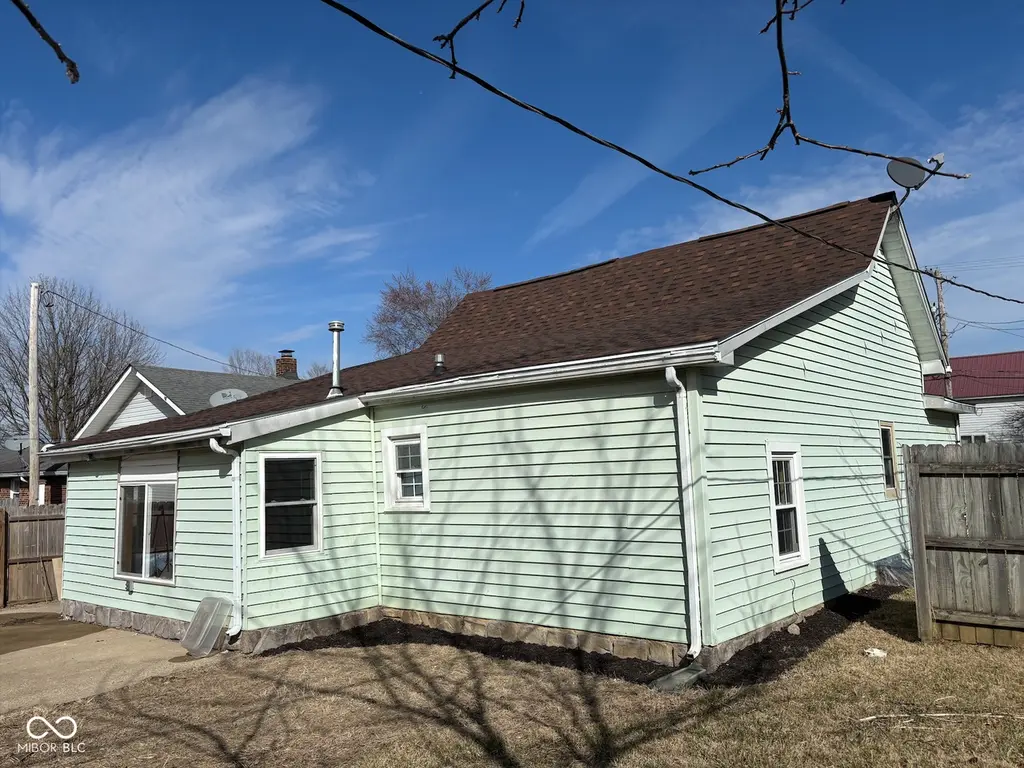
Residing at 207 S Jackson ST, FRANKTON, IN, USA, this single family residence, constructed in 1900, offers a quiet-yet-inviting home environment, thoroughly prepared for immediate occupancy. Within the living room, a distinctive wood ceiling creates an atmosphere of warmth, complemented by a fireplace that promises serene evenings and a welcoming focal point for gatherings. The kitchen stands as a central hub for culinary endeavors, featuring a large kitchen island that offers ample workspace, a tasteful backsplash for a refined aesthetic, and a practical kitchen bar designed for casual dining or conversation. One of the two full bathrooms provides contemporary convenience with a spacious walk in shower, offering a refreshing and accessible bathing experience. This residence encompasses four bedrooms and two full bathrooms within its 1560 square feet of living area, thoughtfully arranged across 1.5 stories to maximize comfort and utility. The expansive 6250 square feet lot provides generous outdoor dimensions, featuring a welcoming porch for relaxation, a private patio ideal for outdoor enjoyment, and a securely fenced backyard that offers seclusion and versatility. This meticulously prepared single family residence presents an exceptional opportunity for a distinguished living experience.
Key facts
- Large kitchen island
- Wood ceiling
- Private patio
Tags
Neighborhood map
What this means for you Summary
Snapshot
- This is a 2-bed/1.0-bath single-family listed at $160k.
Deal economics
- At list price, monthly cash flow is $-384 ($-5k/yr) — negative.
- To cash-flow at today's rent, offer at most $92k (42.4% below list).
- To meet the 1% rule (rent ≥ 1% of price), the offer needs to be $80k (50.0% below list).
- Recommended offer: $80k (50.0% below list) — sets the bar for 1% rule.
Location & tenants
- Location reads 66/100 on livability (#300 in IN) — a middle-class / working-renter tenant base. Strengths: crime A+, cost of living A+, housing A+; Watch: amenities F, commute F, health & safety F.
- Frankton-Lapel Community Schools (rural): math 39% / reading 41% proficiency, ranked #131 of 301 in IN (top 44%) — families likely to look elsewhere, expect single-tenant / working-renter base with shorter leases.
- Zoned schools: Frankton Elementary School (math 43% / reading 31%, grade F, #550 of 994 statewide, top 57%, 806 students, 51% FRL); Lapel Middle School (math 37% / reading 43%, grade F, #120 of 330 statewide, top 37%, 336 students, 32% FRL); Frankton Jr-Sr High School (math 31% / reading 47%, grade F, #235 of 369 statewide, top 65%, 778 students, 46% FRL) — zoned schools average 43% FRL vs 27% district-wide (16 pts higher); higher-poverty schools than district average — tighter screening recommended.
- Market conditions: 14 active listings in the ZIP; 1 comparable units currently listed for rent nearby; 184 units permitted in Madison County in 2024 (0 in 5+ unit buildings).
Forward outlook
- In year one you build about $17k of equity ($1k loan paydown + $16k appreciation (10.0% local appreciation)).
- Madison County population projected at -14% by 2050 — secular population decline; favor cash flow + early exit over multi-decade hold.
- By year 3, paydown + projected appreciation supports a ~$43k cash-out refi (75% LTV) — recoverable capital for the next deal without selling this one.
Negotiation context
- It's been on market 109 days — a 9% lower offer ($146k) is reasonable based on typical stale-listing flexibility.
- 3 sale attempts since 27y ago with the ask held roughly flat each time — persistent listings suggest the price (not the market) is what's stuck; bring a comps-based counter.
- Current owner paid $38k; list at $160k implies a 321% gain — meaningful room to come down on a strong offer.
Risks & watch-outs
- Watch-outs: built in 1900 — expect roof / HVAC / electrical / plumbing capex.
Questions for the listing agent
- What do current leases actually rent for vs. the listed asking? Can we see a recent rent roll and the last 12 months of T-12 income?
- It's been on market 109 days. Have you received any prior offers? Is the seller open to a 50% concession, seller financing, or rate buy-down credit?
- Built in 1900 — when were the roof, HVAC, electrical panel, plumbing, and water heater last replaced?
- Why hasn't it sold? Are there any deal-killer items the seller is aware of (foundation, flood, title, zoning, code violations)?
- Is there a deadline driving the sale (1031 exchange, divorce, estate, relocation)? That informs how much negotiation room exists.
- The area grade is low — what's the realistic commute time and amenity access for the typical tenant pool here? Any planned neighborhood developments (good or bad) we should know about?
- What's the average days-on-market for RENTAL listings here right now (not sales)? A rising rental-DOM trend means longer vacancies and softer asking-rent achievability than the comps imply.
- What's the recent tenant-quality profile in this submarket — average credit score on applications, eviction rate, late-payment / NSF rate, and stable-employment percentage? A property-management company in the area should have these aggregated.
- How much new for-sale + rental construction is in the pipeline within 1–3 miles? Heavy new supply typically softens prices + rents 12–24 months out; constrained supply supports both.
Investment metrics
- 1% rule
- 0.50% ✗
- Cap rate
- 3.41%
- Cash-on-cash
- -10.28%
- DSCR
- 0.54
- GRM
- 16.7
CMA / ARV
- ARV (median comp)
- $204,012
- List price
- $160,000
- Delta
- -21.57%
- Verdict
- UNDERPRICED
- Comps
- 20 within 1.0 mi
Show comp detail 1 sale within ~0.75 mi
| Address | Dist | Beds/Ba | Sqft | Sold | Price | $/sf | Match |
|---|---|---|---|---|---|---|---|
| 203 S John St | 0.26mi | 3/1.0 (+1) | 1,064 (+10%) | 19mo | $160,000 | $150 | 51 |
Match score weights: distance 35% · size 25% · config 20% · recency 20%. Top-matched comps best support the ARV.
Projected returns pro-forma
10.0% appreciation · 3.0% rent growth · sell at horizon
- IRR
- 17.1%
- Equity multiple
- 2.40×
- Total profit
- $62,647
- Equity at exit
- $144,141
- IRR
- 16.2%
- Equity multiple
- 5.55×
- Total profit
- $203,626
- Equity at exit
- $310,845
Cash invested: $44,800 (down + closing). Projections, not guarantees.
Landlord ↔ Tenant lean methodology
- Overall (STATE)
- 90 Strongly Landlord-Friendly
- State Indiana
- 90 Strongly Landlord-Friendly · R+11
- County
- — inherits STATE
- City
- — inherits STATE
ZIP-level market 46044
- Home prices YoY
- 6.9%
- Active inventory
- 14
- Price-to-rent
- 16.7×
Monthly cashflow live
- Estimated rent
- $800 medium interval (Pro) →
- Mortgage (P&I)
- −$839
- Tax from tax record
- −$110 /mo · $1,322/yr
- Insurance
- −$67
- HOA
- −$0
- Vacancy / Maint / Mgmt
- −$168
- Net cashflow
- $-384
Break-even live
Sensitivity live
| Price | -10% $-293 | -5% $-339 | +0% $-384 | +5% $-429 | +10% $-474 |
|---|---|---|---|---|---|
| Rent | -10% $-447 | -5% $-415 | +0% $-384 | +5% $-352 | +10% $-321 |
| Rate | -1.0pp $-303 | -0.5pp $-343 | base $-384 | +0.5pp $-425 | +1.0pp $-468 |
UW: 25.0% down · 7.5% · 30yr · 1.5% tax · 5.0% vac · 8.0% maint · 8.0% mgmt
Financing live
Cash to close
- Down payment
- $40,000
- Closing costs
- $4,800
- Reserves months
- —
- Total cash needed
- —
Loan-product check · same deal, 3 products live
Conventional
25% down · 7.5% · 30yr
- Down + closing
- —
- Monthly P&I
- —
- Monthly cashflow
- —
- DSCR
- —
- Eligible?
- —
Personal DTI + credit; lowest rate.
DSCR
20% down · 8.5% · 30yr
- Down + closing
- —
- Monthly P&I
- —
- Monthly cashflow
- —
- DSCR
- —
- Eligible?
- —
No personal income docs; deal must DSCR.
Hard money
10% down · 12.0% · 12mo
- Down + closing
- —
- Monthly P&I
- —
- Monthly cashflow
- —
- DSCR
- —
- Eligible?
- —
Short-term bridge; refi at stabilization.
Rent comps 1 comps
| Address | Beds | Baths | Sqft | Rent | $/sqft | DOM | Units | Dist |
|---|---|---|---|---|---|---|---|---|
| 209 Delaware St Unit A Frankton, IN | 2.0 | 1.0 | 650 | $800 | $1.23 | 4d | 1 | 0.73mi |
Listing history 22 events
-
2026-06-21days on market $160,000 Active 109 DOM
-
2026-06-18days on market $160,000 Active 106 DOM
-
2026-06-17days on market $160,000 Active 105 DOM
-
2026-06-16days on market $160,000 Active 104 DOM
-
2026-06-15days on market $160,000 Active 103 DOM
-
2026-06-13days on market $160,000 Active 101 DOM
-
2026-06-13days on market $160,000 Active 100 DOM
-
2026-06-09days on market $160,000 Active 97 DOM
-
2026-06-08days on market $160,000 Active 96 DOM
-
2026-06-07days on market $160,000 Active 95 DOM
-
2026-06-05days on market $160,000 Active 92 DOM
-
2026-06-03days on market $160,000 Active 91 DOM
-
2026-06-02days on market $160,000 Active 90 DOM
-
2026-06-01days on market $160,000 Active 89 DOM
-
2026-05-31days on market $160,000 Active 88 DOM
-
2026-03-04$160,000 Active 1313-char remark
Show marketing remark (1313 chars)
Residing at 207 S Jackson ST, FRANKTON, IN, USA, this single family residence, constructed in 1900, offers a quiet-yet-inviting home environment, thoroughly prepared for immediate occupancy. Within the living room, a distinctive wood ceiling creates an atmosphere of warmth, complemented by a fireplace that promises serene evenings and a welcoming focal point for gatherings. The kitchen stands as a central hub for culinary endeavors, featuring a large kitchen island that offers ample workspace, a tasteful backsplash for a refined aesthetic, and a practical kitchen bar designed for casual dining or conversation. One of the two full bathrooms provides contemporary convenience with a spacious walk in shower, offering a refreshing and accessible bathing experience. This residence encompasses four bedrooms and two full bathrooms within its 1560 square feet of living area, thoughtfully arranged across 1.5 stories to maximize comfort and utility. The expansive 6250 square feet lot provides generous outdoor dimensions, featuring a welcoming porch for relaxation, a private patio ideal for outdoor enjoyment, and a securely fenced backyard that offers seclusion and versatility. This meticulously prepared single family residence presents an exceptional opportunity for a distinguished living experience.
-
2021-10-06soldstatus $38,000
-
2020-11-12soldstatus $40,000
-
2004-08-02soldstatus $16,000 238-char remark
Show marketing remark (238 chars)
INVESTOR OPPORTUNITY IN SMALL RURAL COMMUNITY. 2 BEDROOM, NEEDS INTERIOR REHAB. PROPERTY BEING SOLD 'AS IS'. SELLER WILL MAKE NO REPAIRS. PLEASE SUBMIT COPY OF EARNEST MONEY AND PRE QUALIFICATION LETTER OR PROOF OF FUND S WITH ALL OFFERS.
-
2004-03-24$17,900 238-char remark
Show marketing remark (238 chars)
INVESTOR OPPORTUNITY IN SMALL RURAL COMMUNITY. 2 BEDROOM, NEEDS INTERIOR REHAB. PROPERTY BEING SOLD 'AS IS'. SELLER WILL MAKE NO REPAIRS. PLEASE SUBMIT COPY OF EARNEST MONEY AND PRE QUALIFICATION LETTER OR PROOF OF FUND S WITH ALL OFFERS.
-
1999-12-06historical
-
1999-06-07$65,500
ⓘ Source: listings_history table (triggers on properties + properties_extension) + one-shot
backfill from property_details.listing_events for pre-trigger history.
Tax reassessment forecast IN · Partial reset (capped growth)
- Current annual tax
- $1,322 · $110/mo
- Projected year-2 tax
- $1,341 · $112/mo
- Expected delta
- +$19/yr (+$2/mo · 1.4%)
ⓘ Screening estimate from a state-policy table — verify with the county assessor before closing.
Climate risk First Street
- Flood 1/10 Low FEMA zone X (unshaded) · 0% chance over 30 yrs
- Wildfire 1/10 Low
- Heat 3/10 Moderate 7 d/yr ≥100°F today · 18 d/yr by 30 yrs out
- Wind 2/10 Low
- Air quality 4/10 Moderate 3 unhealthy d/yr today · 5 by 30 yrs out
Nearby sold comps map
Loading sold comps map…
Walkable amenities ~0.75 mi
Loading nearby amenities…
Taxation est. · year 1
- Rental income
- $9,600
- − Mortgage interest
- −$8,962
- − Property taxes
- −$1,322
- − Insurance
- −$800
- − Repairs & maintenance
- −$768
- − Management
- −$768
- − Depreciation
- −$4,655
- Taxable loss
- −$7,675
- Est. tax savings @ 24.0%
- +$1,842
- After-tax cash flow
- $-2,765/yr
For passive investors: Depreciation is non-cash, so a rental often shows a tax loss while cash-flowing — sheltering income. Rental losses are passive: they offset passive income freely, and up to $25,000/yr can offset ordinary (W-2) income if you actively participate and your MAGI is under $100k (phasing out to $0 by $150k); unused losses carry forward. On sale, claimed depreciation is recaptured at up to 25%, and gains may owe capital-gains tax (a 1031 exchange can defer both). Figures are a year-1 estimate at your 24.0% rate — not tax advice; consult a CPA.
Schools (NCES district)
- District
- Frankton-Lapel Community Schools
- NCES district ID
- 1812880
- Math proficiency
- 39% ▼ -9.00%
- Reading proficiency
- 41% ▼ -10.00%
- Median HH income
- $55,218
- Composite
- 34.99/100
- National rank
- #5050
- State rank
- #131 of 301 in IN
Livability — Frankton
- Score
- 66/100
- State rank
- #300
- US rank
- #12019
Category grades
Schools grade is shown separately in the Schools card above.
Census & demographics
- Census place
- Frankton, IN
- Population (ZIP)
- 2,646
Population outlook (Madison County) Hauer SSP2
- Today (2025)
- 125,800 people
- By 2030
- 122,640 · -2.5%
- By 2040
- 115,420 · -8.3%
- By 2050
- 108,148 · -14.0%
- By 2075
- 91,838 · -27.0%
- By 2100
- 75,670 · -39.8%
Race, ethnicity, and origin ACS 2023
- Neighborhood character
- Predominantly White (94%)
- Race & ethnicity
- White 94% Hispanic / Latino 3% Two or more races 2% Asian 1%
- Common ancestry
- Lithuanian 4% Iranian 1% Romanian 1%
- Foreign-born
- 3% · South Korea, Canada
- Languages at home
- 98% English-only · Spanish 1%
Political lean MEDSL · Madison
- 2024 margin
- Strong R (+26.9) · D 35.6% · R 62.5% · Other 1.9%
- 2008→2024 swing
- -33.5pp toward R · 2008: 6.5pp · 2024: -26.9pp
- All cycles
- 2024: R+26.9 2020: R+22.6 2016: R+25.7 2012: R+4.5 2008: D+6.5
Not yet ingested
- Civics
- —
Market trends
- HPI YoY
- ▲ 16.86%
- Current HPI
- 260.1853
- Rent YoY
- —
- Metro
- —
- State GDP YoY
- ▲ 2.90%
- F500 in state
- 18
Industry mix (Fortune 500 HQ in IN)
| Industry | F500 HQs | Revenue |
|---|---|---|
| Industrial Machinery | 2 | $37B |
|
||
| Healthcare | 1 | $177B |
|
||
| Pharmaceuticals | 1 | $45B |
|
||
| Metals / Steel | 1 | $18B |
|
||
| Agriculture | 1 | $17B |
|
||
| Packaging | 1 | $12B |
|
||
Price history
+144.3% since first listed7 events — show timeline
- 2026-03-04 Listed $160,000 MIBOR as Distributed by MLS Grid
- 2021-10-06 Sold (Public Records) $38,000 Public Records
- 2020-11-12 Sold (Public Records) $40,000 Public Records
- 2004-08-02 Sold (MLS) $16,000 MIBOR as Distributed by MLS Grid
- 2004-03-24 Listed $17,900 MIBOR as Distributed by MLS Grid
- 1999-12-06 Listing Removed — MIBOR as Distributed by MLS Grid
- 1999-06-07 Listed $65,500 MIBOR as Distributed by MLS Grid
Property tax history
+10.0%/yrLatest (2024): $1,322 · +7.3% YoY. Source: county tax records.
Cash-flow waterfall
monthlySold comps — $/sqft
last 12 mo · ≤1 miLoading sold comps…