639 Glen Dale Heights Rd · Shadyside, OH
Flood risk 1/10 · Minimal
- FEMA flood zone
- X (unshaded)
- Chance of flooding over 30 yrs
- 0.0%
- Est. flood insurance / yr
- $507 – $1,088
Fire risk 1/10 · Minimal
- Est. fire insurance / yr
- $787 – $1,461
Heat risk 3/10 · Minor
- Hot days now (above 97°F)
- 7 days/yr
- Hot days in 30 yrs
- 18 days/yr
Wind risk 1/10 · Minimal
- Chance of severe wind over 30 yrs
- —
Air-quality risk 2/10 · Minimal
- Unhealthy air days now
- 0 days/yr
- Unhealthy air days in 30 yrs
- 1 days/yr
Risk factors via First Street. Map © Google.
Why this score? — see what drove the D- grade
The composite is a weighted blend of 9 inputs, each scored 0–100. Each bar is that input's sub-score; the figure is the points it added to the 100-point composite (weight × sub-score).
- Cash flow +15.4/30.0
- DSCR +4.7/10.0
- 1% rule +4.2/10.0
- Condition / age +4.0/5.0
- Livability +3.4/5.0
- Schools +2.7/10.0
- Rent growth +1.3/5.0
- ARV discount +0.5/15.0
- Appreciation +0.0/10.0
$259,000
🖨 Deal sheet 📄 Offer letter ✓ Due diligence
Listing remarks
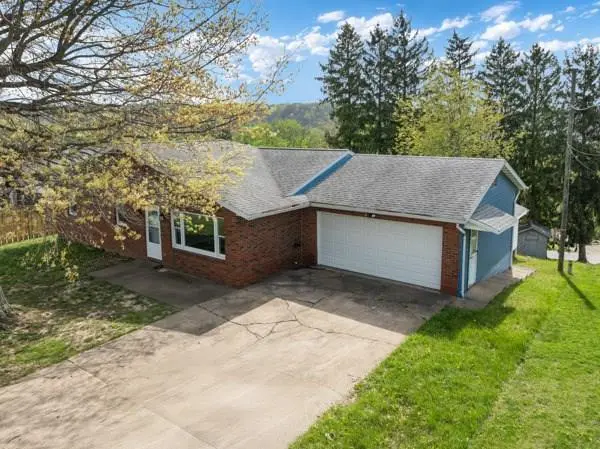
Glen Dale Heights ~ Perched in one of the area's most coveted neighborhoods, this classic brick ranch delivers sweeping Ohio River views alongside the kind of move-in-ready comfort that's hard to find! 4 bedrooms and 3 full bathrooms, and a thoroughly updated interior-new flooring, fresh paint, modern fixtures, refreshed bathrooms, and an updated kitchen-means the work has already been done for you. The layout flows naturally for both quiet evenings at home and larger gatherings, anchored by a generous sized rec room that opens up many possibilities. A FREE 12-month home warranty is included for added peace of mind. Agent-owned
Key facts
- Ohio river views
- Updated interior
- Refreshed bathrooms
Tags
Property features AI
Exterior
- Parking: 2-car garage; Concrete driveway/parking
- Security: Smoke detector(s)
- Utilities: Public water; Public sewer
- Home design: Single-family raised ranch / ranch; 1 story; Residential property
- Construction: Brick and vinyl siding exterior; Shingle roof; Below-grade finished area: 650
- Exterior features: Front porch
Interior
- Kitchen: Range; Refrigerator; Dishwasher not listed
- Bedrooms: Total rooms: 9
- Bathrooms: 3 full bathrooms
- Heating & cooling: Forced air heating (electric); Central air; Ceiling fans
- Interior features: Finished full basement; Electric water heater; Smoke detector(s)
- Laundry & utility: Washer; Dryer
Neighborhood map
What this means for you Summary
Snapshot
- This is a 4-bed/3.0-bath single-family listed at $259k. Condition is rated good.
Deal economics
- At list price, monthly cash flow is $99 ($1k/yr) — positive.
- The deal already cash-flows at list — no discount required.
- To meet the 1% rule (rent ≥ 1% of price), the offer needs to be $239k (7.7% below list).
- Recommended offer: $239k (7.7% below list) — sets the bar for 1% rule.
Location & tenants
- Location reads 68/100 on livability (#576 in OH) — a middle-class / working-renter tenant base. Strengths: cost of living A+, housing A+, crime A; Watch: employment D+, amenities F, commute F.
- Marshall County Schools (suburban): math 28% / reading 36% proficiency, ranked #21 of 55 in WV (top 38%) — families likely to look elsewhere, expect single-tenant / working-renter base with shorter leases.
- Market conditions: Rents falling (-4.9%/yr); 2 comparable units currently listed for rent nearby; high-income renter base; 6 units permitted in Marshall County in 2024 (0 in 5+ unit buildings).
- This rent is only 18% of the median local income ($160k/yr) — well below the 30% rent-burden line; pricing power to push rent on renewal without tenant pushback.
Forward outlook
- Local home prices are declining (-3.0%/yr); year-one equity from $2k of loan paydown is wiped out by about $8k of value loss. Plan a longer hold.
- Marshall County population projected at -19% by 2050 — secular population decline; favor cash flow + early exit over multi-decade hold.
Negotiation context
- It's been on market 37 days — a 3% lower offer ($251k) is reasonable based on typical stale-listing flexibility.
- 2 sale attempts with the ask held roughly flat each time — persistent listings suggest the price (not the market) is what's stuck; bring a comps-based counter.
Questions for the listing agent
- It's been on market 37 days. Have you received any prior offers? Is the seller open to a 8% concession, seller financing, or rate buy-down credit?
- Built in 1972 — when were the roof, HVAC, electrical panel, plumbing, and water heater last replaced?
- Is there a deadline driving the sale (1031 exchange, divorce, estate, relocation)? That informs how much negotiation room exists.
- Schools are A-rated — typically a magnet for longer-tenancy family renters. What's the average tenant stay here, and is there a school-zone premium baked into asking?
- The area grade is low — what's the realistic commute time and amenity access for the typical tenant pool here? Any planned neighborhood developments (good or bad) we should know about?
- What's the average days-on-market for RENTAL listings here right now (not sales)? A rising rental-DOM trend means longer vacancies and softer asking-rent achievability than the comps imply.
- What's the recent tenant-quality profile in this submarket — average credit score on applications, eviction rate, late-payment / NSF rate, and stable-employment percentage? A property-management company in the area should have these aggregated.
- How much new for-sale + rental construction is in the pipeline within 1–3 miles? Heavy new supply typically softens prices + rents 12–24 months out; constrained supply supports both.
Investment metrics
- 1% rule
- 0.92% ✗
- Cap rate
- 6.75%
- Cash-on-cash
- 1.63%
- DSCR
- 1.07
- GRM
- 9.0
CMA / ARV
- ARV (on-the-fly)
- $224,207
- Comps found
- 9
Show comp detail 9 sales within ~0.75 mi
| Address | Dist | Beds/Ba | Sqft | Sold | Price | $/sf | Match |
|---|---|---|---|---|---|---|---|
| 334 Glen Dale Heights Rd | 0.29mi | 4/2.0 | 1,645 (+2%) | 13mo | $240,000 | $146 | 68 |
| 653 Glen Dale Heights Rd | 0.02mi | 3/2.5 (-1) | 1,378 (-15%) | 2mo | $400,000 | $290 | 67 |
| 69 Julie Ct | 0.57mi | 3/2.0 (-1) | 1,618 (+0%) | 7mo | $255,000 | $158 | 59 |
| 778 Little Grave Crk | 0.67mi | 3/2.0 (-1) | 1,564 (-3%) | 8mo | $350,000 | $224 | 48 |
| 3785 Lincoln Ave | 0.68mi | 4/2.0 | 1,528 (-5%) | 17mo | $149,900 | $98 | 41 |
| 3940 Highland Ave | 0.55mi | 3/2.5 (-1) | 1,490 (-8%) | 22mo | $206,500 | $139 | 37 |
| 4390 Central Ave | 0.71mi | 3/2.5 (-1) | 1,806 (+12%) | 9mo | $227,500 | $126 | 33 |
| 4500 Smithfield St | 0.68mi | 3/2.0 (-1) | 1,420 (-12%) | 8mo | $187,000 | $132 | 32 |
| 3709 Lincoln Ave | 0.75mi | 4/2.0 | 1,399 (-13%) | 15mo | $161,000 | $115 | 26 |
Match score weights: distance 35% · size 25% · config 20% · recency 20%. Top-matched comps best support the ARV.
Projected returns pro-forma
-3.0% appreciation · 0.0% rent growth · sell at horizon
- IRR
- -17.1%
- Equity multiple
- 0.41×
- Total profit
- $-42,655
- Equity at exit
- $38,618
- IRR
- -15.9%
- Equity multiple
- 0.23×
- Total profit
- $-55,980
- Equity at exit
- $22,394
Cash invested: $72,520 (down + closing). Projections, not guarantees.
Landlord ↔ Tenant lean methodology
- Overall (STATE)
- 73 Landlord-Friendly
- State Ohio
- 73 Landlord-Friendly · R+6
- County
- — inherits STATE
- City
- — inherits STATE
ZIP-level market 20003
- Rents YoY
- -4.9%
- Price-to-rent
- 9.0×
Monthly cashflow live
- Estimated rent
- $2,391 medium interval (Pro) →
- Mortgage (P&I)
- −$1,358
- Tax est. 1.5%
- −$324 /mo · $3,885/yr
- Insurance
- −$108
- HOA
- −$0
- Vacancy / Maint / Mgmt
- −$502
- Net cashflow
- $99
Break-even live
UW: 25.0% down · 7.5% · 30yr · 1.5% tax · 5.0% vac · 8.0% maint · 8.0% mgmt
Financing live
Cash to close
- Down payment
- $64,750
- Closing costs
- $7,770
- Reserves months
- —
- Total cash needed
- —
Loan-product check · same deal, 3 products live
Conventional
25% down · 7.5% · 30yr
- Down + closing
- —
- Monthly P&I
- —
- Monthly cashflow
- —
- DSCR
- —
- Eligible?
- —
Personal DTI + credit; lowest rate.
DSCR
20% down · 8.5% · 30yr
- Down + closing
- —
- Monthly P&I
- —
- Monthly cashflow
- —
- DSCR
- —
- Eligible?
- —
No personal income docs; deal must DSCR.
Hard money
10% down · 12.0% · 12mo
- Down + closing
- —
- Monthly P&I
- —
- Monthly cashflow
- —
- DSCR
- —
- Eligible?
- —
Short-term bridge; refi at stabilization.
Rent comps 2 comps
| Address | Beds | Baths | Sqft | Rent | $/sqft | DOM | Units | Dist |
|---|---|---|---|---|---|---|---|---|
| 411 Zane St Rm 1 Glen Dale, WV | 3.0 | 1.0 | 1200 | $1,000 | $0.83 | 43d | 1 | 0.88mi |
| 610 Washington Ave Unit 41 Glen Dale, WV | 3.0 | 1.5 | 1800 | $895 | $0.50 | 43d | 1 | 1.13mi |
Listing history 23 events
-
2026-06-19days on market $259,000 Active 37 DOM
-
2026-06-18days on market $259,000 Active 36 DOM
-
2026-06-17days on market $259,000 Active 35 DOM
-
2026-06-16days on market $259,000 Active 34 DOM
-
2026-06-15days on market $259,000 Active 33 DOM
-
2026-06-14days on market $259,000 Active 31 DOM
-
2026-06-12days on market $259,000 Active 30 DOM
-
2026-06-09days on market $259,000 Active 27 DOM
-
2026-06-08days on market $259,000 Active 26 DOM
-
2026-06-07days on market $259,000 Active 25 DOM
-
2026-06-02days on market $259,000 Active 20 DOM
-
2026-06-01days on market $259,000 Active 19 DOM
-
2026-05-31days on market $259,000 Active 18 DOM
-
2026-05-30days on market $259,000 Active 17 DOM
-
2026-05-13$259,000 Active
-
2026-04-30price $259,000
-
2026-04-23price $263,000
-
2026-04-08price $269,500
-
2026-04-03price $272,500
-
2026-03-27price $275,000
-
2026-03-19price $279,900
-
2026-03-05price $285,000
-
2026-02-12$289,500 Active
ⓘ Source: listings_history table (triggers on properties + properties_extension) + one-shot
backfill from property_details.listing_events for pre-trigger history.
Climate risk First Street
- Flood 1/10 Low FEMA zone X (unshaded) · 0% chance over 30 yrs
- Wildfire 1/10 Low
- Heat 3/10 Moderate 7 d/yr ≥97°F today · 18 d/yr by 30 yrs out
- Wind 1/10 Low
- Air quality 2/10 Low 0 unhealthy d/yr today · 1 by 30 yrs out
Nearby sold comps map
Loading sold comps map…
Walkable amenities ~0.75 mi
Loading nearby amenities…
Taxation est. · year 1
- Rental income
- $28,687
- − Mortgage interest
- −$14,508
- − Property taxes
- −$3,885
- − Insurance
- −$1,295
- − Repairs & maintenance
- −$2,295
- − Management
- −$2,295
- − Depreciation
- −$7,535
- Taxable loss
- −$3,126
- Est. tax savings @ 24.0%
- +$750
- After-tax cash flow
- $1,934/yr
For passive investors: Depreciation is non-cash, so a rental often shows a tax loss while cash-flowing — sheltering income. Rental losses are passive: they offset passive income freely, and up to $25,000/yr can offset ordinary (W-2) income if you actively participate and your MAGI is under $100k (phasing out to $0 by $150k); unused losses carry forward. On sale, claimed depreciation is recaptured at up to 25%, and gains may owe capital-gains tax (a 1031 exchange can defer both). Figures are a year-1 estimate at your 24.0% rate — not tax advice; consult a CPA.
Condition & rehab AI · 12 photos
This move-in-ready home offers a classic brick ranch with updated interiors and sweeping Ohio River views. The property is in good condition with no major repairs needed, making it an excellent investment opportunity.
Value-add opportunities
- Both Landscaping and curb appeal improvements — Enhances curb appeal and can attract more buyers
- Both Add a smart home system — Improves convenience and can be a selling point
- Both Add a smart thermostat — Improves energy efficiency and can be a selling point
Renovation cost estimate screening
Value-add ROI direction
- Both Landscaping and curb appeal improvements — Enhances curb appeal and can attract more buyers ↑
- Both Add a smart home system — Improves convenience and can be a selling point ↑
- Both Add a smart thermostat — Improves energy efficiency and can be a selling point ↑
ⓘ Cost ranges are severity-bucket heuristics (US national rule-of-thumb). Get contractor quotes + a written scope before underwriting a rehab budget.
Schools (NCES district)
- District
- Marshall County Schools
- NCES district ID
- 5400750
- Math proficiency
- 28% ▼ -6.00%
- Reading proficiency
- 36% ▼ -4.00%
- Median HH income
- $40,289
- Composite
- 26.91/100
- National rank
- #7086
- State rank
- #21 of 55 in WV
Livability — Shadyside
- Score
- 68/100
- State rank
- #576
- US rank
- #9818
Category grades
Schools grade is shown separately in the Schools card above.
Census & demographics
- County
- District of Columbia
- Metro
- Washington-Arlington-Alexandria, DC-VA-MD-WV
- Population (ZIP)
- 37,482
- Household income
- $159,846
- Rent vs Own
- Severe rent burden
- 1469.0
Population outlook (Marshall County) Hauer SSP2
- Today (2025)
- 30,387 people
- By 2030
- 29,242 · -3.8%
- By 2040
- 26,806 · -11.8%
- By 2050
- 24,627 · -19.0%
- By 2075
- 19,846 · -34.7%
- By 2100
- 15,169 · -50.1%
Race, ethnicity, and origin ACS 2023
- Neighborhood character
- Diverse neighborhood (Simpson 0.56)
- Race & ethnicity
- White 62% Black 23% Hispanic / Latino 6% Two or more races 6% Asian 4%
- Hispanic origin (detail)
- Mexican 2%
- Common ancestry
- Romanian 4% Slovak 3% Italian 3%
- Foreign-born
- 7% · Canada, China, Vietnam
- Languages at home
- 90% English-only · Spanish 4% Other Indo-European 2% French/Haitian/Cajun 1%
Political lean MEDSL · Marshall
- 2024 margin
- Solid R (+50.0) · D 24.1% · R 74.1% · Other 1.8%
- 2008→2024 swing
- -37.5pp toward R · 2008: -12.6pp · 2024: -50.0pp
- All cycles
- 2024: R+50.0 2020: R+49.6 2016: R+51.0 2012: R+28.6 2008: R+12.6
Not yet ingested
- Civics
- —
Market trends
- HPI YoY
- ▼ -783.88%
- Current HPI
- 362.7496
- Rent YoY
- ▼ -4.88%
- Metro
- Washington-Arlington-Alexandria, DC-VA-MD-WV
- State GDP YoY
- ▲ 1.98%
- F500 in state
- 48
Industry mix (Fortune 500 HQ in OH)
| Industry | F500 HQs | Revenue |
|---|---|---|
| Insurance | 3 | $145B |
|
||
| Industrial Machinery | 3 | $49B |
|
||
| Financial Services | 3 | $24B |
|
||
| Consumer Goods | 2 | $93B |
|
||
| Aerospace / Defense | 2 | $47B |
|
||
| Utilities | 2 | $33B |
|
||
Price history
-10.5% since first listed9 events — show timeline
- 2026-05-13 Listed $259,000 WBOR
- 2026-04-30 Price Changed $259,000 WBOR
- 2026-04-23 Price Changed $263,000 WBOR
- 2026-04-08 Price Changed $269,500 WBOR
- 2026-04-03 Price Changed $272,500 WBOR
- 2026-03-27 Price Changed $275,000 WBOR
- 2026-03-19 Price Changed $279,900 WBOR
- 2026-03-05 Price Changed $285,000 WBOR
- 2026-02-12 Listed $289,500 WBOR
Cash-flow waterfall
monthlySold comps — $/sqft
last 12 mo · ≤1 miLoading sold comps…