 Triplex
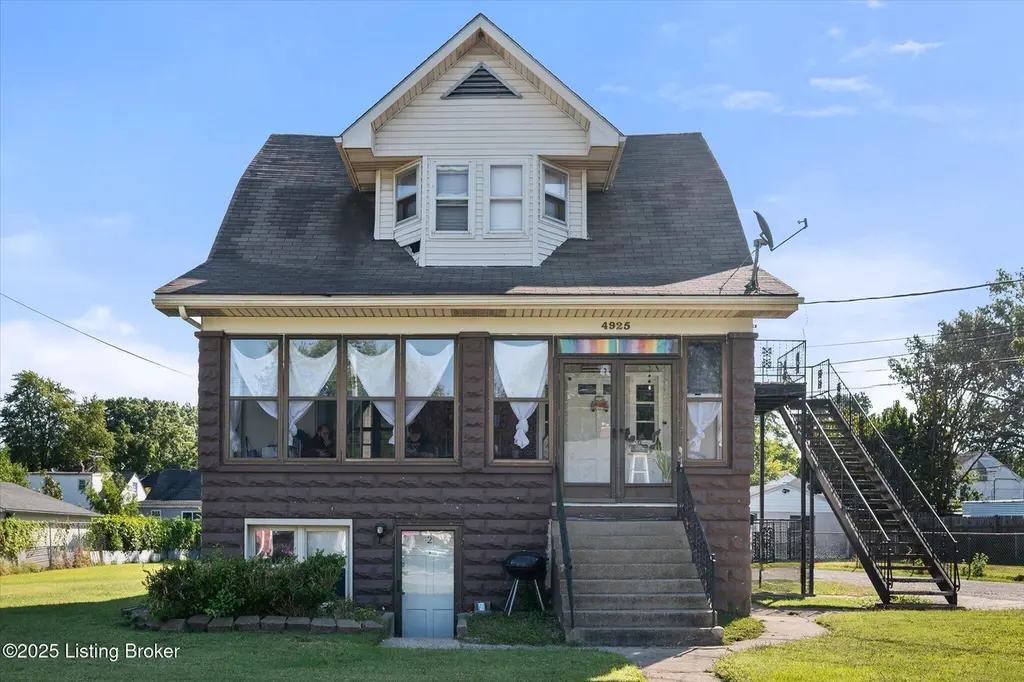
4925 Southside Dr · Louisville, KY
Flood risk 1/10 · Minimal
- FEMA flood zone
- X (unshaded)
- Chance of flooding over 30 yrs
- 0.0%
- Est. flood insurance / yr
- $473 – $860
Fire risk 1/10 · Minimal
- Est. fire insurance / yr
- $839 – $1,559
Heat risk 5/10 · Moderate
- Hot days now (above 105°F)
- 7 days/yr
- Hot days in 30 yrs
- 19 days/yr
Wind risk 2/10 · Minimal
- Chance of severe wind over 30 yrs
- 2.0%
Air-quality risk 2/10 · Minimal
- Unhealthy air days now
- 1 days/yr
- Unhealthy air days in 30 yrs
- 3 days/yr
Risk factors via First Street. Map © Google.
Why this score? — see what drove the C- grade
The composite is a weighted blend of 9 inputs, each scored 0–100. Each bar is that input's sub-score; the figure is the points it added to the 100-point composite (weight × sub-score).
- Cash flow +22.3/30.0
- ARV discount +7.5/15.0
- DSCR +7.2/10.0
- 1% rule +5.6/10.0
- Livability +3.2/5.0
- Rent growth +3.0/5.0
- Condition / age +2.5/5.0
- Schools +2.3/10.0
- Appreciation +0.0/10.0
$340,000
🖨 Deal sheet (PDF) 📄 Offer letter ✓ Due diligence
Multi-family units
County records classify this as Multi-Family (5+ Unit). Listing-text estimate: 3 units. estimate disagrees with records
5+ unit building — per-unit beds/baths from public records are typically unavailable; the breakdown below (if shown) is an estimate from the listing text.
Listing remarks MLS
Attention, Investors! 5 Apartments and Additional Next-Door Lot, Currently Collecting More than $3000 a month in rent (but tons of potential to increase cash flow), Turnkey investment property. (Being sold with parcel 059B01600000) Long term tenants. Outstanding Value for the area. 9 All 1 bedroom/1 bath, Owner Pays All Utilities (Gas and Electric averaging $300 a month Water and Sewer $100 a month) Parking for 9 cars. 2 apartments in the basement, two apartments on the first floor, 1 apartment on the 2nd floor. Each unit has one living room, one kitchen, one bedroom and one bath. Note the basement units are open in the kitchen and living room. All apartments are leased. Need 48 hours for showings.
Key facts
- Outdoor amenities
- Additional parking
- Huge lot
Tags
Property features AI
Finance
- Other: Located in subdivision ST LEO PLACE; Directions: Watterson to S. 3rd Street, left on Tenny, right on Southside
- Financial info: Multiple rental units: total units per level — First level: 2 units (rent listed), Second level: 1 unit (rent listed), Basement level: 2 units (rent listed); First level rent total listed for units: 1763; Second level rent listed for unit: 635; Basement level rent total listed for units: 1630
- HOA & community: No association fee
Exterior
- Parking: 4 parking spaces (not covered)
- Utilities: Electricity connected; Owner pays electric, gas, water, sewer, and trash removal; Tenant pays cable
- Home design: Apartment property type; Architectural style: Other
- Construction: Built in 1906; Vinyl siding; Shingle roof
- Exterior features: No notable exterior features listed
Interior
- Kitchen: Second level: kitchen with range and refrigerator; First level: 2 kitchens each with range and refrigerator; Basement level: 2 kitchens each with range and refrigerator
- Bedrooms: Total of 8 bedrooms; Second level contains 2 bedrooms; First level contains 4 bedrooms; Basement level contains 2 bedrooms
- Bathrooms: Second level: 1 full bath; First level: 2 full baths; Basement level: 2 full baths
- Heating & cooling: Central air; One furnace; One HVAC unit
- Interior features: Basement present
Neighborhood map
What this means for you Summary
Snapshot
- This is a 3 × 3-bed/?-bath units multifamily listed at $340k.
Deal economics
- At list price, monthly cash flow is $563 ($7k/yr) — positive. Per door: $188/mo.
- The deal already cash-flows at list — no discount required.
- Meets the 1% rule at list price ($4k rent vs $340k).
- Recommended offer: $335k (1.5% below list) — sets the bar for market timing.
- Cap rate 8.3% vs local median 5.0% in Louisville — top-decile yield for the area; either an underpriced asset or a hidden risk that comps aren't pricing in. Stress-test before assuming the spread holds.
Location & tenants
- Location reads 63/100 on livability (#333 in KY) — a middle-class / working-renter tenant base. Strengths: cost of living A+, housing A+; Watch: employment C-, health & safety D+, crime F.
- Jefferson County (urban): math 19% / reading 35% proficiency, ranked #121 of 165 in KY (top 73%) — low school quality limits family demand, transient renter base, plan for 1-2y turnover.
- Zoned schools: Rutherford Elementary (math 2% / reading 17%, grade F, #648 of 676 statewide, top 98%, 455 students, 73% FRL); Frederick Law Olmsted Academy North (math 5% / reading 15%, grade F, #217 of 217 statewide, top 100%, 510 students, 74% FRL); Iroquois High (math 12% / reading 8%, grade F, #245 of 254 statewide, top 97%, 1,090 students, 74% FRL) — zoned schools average 74% FRL vs 56% district-wide (18 pts higher); higher-poverty schools than district average — tighter screening recommended.
- Zoned-school proficiency averages 10% at this address vs 27% district-wide (-17 pts) — the specific schools serving this property underperform the Jefferson County average; the district grade overstates school quality for this exact location.
- Market conditions: Rents rising (+1.9%/yr); 247 active listings in the ZIP; 2,836 units permitted in Jefferson County in 2024 (1,558 in 5+ unit buildings).
- At $3,614/mo this rent would consume 79% of the median local household income ($55k/yr) (locally 2054% of renters already pay >50% of income on rent) — very limited rent-growth headroom before tenants either downsize or default.
Forward outlook
- Local home prices are declining (-3.0%/yr); year-one equity from $2k of loan paydown is wiped out by about $10k of value loss. Plan a longer hold.
- Jefferson County population projected at +13% by 2050 — modest demand growth; plan on rents tracking national, not racing it.
Negotiation context
- It's been on market 19 days — a 2% lower offer ($335k) is reasonable based on typical stale-listing flexibility.
- 3 sale attempts since 5y ago with the ask held roughly flat each time — persistent listings suggest the price (not the market) is what's stuck; bring a comps-based counter.
Risks & watch-outs
- Watch-outs: built in 1906 — expect roof / HVAC / electrical / plumbing capex.
- Climate carrying-cost: extreme-heat days projected 7→19/yr by 2055 (HVAC capex compounding) — expect insurance premiums to compound above CPI over the hold.
Questions for the listing agent
- Can we see the unit-by-unit rent roll, current vacancy, and any below-market leases? What's the average tenancy length?
- What capital expenditures (roof, boiler, parking lot, exteriors) have been made in the last 5 years, and what's planned in the next 2?
- Built in 1906 — when were the roof, HVAC, electrical panel, plumbing, and water heater last replaced?
- Is there a deadline driving the sale (1031 exchange, divorce, estate, relocation)? That informs how much negotiation room exists.
- Schools are D-rated, which usually means shorter tenancies and higher turnover. Who's the typical renter profile here, and what's been the actual vacancy rate?
- Crime grade is F in this area — have there been break-ins, vandalism, or insurance claims at this property in the last 3 years? What carrier currently insures it and at what premium?
- What's the average days-on-market for RENTAL listings here right now (not sales)? A rising rental-DOM trend means longer vacancies and softer asking-rent achievability than the comps imply.
- What's the recent tenant-quality profile in this submarket — average credit score on applications, eviction rate, late-payment / NSF rate, and stable-employment percentage? A property-management company in the area should have these aggregated.
- How much new apartment / multifamily construction is in the pipeline within 1–3 miles? Heavy new supply (>2% of stock underway) typically softens rents 12–24 months out; light construction supports rent growth.
Investment metrics
- 1% rule
- 1.06% ✓
- Cap rate
- 8.28%
- Cash-on-cash
- 7.10%
- DSCR
- 1.32
- GRM
- 7.8
CMA / ARV
No comps found within radius.
Projected returns pro-forma
-3.0% appreciation · 1.89% rent growth · sell at horizon
- IRR
- -6.7%
- Equity multiple
- 0.76×
- Total profit
- $-23,217
- Equity at exit
- $50,695
- IRR
- 1.6%
- Equity multiple
- 1.11×
- Total profit
- $10,005
- Equity at exit
- $29,397
Cash invested: $95,200 (down + closing). Projections, not guarantees.
Landlord ↔ Tenant lean methodology
- Overall (STATE)
- 83 Strongly Landlord-Friendly
- State Kentucky
- 83 Strongly Landlord-Friendly · R+16
- County
- — inherits STATE
- City
- — inherits STATE
ZIP-level market 40214
- Rents YoY
- 1.9%
- Active inventory
- 247
- Price-to-rent
- 23.5×
Monthly cashflow live
- Estimated rent
- $3,614 high interval (Pro) →
- Mortgage (P&I)
- −$1,783
- Tax from tax record
- −$368 /mo · $4,410/yr
- Insurance
- −$142
- HOA
- −$0
- Vacancy / Maint / Mgmt
- −$759
- Net cashflow
- $563
Break-even live
Sensitivity live
| Price | -10% $755 | -5% $659 | +0% $563 | +5% $467 | +10% $370 |
|---|---|---|---|---|---|
| Rent | -10% $277 | -5% $420 | +0% $563 | +5% $706 | +10% $848 |
| Rate | -1.0pp $734 | -0.5pp $649 | base $563 | +0.5pp $475 | +1.0pp $385 |
3-unit breakdown (identical units grouped — click to expand)
| Units | Beds | Baths | Est. rent |
|---|---|---|---|
| 3× units | 3 | — | $3,615 |
| #1 | 3 | — | $1,205 |
| #2 | 3 | — | $1,205 |
| #3 | 3 | — | $1,205 |
| Total (3 units) | $3,614 | ||
UW: 25.0% down · 7.5% · 30yr · 1.5% tax · 5.0% vac · 8.0% maint · 8.0% mgmt
Financing live
Cash to close
- Down payment
- $85,000
- Closing costs
- $10,200
- Reserves months
- —
- Total cash needed
- —
Loan-product check · same deal, 3 products live
Conventional
25% down · 7.5% · 30yr
- Down + closing
- —
- Monthly P&I
- —
- Monthly cashflow
- —
- DSCR
- —
- Eligible?
- —
Personal DTI + credit; lowest rate.
DSCR
20% down · 8.5% · 30yr
- Down + closing
- —
- Monthly P&I
- —
- Monthly cashflow
- —
- DSCR
- —
- Eligible?
- —
No personal income docs; deal must DSCR.
Hard money
10% down · 12.0% · 12mo
- Down + closing
- —
- Monthly P&I
- —
- Monthly cashflow
- —
- DSCR
- —
- Eligible?
- —
Short-term bridge; refi at stabilization.
Listing history 21 events
-
2026-06-21days on market $340,000 Active 19 DOM
-
2026-06-18days on market $340,000 Active 16 DOM
-
2026-06-17days on market $340,000 Active 15 DOM
-
2026-06-16days on market $340,000 Active 14 DOM
-
2026-06-15days on market $340,000 Active 13 DOM
-
2026-06-13days on market $340,000 Active 11 DOM
-
2026-06-10days on market $340,000 Active 8 DOM
-
2026-06-09days on market $340,000 Active 7 DOM
-
2026-06-08days on market $340,000 Active 6 DOM
-
2026-06-07days on market $340,000 Active 5 DOM
-
2026-06-02pricedays on market $340,000 Active 1 DOM
-
2026-06-01days on market $350,000 Active 248 DOM
-
2026-05-31days on market $350,000 Active 247 DOM
-
2025-09-24$350,000 Active
-
2024-06-01historical $750
-
2024-02-22$750
-
2022-04-07soldstatus $350,000
-
2022-04-05soldstatus $350,000 Closed 707-char remark
Show marketing remark (707 chars)
Attention, Investors! 5 Apartments and Additional Next-Door Lot, Currently Collecting More than $3000 a month in rent (but tons of potential to increase cash flow), Turnkey investment property. (Being sold with parcel 059B01600000) Long term tenants. Outstanding Value for the area. 9 All 1 bedroom/1 bath, Owner Pays All Utilities (Gas and Electric averaging $300 a month Water and Sewer $100 a month) Parking for 9 cars. 2 apartments in the basement, two apartments on the first floor, 1 apartment on the 2nd floor. Each unit has one living room, one kitchen, one bedroom and one bath. Note the basement units are open in the kitchen and living room. All apartments are leased. Need 48 hours for showings.
-
2022-03-25status Pending 707-char remark
Show marketing remark (707 chars)
Attention, Investors! 5 Apartments and Additional Next-Door Lot, Currently Collecting More than $3000 a month in rent (but tons of potential to increase cash flow), Turnkey investment property. (Being sold with parcel 059B01600000) Long term tenants. Outstanding Value for the area. 9 All 1 bedroom/1 bath, Owner Pays All Utilities (Gas and Electric averaging $300 a month Water and Sewer $100 a month) Parking for 9 cars. 2 apartments in the basement, two apartments on the first floor, 1 apartment on the 2nd floor. Each unit has one living room, one kitchen, one bedroom and one bath. Note the basement units are open in the kitchen and living room. All apartments are leased. Need 48 hours for showings.
-
2022-02-23historical Active Under Contract 707-char remark
Show marketing remark (707 chars)
Attention, Investors! 5 Apartments and Additional Next-Door Lot, Currently Collecting More than $3000 a month in rent (but tons of potential to increase cash flow), Turnkey investment property. (Being sold with parcel 059B01600000) Long term tenants. Outstanding Value for the area. 9 All 1 bedroom/1 bath, Owner Pays All Utilities (Gas and Electric averaging $300 a month Water and Sewer $100 a month) Parking for 9 cars. 2 apartments in the basement, two apartments on the first floor, 1 apartment on the 2nd floor. Each unit has one living room, one kitchen, one bedroom and one bath. Note the basement units are open in the kitchen and living room. All apartments are leased. Need 48 hours for showings.
-
2021-09-20$350,000 Active 707-char remark
Show marketing remark (707 chars)
Attention, Investors! 5 Apartments and Additional Next-Door Lot, Currently Collecting More than $3000 a month in rent (but tons of potential to increase cash flow), Turnkey investment property. (Being sold with parcel 059B01600000) Long term tenants. Outstanding Value for the area. 9 All 1 bedroom/1 bath, Owner Pays All Utilities (Gas and Electric averaging $300 a month Water and Sewer $100 a month) Parking for 9 cars. 2 apartments in the basement, two apartments on the first floor, 1 apartment on the 2nd floor. Each unit has one living room, one kitchen, one bedroom and one bath. Note the basement units are open in the kitchen and living room. All apartments are leased. Need 48 hours for showings.
ⓘ Source: listings_history table (triggers on properties + properties_extension) + one-shot
backfill from property_details.listing_events for pre-trigger history.
Tax reassessment forecast KY · Resets to sale price
- Current annual tax
- $4,410 · $368/mo
- Projected year-2 tax
- $4,410 · $368/mo
- Expected delta
- $0/yr ($0/mo · 0.0%)
ⓘ Screening estimate from a state-policy table — verify with the county assessor before closing.
Climate risk First Street
- Flood 1/10 Low FEMA zone X (unshaded) · 0% chance over 30 yrs
- Wildfire 1/10 Low
- Heat 5/10 Major 7 d/yr ≥105°F today · 19 d/yr by 30 yrs out
- Wind 2/10 Low 2% chance of damaging wind over 30 yrs
- Air quality 2/10 Low 1 unhealthy d/yr today · 3 by 30 yrs out
Nearby sold comps map
Loading sold comps map…
Walkable amenities ~0.75 mi
Loading nearby amenities…
Taxation est. · year 1
- Rental income
- $43,368
- − Mortgage interest
- −$19,045
- − Property taxes
- −$4,410
- − Insurance
- −$1,700
- − Repairs & maintenance
- −$3,469
- − Management
- −$3,469
- − Depreciation
- −$9,891
- Taxable income
- $1,383
- Est. tax owed @ 24.0%
- −$332
- After-tax cash flow
- $6,423/yr
For passive investors: Depreciation is non-cash, so a rental often shows a tax loss while cash-flowing — sheltering income. Rental losses are passive: they offset passive income freely, and up to $25,000/yr can offset ordinary (W-2) income if you actively participate and your MAGI is under $100k (phasing out to $0 by $150k); unused losses carry forward. On sale, claimed depreciation is recaptured at up to 25%, and gains may owe capital-gains tax (a 1031 exchange can defer both). Figures are a year-1 estimate at your 24.0% rate — not tax advice; consult a CPA.
Schools (NCES district)
- District
- Jefferson County
- NCES district ID
- 2102990
- Math proficiency
- 19% ▼ -17.00%
- Reading proficiency
- 35% ▼ -11.00%
- Median HH income
- $47,885
- Composite
- 23.45/100
- National rank
- #7884
- State rank
- #121 of 165 in KY
Livability — Louisville
- Score
- 63/100
- State rank
- #333
- US rank
- #15887
Category grades
Schools grade is shown separately in the Schools card above.
Census & demographics
- Census place
- Louisville, KY
- County
- Jefferson County · 790,184 people
- City population
- 769,292
- Metro
- Louisville/Jefferson County, KY-IN
- Population (ZIP)
- 45,405
- Household income
- $54,931
- Rent vs Own
- Severe rent burden
- 2054.0
Population outlook (Jefferson County) Hauer SSP2
- Today (2025)
- 823,112 people
- By 2030
- 849,343 · +3.2%
- By 2040
- 895,696 · +8.8%
- By 2050
- 933,630 · +13.4%
- By 2075
- 1,028,262 · +24.9%
- By 2100
- 1,072,675 · +30.3%
Race, ethnicity, and origin ACS 2023
- Neighborhood character
- Diverse neighborhood (Simpson 0.67)
- Race & ethnicity
- White 51% Black 22% Hispanic / Latino 14% Two or more races 12% Asian 7%
- Hispanic origin (detail)
- Mexican 3% Cuban 6%
- Common ancestry
- Slovak 1% Lithuanian 1% Serbian 1%
- Foreign-born
- 21% · Canada, Vietnam, Philippines
- Languages at home
- 74% English-only · Spanish 12% Vietnamese 3% Other Asian/Pacific 2%
Political lean MEDSL · Jefferson
- 2024 margin
- D (+16.6) · D 57.4% · R 40.9% · Other 1.7%
- 2008→2024 swing
- +4.5pp toward D · 2008: 12.0pp · 2024: 16.6pp
- All cycles
- 2024: D+16.6 2020: D+20.1 2016: D+13.3 2012: D+11.1 2008: D+12.0
Not yet ingested
- Civics
- —
Market trends
- HPI YoY
- ▼ -235.43%
- Current HPI
- 237.4062
- Rent YoY
- ▲ 1.89%
- Metro
- Louisville/Jefferson County, KY-IN
- State GDP YoY
- ▲ 1.81%
- F500 in state
- 4
Industry mix (Fortune 500 HQ in KY)
| Industry | F500 HQs | Revenue |
|---|---|---|
| Healthcare | 1 | $118B |
|
||
| Food / Beverage | 1 | $7B |
|
||
Price history
+0.0% since first listed8 events — show timeline
- 2025-09-24 Listed $350,000 Metro Search MLS
- 2024-06-01 Rental Removed $750 MSMLS
- 2024-02-22 Listed for Rent $750 MSMLS
- 2022-04-07 Sold (Public Records) $350,000 Public Records
- 2022-04-05 Sold (MLS) $350,000 Metro Search MLS
- 2022-03-25 Pending — Metro Search MLS
- 2022-02-23 Contingent — Metro Search MLS
- 2021-09-20 Listed $350,000 Metro Search MLS
Property tax history
+10.4%/yrLatest (2025): $4,410 · -1.9% YoY. Source: county tax records.
Cash-flow waterfall
monthlySold comps — $/sqft
last 12 mo · ≤1 miLoading sold comps…