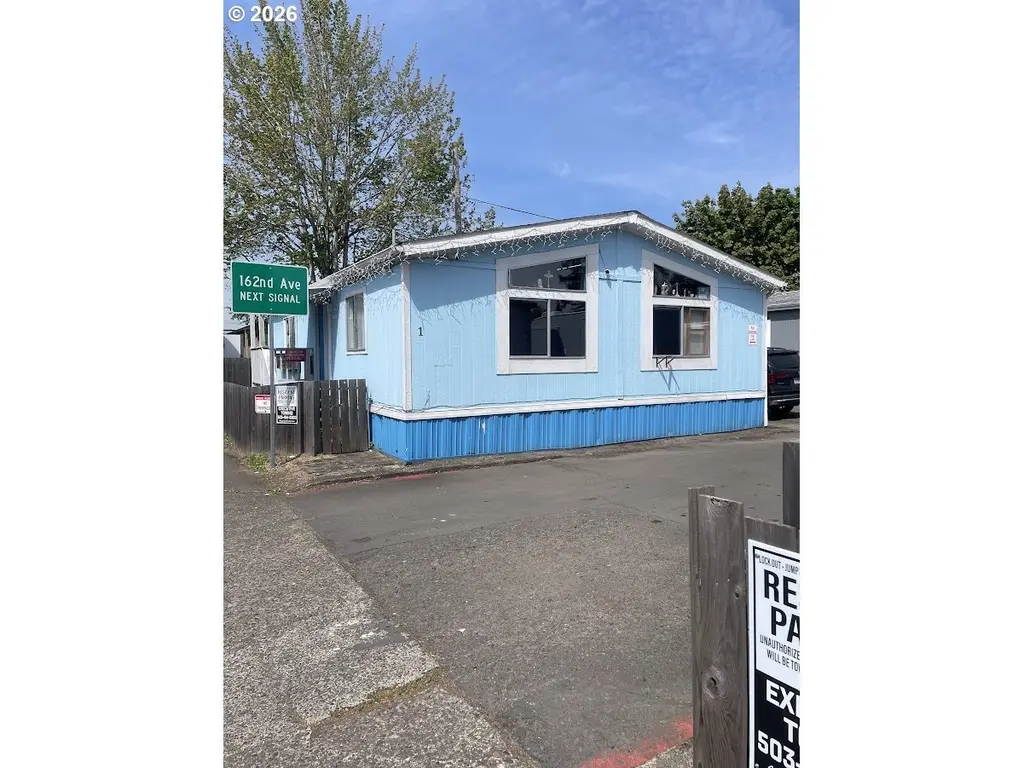
16415 SE Stark St #1 · Gresham, OR
Flood risk 1/10 · Minimal
- FEMA flood zone
- X (unshaded)
- Chance of flooding over 30 yrs
- 0.0%
- Est. flood insurance / yr
- $507 – $1,088
Fire risk 1/10 · Minimal
- Est. fire insurance / yr
- $498 – $926
Heat risk 3/10 · Minor
- Hot days now (above 92°F)
- 7 days/yr
- Hot days in 30 yrs
- 15 days/yr
Wind risk 1/10 · Minimal
- Chance of severe wind over 30 yrs
- —
Air-quality risk 10/10 · Severe
- Unhealthy air days now
- 23 days/yr
- Unhealthy air days in 30 yrs
- 27 days/yr
Risk factors via First Street. Map © Google.
Why this score? — see what drove the B- grade
The composite is a weighted blend of 9 inputs, each scored 0–100. Each bar is that input's sub-score; the figure is the points it added to the 100-point composite (weight × sub-score).
- Cash flow +30.0/30.0
- 1% rule +10.0/10.0
- DSCR +10.0/10.0
- ARV discount +7.5/15.0
- Livability +4.0/5.0
- Rent growth +2.7/5.0
- Schools +2.7/10.0
- Condition / age +2.5/5.0
- Appreciation +0.0/10.0
$85,000
🖨 Deal sheet 📄 Offer letter ✓ Due diligence
Listing remarks
Manufactured home in good conditions 2 Bedrooms and 2 full baths.
Key facts
- Built 1991
- Listed 28 days
Property features AI
Finance
- Other: Property type: Residential — Manufactured Home in Park; Main level area approximately 1,080; Lot size range: 0K to 2,999 SqFt
- HOA & community: Land lease in place (monthly lot rent $725); Land lease expires September 30, 2026; Not a senior community
Exterior
- Parking: Driveway; Carport
- Utilities: Public water; Public sewer; Electric service
- Home design: Manufactured home in park; Single-story (main level living); Not attached; Resale; No view
- Construction: Built in 1991; Foundation: Other; Manufacturer: SKYLINE
- Exterior features: T-111 siding; Shingle roof; Paved road access
Interior
- Kitchen: Free-standing range; Free-standing refrigerator
- Bedrooms: Primary bedroom (main level); 2nd bedroom (main level)
- Bathrooms: 2 full bathrooms (both on main level)
- Heating & cooling: Ductless heating; Mini-split cooling; Electric hot water
- Interior features: Basement: Other; Great room; Family room; Dining room; Living room
Neighborhood map
What this means for you Summary
Snapshot
- This is a 2-bed/1.0-bath manufactured listed at $85k.
Deal economics
- At list price, monthly cash flow is $661 ($8k/yr) — positive.
- The deal already cash-flows at list — no discount required.
- Meets the 1% rule at list price ($1k rent vs $85k).
- Recommended offer: $84k (1.5% below list) — sets the bar for market timing.
- Cap rate 15.6% vs local median 2.8% in Gresham — top-decile yield for the area; either an underpriced asset or a hidden risk that comps aren't pricing in. Stress-test before assuming the spread holds.
Location & tenants
- Location reads 81/100 on livability (#51 in OR, #1,537 nationally) — a professional / high-income tenant draw. Strengths: amenities A+, commute A+, health & safety A+; Watch: cost of living D, crime D-.
- Reynolds SD 7 (suburban): math 21% / reading 36% proficiency, ranked #162 of 183 in OR (top 88%) — low school quality limits family demand, transient renter base, plan for 1-2y turnover; 66% free/reduced lunch — lower-income household profile, screen leases tightly.
- Zoned schools: Wilkes Elementary School (443 students, 100% FRL); Reynolds High School (2,474 students, 67% FRL) — zoned schools average 83% FRL vs 66% district-wide (18 pts higher); higher-poverty schools than district average — tighter screening recommended.
- Market conditions: Rents flat; 153 active listings in the ZIP; 40 comparable units currently listed for rent nearby; rentals at typical pace (median 24d on market — plan ~3-4 weeks tenant-placement turnaround); 2,041 units permitted in Multnomah County in 2024 (905 in 5+ unit buildings).
Forward outlook
- Local home prices are declining (-3.0%/yr); year-one equity from $588 of loan paydown is wiped out by about $3k of value loss. Plan a longer hold.
- Multnomah County population projected at +33% by 2050 — long-run rental-demand tailwind backs the buy-and-hold thesis.
- At projected returns (-3.0% appreciation + 1.0% rent growth), your $24k cash investment doubles in ~4 years — after that, you're playing with house money.
Negotiation context
- It's been on market 28 days — a 2% lower offer ($84k) is reasonable based on typical stale-listing flexibility.
Questions for the listing agent
- Is there a deadline driving the sale (1031 exchange, divorce, estate, relocation)? That informs how much negotiation room exists.
- Crime grade is D in this area — have there been break-ins, vandalism, or insurance claims at this property in the last 3 years? What carrier currently insures it and at what premium?
- What's the average days-on-market for RENTAL listings here right now (not sales)? A rising rental-DOM trend means longer vacancies and softer asking-rent achievability than the comps imply.
- What's the recent tenant-quality profile in this submarket — average credit score on applications, eviction rate, late-payment / NSF rate, and stable-employment percentage? A property-management company in the area should have these aggregated.
- How much new for-sale + rental construction is in the pipeline within 1–3 miles? Heavy new supply typically softens prices + rents 12–24 months out; constrained supply supports both.
Investment metrics
- 1% rule
- 1.75% ✓
- Cap rate
- 15.63%
- Cash-on-cash
- 33.35%
- DSCR
- 2.48
- GRM
- 4.8
CMA / ARV
- ARV (on-the-fly)
- $54,000
- Comps found
- 1
Show comp detail 1 sale within ~0.75 mi
| Address | Dist | Beds/Ba | Sqft | Sold | Price | $/sf | Match |
|---|---|---|---|---|---|---|---|
| 17442 NE Glisan St #2 | 0.68mi | 2/2.0 | 1,152 (+7%) | 2mo | $58,000 | $50 | 52 |
Match score weights: distance 35% · size 25% · config 20% · recency 20%. Top-matched comps best support the ARV.
Projected returns pro-forma
-3.0% appreciation · 0.96% rent growth · sell at horizon
- IRR
- 26.4%
- Equity multiple
- 2.06×
- Total profit
- $25,338
- Equity at exit
- $12,674
- IRR
- 32.8%
- Equity multiple
- 3.71×
- Total profit
- $64,422
- Equity at exit
- $7,349
Cash invested: $23,800 (down + closing). Projections, not guarantees.
Landlord ↔ Tenant lean methodology
- Overall (STATE)
- 28 Tenant-Leaning
- State Oregon
- 28 Tenant-Leaning · D+6
- County
- — inherits STATE
- City
- — inherits STATE
ZIP-level market 97233
- Rents YoY
- 1.0%
- Active inventory
- 153
- Price-to-rent
- 4.8×
Monthly cashflow live
- Estimated rent
- $1,490 high interval (Pro) →
- Mortgage (P&I)
- −$446
- Tax from tax record
- −$34 /mo · $409/yr
- Insurance
- −$35
- HOA
- −$0
- Vacancy / Maint / Mgmt
- −$313
- Net cashflow
- $661
Break-even live
UW: 25.0% down · 7.5% · 30yr · 1.5% tax · 5.0% vac · 8.0% maint · 8.0% mgmt
Financing live
Cash to close
- Down payment
- $21,250
- Closing costs
- $2,550
- Reserves months
- —
- Total cash needed
- —
Loan-product check · same deal, 3 products live
Conventional
25% down · 7.5% · 30yr
- Down + closing
- —
- Monthly P&I
- —
- Monthly cashflow
- —
- DSCR
- —
- Eligible?
- —
Personal DTI + credit; lowest rate.
DSCR
20% down · 8.5% · 30yr
- Down + closing
- —
- Monthly P&I
- —
- Monthly cashflow
- —
- DSCR
- —
- Eligible?
- —
No personal income docs; deal must DSCR.
Hard money
10% down · 12.0% · 12mo
- Down + closing
- —
- Monthly P&I
- —
- Monthly cashflow
- —
- DSCR
- —
- Eligible?
- —
Short-term bridge; refi at stabilization.
Rent comps 40 comps
| Address | Beds | Baths | Sqft | Rent | $/sqft | DOM | Units | Dist |
|---|---|---|---|---|---|---|---|---|
| 16360 SE Stark St Unit 4 Portland, OR | 2.0 | 1.0 | 800 | $1,499 | $1.87 | 43d | 1 | 0.03mi |
| 16360 SE Stark St Unit 3 Portland, OR | 2.0 | 1.0 | 800 | $1,599 | $2.00 | 10d | 1 | 0.03mi |
| 650 SE 162nd Ave Portland, OR | 1.0–2.0 | 1.0 | 745 | $1,349 | $1.81 | 2d | 9 | 0.12mi |
| 235 SE 165th Ave Portland, OR | 2.0 | 1.0 | 852 | $1,412 | $1.66 | 3d | 5 | 0.13mi |
| 906 SE 165th Ave Portland, OR | 3.0 | 2.0 | 1088 | $2,695 | $2.48 | 2d | 1 | 0.19mi |
| 473 SE 169th Ave Portland, OR | 2.0–3.0 | 2.0 | 1006 | $1,495 | $1.49 | 14d | 5 | 0.21mi |
| 16124 SE Alder St Apt 4 Portland, OR | 1.0 | 1.0 | 750 | $1,100 | $1.47 | 43d | 1 | 0.22mi |
| 16836 SE Stark St Unit 104 Portland, OR | 2.0 | 1.0 | 900 | $1,300 | $1.44 | 23d | 1 | 0.22mi |
| 16836 SE Stark St Apt 107 Portland, OR | 2.0 | 1.0 | 900 | $1,350 | $1.50 | 11d | 1 | 0.22mi |
| 16836 SE Stark St Unit 102 Portland, OR | 2.0 | 1.5 | 900 | $1,375 | $1.53 | 14d | 1 | 0.22mi |
| 203 SE 162nd Ave Unit 01 Portland, OR | 3.0 | 1.0 | 925 | $1,500 | $1.62 | 7d | 1 | 0.22mi |
| 16025 SE Stark St Portland, OR | 2.0 | 1.0 | 862 | $1,482 | $1.72 | 23d | 1 | 0.23mi |
| 312-318 SE 160th Ave Unit 312-04 Portland, OR | 2.0 | 1.0 | 900 | $1,350 | $1.50 | 2d | 1 | 0.24mi |
| 312-318 SE 160th Ave Unit 318-06 Portland, OR | 2.0 | 1.0 | 900 | $1,450 | $1.61 | 43d | 1 | 0.24mi |
| 16503 E Burnside St Portland, OR | 1.0–3.0 | 1.0 | 797 | $1,195 | $1.50 | 43d | 1 | 0.24mi |
| 16964 SE Stark St Portland, OR | 2.0 | 1.5 | 945 | $1,250 | $1.32 | 43d | 1 | 0.26mi |
| 400 SE 169th Ave Unit 402 Portland, OR | 2.0 | 1.0 | 1000 | $1,695 | $1.70 | 43d | 1 | 0.26mi |
| 10 NE 162nd Ave Portland, OR | 1.0–2.0 | 1.0 | 950 | $1,325 | $1.39 | 11d | 5 | 0.27mi |
| 10 NE 162nd Ave Apt 32 Portland, OR | 2.0 | 1.0 | 1200 | $1,350 | $1.12 | 43d | 1 | 0.27mi |
| 533-615 SE 160th Ave Unit 601 Portland, OR | 2.0 | 1.0 | 780 | $1,350 | $1.73 | 43d | 1 | 0.27mi |
| 533-615 SE 160th Ave Unit 551 Portland, OR | 3.0 | 1.0 | 928 | $1,500 | $1.62 | 43d | 1 | 0.27mi |
| 16000 SE Alder St Unit 19 Portland, OR | 2.0 | 1.0 | 780 | $1,350 | $1.73 | 23d | 1 | 0.29mi |
| 16000 SE Alder St Apt 28 Portland, OR | 3.0 | 1.0 | 1000 | $1,475 | $1.48 | 43d | 1 | 0.29mi |
| 23 NE 162nd Ave Unit 210 Portland, OR | 2.0 | 1.0 | 850 | $1,375 | $1.62 | 12d | 1 | 0.29mi |
| 100 NE 162nd Ave Unit D Portland, OR | 2.0 | 1.0 | 845 | $1,300 | $1.54 | 14d | 1 | 0.30mi |
| 247 SE 160th Ave Portland, OR | 2.0 | 1.0 | 853 | $1,227 | $1.44 | 20d | 1 | 0.30mi |
| 100 NE 162nd Ave Unit K Portland, OR | 2.0 | 1.0 | 845 | $1,350 | $1.60 | 12d | 1 | 0.30mi |
| 100 SE 160th Ave Portland, OR | 1.0 | 1.0 | 850 | $1,250 | $1.47 | 14d | 1 | 0.31mi |
| 15855 SE Washington Ct Portland, OR | 3.0 | 1.5 | 1160 | $2,295 | $1.98 | 23d | 1 | 0.31mi |
| 15847 SE Stark St Portland, OR | 1.0–2.0 | 1.0 | 750 | $1,295 | $1.73 | 43d | 4 | 0.31mi |
| 15841 SE Washington Ct Portland, OR | 3.0 | 1.5 | 1160 | $2,295 | $1.98 | 17d | 1 | 0.32mi |
| 166 NE 162nd Ave Apt 7 Portland, OR | 2.0 | 1.0 | 795 | $1,300 | $1.64 | 43d | 1 | 0.32mi |
| 166 NE 162nd Ave Unit 10 Portland, OR | 2.0 | 1.0 | 795 | $1,450 | $1.82 | 43d | 1 | 0.32mi |
| 16047 E Burnside St Unit 16 Portland, OR | 1.0 | 1.0 | 750 | $1,200 | $1.60 | 4d | 1 | 0.33mi |
| 16047 E Burnside St Unit 06 Portland, OR | 2.0 | 1.0 | 850 | $1,250 | $1.47 | 14d | 1 | 0.33mi |
| 16005 E Burnside St Unit 04 Portland, OR | 2.0 | 1.0 | 800 | $1,250 | $1.56 | 23d | 1 | 0.33mi |
| 16005 E Burnside St Unit 12 Portland, OR | 3.0 | 1.0 | 975 | $1,500 | $1.54 | 12d | 1 | 0.33mi |
| 15851 E Burnside St Unit 15863 Portland, OR | 2.0 | 1.0 | 850 | $1,450 | $1.71 | 43d | 1 | 0.37mi |
| 223 NE 162nd Ave Unit 102 Portland, OR | 2.0 | 1.0 | 800 | $1,250 | $1.56 | 23d | 1 | 0.40mi |
| 223 NE 162nd Ave Apt 207 Portland, OR | 2.0 | 1.0 | 800 | $1,250 | $1.56 | 3d | 1 | 0.40mi |
Listing history 2 events
-
2026-06-01status $85,000 Pending 28 DOM
-
2026-05-31days on market $85,000 Active 28 DOM
ⓘ Source: listings_history table (triggers on properties + properties_extension) + one-shot
backfill from property_details.listing_events for pre-trigger history.
Tax reassessment forecast OR · Resets to sale price
- Current annual tax
- $409 · $34/mo
- Projected year-2 tax
- $824 · $69/mo
- Expected delta
- +$416/yr (+$35/mo · 101.6%)
ⓘ Screening estimate from a state-policy table — verify with the county assessor before closing.
Climate risk First Street
- Flood 1/10 Low FEMA zone X (unshaded) · 0% chance over 30 yrs
- Wildfire 1/10 Low
- Heat 3/10 Moderate 7 d/yr ≥92°F today · 15 d/yr by 30 yrs out
- Wind 1/10 Low
- Air quality 10/10 Extreme 23 unhealthy d/yr today · 27 by 30 yrs out
Nearby sold comps map
Loading sold comps map…
Walkable amenities ~0.75 mi
Loading nearby amenities…
Taxation est. · year 1
- Rental income
- $17,874
- − Mortgage interest
- −$4,761
- − Property taxes
- −$409
- − Insurance
- −$425
- − Repairs & maintenance
- −$1,430
- − Management
- −$1,430
- − Depreciation
- −$2,473
- Taxable income
- $6,947
- Est. tax owed @ 24.0%
- −$1,667
- After-tax cash flow
- $6,271/yr
For passive investors: Depreciation is non-cash, so a rental often shows a tax loss while cash-flowing — sheltering income. Rental losses are passive: they offset passive income freely, and up to $25,000/yr can offset ordinary (W-2) income if you actively participate and your MAGI is under $100k (phasing out to $0 by $150k); unused losses carry forward. On sale, claimed depreciation is recaptured at up to 25%, and gains may owe capital-gains tax (a 1031 exchange can defer both). Figures are a year-1 estimate at your 24.0% rate — not tax advice; consult a CPA.
Schools (NCES district)
- District
- Reynolds SD 7
- NCES district ID
- 4110520
- Math proficiency
- 21% ▬ 0.00%
- Reading proficiency
- 36% ▬ 0.00%
- Median HH income
- $45,502
- Composite
- 27.4/100
- National rank
- #12399
- State rank
- #162 of 183 in OR
Livability — Gresham
- Score
- 81/100
- State rank
- #51
- US rank
- #1537
Category grades
Schools grade is shown separately in the Schools card above.
Census & demographics
- Census place
- Gresham, OR
- County
- Multnomah County · 786,692 people
- City population
- 86,119
- Metro
- Portland-Vancouver-Hillsboro, OR-WA
- Population (ZIP)
- 36,236
- Household income
- $60,198
- Rent vs Own
- Severe rent burden
- 2541.0
Population outlook (Multnomah County) Hauer SSP2
- Today (2025)
- 930,825 people
- By 2030
- 996,904 · +7.1%
- By 2040
- 1,121,379 · +20.5%
- By 2050
- 1,242,124 · +33.4%
- By 2075
- 1,464,431 · +57.3%
- By 2100
- 1,576,181 · +69.3%
Race, ethnicity, and origin ACS 2023
- Neighborhood character
- Diverse neighborhood (Simpson 0.67)
- Race & ethnicity
- White 51% Hispanic / Latino 23% Two or more races 13% Asian 9% Black 9% Native American 2%
- Hispanic origin (detail)
- Mexican 19%
- Common ancestry
- Scotch-Irish 4% Portuguese 3% Subsaharan African 3%
- Foreign-born
- 25% · Canada, Vietnam, China
- Languages at home
- 61% English-only · Spanish 18% Russian/Polish/Slavic 7% Other Asian/Pacific 3%
Political lean MEDSL · Multnomah
- 2024 margin
- Solid D (+62.1) · D 79.3% · R 17.2% · Other 3.5%
- 2008→2024 swing
- +6.0pp toward D · 2008: 56.1pp · 2024: 62.1pp
- All cycles
- 2024: D+62.1 2020: D+61.3 2016: D+58.3 2012: D+54.9 2008: D+56.1
Not yet ingested
- Civics
- —
Market trends
- HPI YoY
- ▼ -493.14%
- Current HPI
- 302.1015
- Rent YoY
- ▲ 0.96%
- Metro
- Portland-Vancouver-Hillsboro, OR-WA
- State GDP YoY
- ▲ 2.05%
- F500 in state
- 2
Industry mix (Fortune 500 HQ in OR)
| Industry | F500 HQs | Revenue |
|---|---|---|
| Consumer Goods | 1 | $51B |
|
||
Price history
1 event — show timeline
- 2026-05-01 Listed $85,000 RMLS
Property tax history
+2.5%/yrLatest (2016): $409 · +10.2% YoY. Source: county tax records.
Cash-flow waterfall
monthlySold comps — $/sqft
last 12 mo · ≤1 miLoading sold comps…