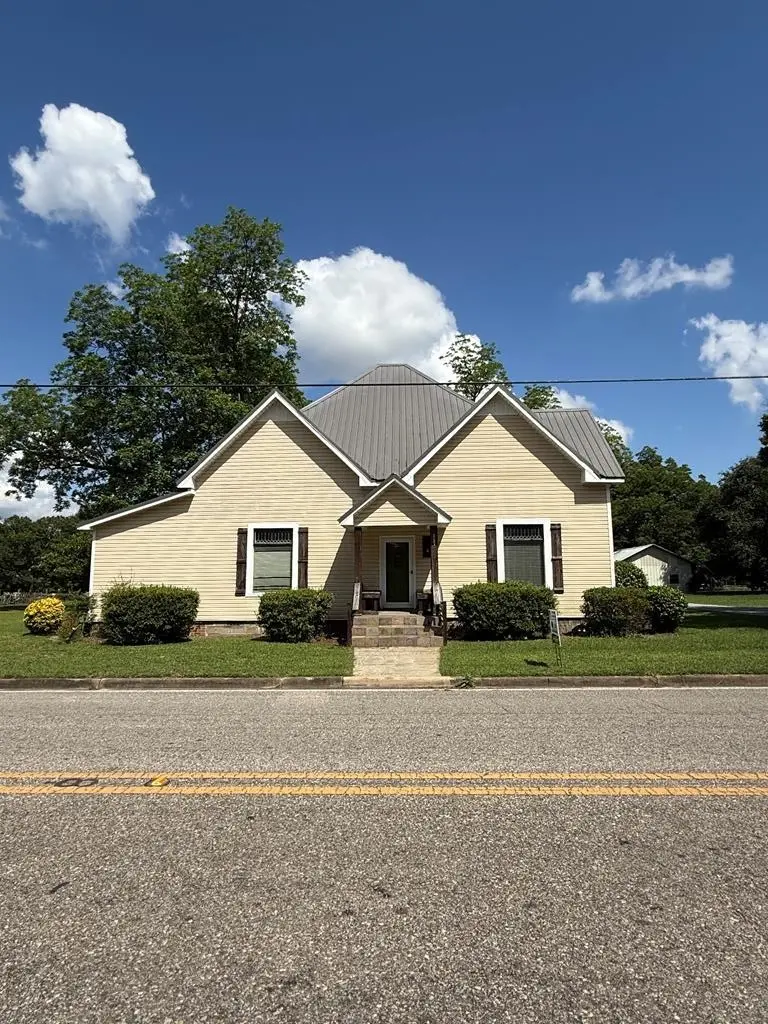
227 South Broad St · Newville, AL
Flood risk 1/10 · Minimal
- FEMA flood zone
- X (unshaded)
- Chance of flooding over 30 yrs
- 0.0%
- Est. flood insurance / yr
- $507 – $1,088
Fire risk 4/10 · Minor
- Est. fire insurance / yr
- $916 – $1,700
Heat risk 8/10 · Major
- Hot days now (above 107°F)
- 7 days/yr
- Hot days in 30 yrs
- 19 days/yr
Wind risk 8/10 · Major
- Chance of severe wind over 30 yrs
- 99.0%
Air-quality risk 2/10 · Minimal
- Unhealthy air days now
- 1 days/yr
- Unhealthy air days in 30 yrs
- 3 days/yr
Risk factors via First Street. Map © Google.
Why this score? — see what drove the C grade
The composite is a weighted blend of 9 inputs, each scored 0–100. Each bar is that input's sub-score; the figure is the points it added to the 100-point composite (weight × sub-score).
- Cash flow +23.0/30.0
- ARV discount +9.6/15.0
- DSCR +7.4/10.0
- 1% rule +4.8/10.0
- Livability +3.0/5.0
- Schools +2.8/10.0
- Rent growth +2.5/5.0
- Condition / age +2.5/5.0
- Appreciation +0.0/10.0
$175,000
🖨 Deal sheet (PDF) 📄 Offer letter ✓ Due diligence
Listing remarks
Move in ready with 1973 sq ft this home was built in 1911. This well-maintained 3-bedroom, 2-bath home blends timeless character with thoughtful modern updates. Inside, you'll find impressive 12-foot ceilings that enhance the spacious feel in the home. The updated kitchen features stainless steel appliances, a farmhouse sink, and abundant cabinet and counter space, making it both functional and inviting. The kitchen and both full bathrooms were updated in 2020 and feature custom tile showers. The HVAC system was replaced in 2023 for added comfort and efficiency. Situated on 1.01 acres, the property offers plenty of outdoor space along with a 30x40 workshop ideal for storage, hobbies, projec
Key facts
- Farmhouse sink
- 12 foot ceilings
- Updated kitchen
Tags
Property features AI
Exterior
- Parking: Detached carport; 2 covered parking spaces (carport)
- Utilities: Public water (see remarks); Public sewer
- Home design: Single family residence; One level
- Construction: Vinyl siding; Built with a foundation (standard for single family residence)
- Exterior features: Covered porch/patio; Screened porch/patio; Barn(s); Storage structure; Accessible entrance; Lot about 1.01 acres
Interior
- Kitchen: Cooktop; Range; Dishwasher; Refrigerator; Eat-in kitchen
- Flooring: Carpet; Wood; Laminate
- Bathrooms: 2 full bathrooms
- Interior features: Storage; Walk-in closet(s); Eat-in kitchen; Double pane windows; Gas fireplace
- Laundry & utility: Washer; Dryer; Laundry inside; Gas water heater
Neighborhood map
What this means for you Summary
Snapshot
- This is a 3-bed/2.0-bath single-family listed at $175k.
Deal economics
- At list price, monthly cash flow is $310 ($4k/yr) — positive.
- The deal already cash-flows at list — no discount required.
- To meet the 1% rule (rent ≥ 1% of price), the offer needs to be $171k (2.4% below list).
- Recommended offer: $171k (2.4% below list) — sets the bar for 1% rule.
Location & tenants
- Location reads 60/100 on livability (#288 in AL) — a middle-class / working-renter tenant base. Strengths: crime A+, cost of living A+, housing A; Watch: health & safety D, amenities F, commute F.
- Henry County (rural): math 21% / reading 45% proficiency, ranked #55 of 129 in AL (top 43%) — families likely to look elsewhere, expect single-tenant / working-renter base with shorter leases.
- Zoned schools: Headland Elementary School (math 39% / reading 59%, grade D, #132 of 627 statewide, top 21%, 858 students, 48% FRL); Headland Middle School (math 16% / reading 58%, grade F, #73 of 257 statewide, top 29%, 576 students, 47% FRL); Headland High School (math 17% / reading 27%, grade F, #142 of 305 statewide, top 51%, 412 students, 49% FRL).
- Market conditions: 173 active listings in the ZIP; 71 units permitted in Henry County in 2024 (0 in 5+ unit buildings).
Forward outlook
- Local home prices are declining (-3.0%/yr); year-one equity from $1k of loan paydown is wiped out by about $5k of value loss. Plan a longer hold.
- Henry County population projected to shrink 8% by 2050 — rents likely to lag national; underwrite the cash flow, not the appreciation.
Negotiation context
- Only 14 days on market — expect competitive offers; lowballing is unlikely to land.
- 5 sale attempts since 9y ago with the ask held roughly flat each time — persistent listings suggest the price (not the market) is what's stuck; bring a comps-based counter.
Risks & watch-outs
- Watch-outs: built in 1911 — expect roof / HVAC / electrical / plumbing capex.
- Climate carrying-cost: severe wind risk, 99% chance of damaging wind over 30y; extreme-heat days projected 7→19/yr by 2055 (HVAC capex compounding) — expect insurance premiums to compound above CPI over the hold.
Questions for the listing agent
- Built in 1911 — when were the roof, HVAC, electrical panel, plumbing, and water heater last replaced?
- Is there a deadline driving the sale (1031 exchange, divorce, estate, relocation)? That informs how much negotiation room exists.
- Schools are F-rated, which usually means shorter tenancies and higher turnover. Who's the typical renter profile here, and what's been the actual vacancy rate?
- What's the average days-on-market for RENTAL listings here right now (not sales)? A rising rental-DOM trend means longer vacancies and softer asking-rent achievability than the comps imply.
- What's the recent tenant-quality profile in this submarket — average credit score on applications, eviction rate, late-payment / NSF rate, and stable-employment percentage? A property-management company in the area should have these aggregated.
- How much new for-sale + rental construction is in the pipeline within 1–3 miles? Heavy new supply typically softens prices + rents 12–24 months out; constrained supply supports both.
Investment metrics
- 1% rule
- 0.98% ✗
- Cap rate
- 8.42%
- Cash-on-cash
- 7.59%
- DSCR
- 1.34
- GRM
- 8.5
CMA / ARV
- ARV (on-the-fly)
- $183,489
- Comps found
- 2
Show comp detail 2 sales within ~0.75 mi
| Address | Dist | Beds/Ba | Sqft | Sold | Price | $/sf | Match |
|---|---|---|---|---|---|---|---|
| 144 Patterson St | 0.11mi | 3/1.5 | 2,020 (+2%) | 2mo | $188,000 | $93 | 87 |
| 445 S Railroad St | 0.42mi | 2/2.0 (-1) | 1,988 (+1%) | 16mo | $120,000 | $60 | 61 |
Match score weights: distance 35% · size 25% · config 20% · recency 20%. Top-matched comps best support the ARV.
Projected returns pro-forma
-3.0% appreciation · 3.0% rent growth · sell at horizon
- IRR
- -4.8%
- Equity multiple
- 0.82×
- Total profit
- $-8,708
- Equity at exit
- $26,093
- IRR
- 4.9%
- Equity multiple
- 1.36×
- Total profit
- $17,502
- Equity at exit
- $15,131
Cash invested: $49,000 (down + closing). Projections, not guarantees.
Landlord ↔ Tenant lean methodology
- Overall (STATE)
- 90 Strongly Landlord-Friendly
- State Alabama
- 90 Strongly Landlord-Friendly · R+15
- County
- — inherits STATE
- City
- — inherits STATE
ZIP-level market 36345
- Home prices YoY
- -16.0%
- Active inventory
- 173
- Price-to-rent
- 8.5×
Monthly cashflow live
- Estimated rent
- $1,708 medium interval (Pro) →
- Mortgage (P&I)
- −$918
- Tax from tax record
- −$49 /mo · $589/yr
- Insurance
- −$73
- HOA
- −$0
- Vacancy / Maint / Mgmt
- −$359
- Net cashflow
- $310
Break-even live
Sensitivity live
| Price | -10% $409 | -5% $359 | +0% $310 | +5% $260 | +10% $211 |
|---|---|---|---|---|---|
| Rent | -10% $175 | -5% $242 | +0% $310 | +5% $377 | +10% $445 |
| Rate | -1.0pp $398 | -0.5pp $354 | base $310 | +0.5pp $264 | +1.0pp $218 |
UW: 25.0% down · 7.5% · 30yr · 1.5% tax · 5.0% vac · 8.0% maint · 8.0% mgmt
Financing live
Cash to close
- Down payment
- $43,750
- Closing costs
- $5,250
- Reserves months
- —
- Total cash needed
- —
Loan-product check · same deal, 3 products live
Conventional
25% down · 7.5% · 30yr
- Down + closing
- —
- Monthly P&I
- —
- Monthly cashflow
- —
- DSCR
- —
- Eligible?
- —
Personal DTI + credit; lowest rate.
DSCR
20% down · 8.5% · 30yr
- Down + closing
- —
- Monthly P&I
- —
- Monthly cashflow
- —
- DSCR
- —
- Eligible?
- —
No personal income docs; deal must DSCR.
Hard money
10% down · 12.0% · 12mo
- Down + closing
- —
- Monthly P&I
- —
- Monthly cashflow
- —
- DSCR
- —
- Eligible?
- —
Short-term bridge; refi at stabilization.
Listing history 14 events
-
2026-06-22days on market $175,000 Active 14 DOM
-
2026-06-21days on market $175,000 Active 13 DOM
-
2026-06-19days on market $175,000 Active 11 DOM
-
2026-06-18days on market $175,000 Active 10 DOM
-
2026-06-17days on market $175,000 Active 9 DOM
-
2026-06-16days on market $175,000 Active 8 DOM
-
2026-06-15days on market $175,000 Active 7 DOM
-
2026-06-14days on market $175,000 Active 5 DOM
-
2026-06-12days on market $175,000 Active 4 DOM
-
2026-06-08days on market $175,000 Active 7 DOM
-
2026-06-07statusdays on market $175,000 Active 6 DOM
-
2026-05-20$175,000 Active
-
2017-08-19$98,000
-
2017-08-19$98,000
ⓘ Source: listings_history table (triggers on properties + properties_extension) + one-shot
backfill from property_details.listing_events for pre-trigger history.
Tax reassessment forecast AL · Resets to sale price
- Current annual tax
- $589 · $49/mo
- Projected year-2 tax
- $718 · $60/mo
- Expected delta
- +$128/yr (+$11/mo · 21.8%)
ⓘ Screening estimate from a state-policy table — verify with the county assessor before closing.
Climate risk First Street
- Flood 1/10 Low FEMA zone X (unshaded) · 0% chance over 30 yrs
- Wildfire 4/10 Moderate
- Heat 8/10 Severe 7 d/yr ≥107°F today · 19 d/yr by 30 yrs out
- Wind 8/10 Severe 99% chance of damaging wind over 30 yrs
- Air quality 2/10 Low 1 unhealthy d/yr today · 3 by 30 yrs out
Nearby sold comps map
Loading sold comps map…
Walkable amenities ~0.75 mi
Loading nearby amenities…
Taxation est. · year 1
- Rental income
- $20,498
- − Mortgage interest
- −$9,803
- − Property taxes
- −$589
- − Insurance
- −$875
- − Repairs & maintenance
- −$1,640
- − Management
- −$1,640
- − Depreciation
- −$5,091
- Taxable income
- $861
- Est. tax owed @ 24.0%
- −$207
- After-tax cash flow
- $3,510/yr
For passive investors: Depreciation is non-cash, so a rental often shows a tax loss while cash-flowing — sheltering income. Rental losses are passive: they offset passive income freely, and up to $25,000/yr can offset ordinary (W-2) income if you actively participate and your MAGI is under $100k (phasing out to $0 by $150k); unused losses carry forward. On sale, claimed depreciation is recaptured at up to 25%, and gains may owe capital-gains tax (a 1031 exchange can defer both). Figures are a year-1 estimate at your 24.0% rate — not tax advice; consult a CPA.
Schools (NCES district)
- District
- Henry County
- NCES district ID
- 0101740
- Math proficiency
- 21% ▼ -15.00%
- Reading proficiency
- 45% ▲ 3.00%
- Median HH income
- $41,502
- Composite
- 27.78/100
- National rank
- #6894
- State rank
- #55 of 129 in AL
Livability — Newville
- Score
- 60/100
- State rank
- #288
- US rank
- #18707
Category grades
Schools grade is shown separately in the Schools card above.
Census & demographics
- Census place
- Newville, AL
- Population (ZIP)
- 8,838
Population outlook (Henry County) Hauer SSP2
- Today (2025)
- 17,109 people
- By 2030
- 16,928 · -1.1%
- By 2040
- 16,376 · -4.3%
- By 2050
- 15,778 · -7.8%
- By 2075
- 14,491 · -15.3%
- By 2100
- 12,673 · -25.9%
Race, ethnicity, and origin ACS 2023
- Neighborhood character
- Predominantly White (79%)
- Race & ethnicity
- White 79% Black 16% Two or more races 2% Hispanic / Latino 2% Asian 1%
- Common ancestry
- Slovak 2% Iranian 1% Romanian 1%
- Foreign-born
- 1% · Vietnam
Political lean MEDSL · Henry
- 2024 margin
- Solid R (+50.8) · D 24.3% · R 75.1%
- 2008→2024 swing
- -21.1pp toward R · 2008: -29.7pp · 2024: -50.8pp
- All cycles
- 2024: R+50.8 2020: R+43.0 2016: R+41.6 2012: R+29.4 2008: R+29.7
Not yet ingested
- Civics
- —
Market trends
- HPI YoY
- ▼ -40.45%
- Current HPI
- 213.0749
- Rent YoY
- —
- Metro
- —
- State GDP YoY
- ▲ 2.94%
- F500 in state
- 4
Industry mix (Fortune 500 HQ in AL)
| Industry | F500 HQs | Revenue |
|---|---|---|
| Financial Services | 1 | $8B |
|
||
| Healthcare | 1 | $5B |
|
||
Price history
+78.6% since first listed6 events — show timeline
- 2026-06-11 Relisted — SAMLS
- 2026-06-04 Relisted — SAMLS
- 2026-05-23 Pending — SAMLS
- 2026-05-20 Listed $175,000 SAMLS
- 2017-08-19 Listed $98,000 MAAR
- 2017-08-19 Listed $98,000 WBR
Property tax history
+5.6%/yrLatest (2025): $589 · +2.6% YoY. Source: county tax records.
Cash-flow waterfall
monthlySold comps — $/sqft
last 12 mo · ≤1 miLoading sold comps…