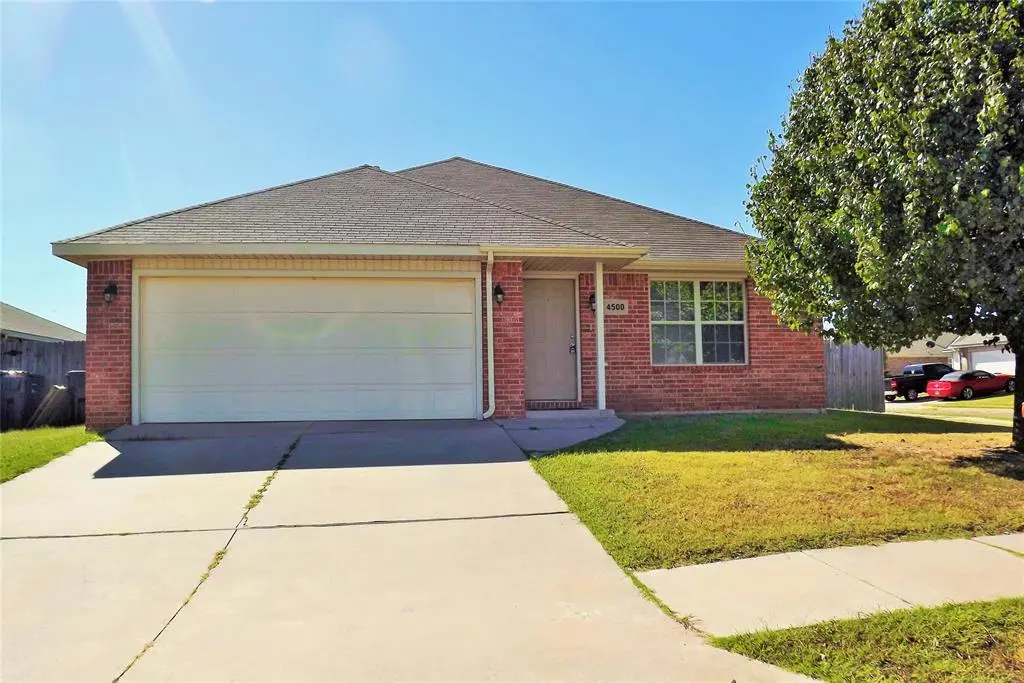
4500 SE 77th St · Oklahoma City, OK
Flood risk 1/10 · Minimal
- FEMA flood zone
- X (unshaded)
- Chance of flooding over 30 yrs
- 0.0%
- Est. flood insurance / yr
- $507 – $1,088
Fire risk 5/10 · Moderate
- Est. fire insurance / yr
- $2,463 – $4,575
Heat risk 6/10 · Moderate
- Hot days now (above 107°F)
- 7 days/yr
- Hot days in 30 yrs
- 19 days/yr
Wind risk 3/10 · Minor
- Chance of severe wind over 30 yrs
- 4.0%
Air-quality risk 2/10 · Minimal
- Unhealthy air days now
- 1 days/yr
- Unhealthy air days in 30 yrs
- 3 days/yr
Risk factors via First Street. Map © Google.
Why this score? — see what drove the D grade
The composite is a weighted blend of 9 inputs, each scored 0–100. Each bar is that input's sub-score; the figure is the points it added to the 100-point composite (weight × sub-score).
- Cash flow +13.0/30.0
- ARV discount +9.2/15.0
- Livability +4.0/5.0
- DSCR +3.9/10.0
- Rent growth +3.7/5.0
- 1% rule +3.3/10.0
- Condition / age +2.5/5.0
- Schools +1.2/10.0
- Appreciation +0.0/10.0
$195,000
🖨 Deal sheet 📄 Offer letter ✓ Due diligence
Listing remarks MLS
A great price for this home that feels much bigger than it really is. The living room/kitchen are open. The kitchen features a large working area with tons of cabinetry. The master bathroom features a walk-in closet. You really need to see this house to appreciate it.
Key facts
- 7,440 sq ft lot
- 2 garage spots
- Built 2006
Property features AI
Finance
- Other: Leased/occupied; Living area reported as 1,242 (assessor); Located in Sunny Pointe Sec 2; On the corner of S Sunny Lane Rd and I-240
- Financial info: Loan qualification allowed; Not assumable
- HOA & community: No mandatory association dues
Exterior
- Parking: 2-car garage
- Utilities: No flood insurance required (per listing)
- Home design: Single family residence; One-story; Existing property
- Construction: Brick and frame construction; Heavy composition roof; Slab foundation; Built (existing)
- Exterior features: Corner lot; No exterior specialty features listed
Interior
- Bedrooms: 3 bedrooms (all on one level)
- Bathrooms: 2 full bathrooms
- Interior features: One living area; No fireplace; No study
Neighborhood map
What this means for you Summary
Snapshot
- This is a 3-bed/2.0-bath single-family listed at $195k.
Deal economics
- At list price, monthly cash flow is $-10 ($-120/yr) — negative.
- To cash-flow at today's rent, offer at most $193k (0.9% below list).
- To meet the 1% rule (rent ≥ 1% of price), the offer needs to be $163k (16.7% below list).
- Recommended offer: $163k (16.7% below list) — sets the bar for 1% rule.
- Cap rate 6.2% vs local median 3.7% in Oklahoma City — top-decile yield for the area; either an underpriced asset or a hidden risk that comps aren't pricing in. Stress-test before assuming the spread holds.
Location & tenants
- Location reads 80/100 on livability (#3 in OK, #1,635 nationally) — a professional / high-income tenant draw. Strengths: amenities A+, commute A+, cost of living A+; Watch: crime F.
- Midwest City-Del City (suburban): math 10% / reading 17% proficiency, ranked #231 of 270 in OK (top 86%) — low school quality limits family demand, transient renter base, plan for 1-2y turnover.
- Zoned schools: Parkview Es (math 10% / reading 9%, grade F, #733 of 845 statewide, top 87%, 679 students, 0% FRL); Del City Hs (math 5% / reading 15%, grade F, #361 of 447 statewide, top 94%, 1,158 students, 0% FRL) — zoned schools average 0% FRL vs 57% district-wide (57 pts lower); this property's tenant base skews higher-income than the district average.
- Market conditions: Rents rising fast (+4.8%/yr); 89 active listings in the ZIP; 12 comparable units currently listed for rent nearby; rentals at typical pace (median 15d on market — plan ~3-4 weeks tenant-placement turnaround); 5,365 units permitted in Oklahoma County in 2024 (569 in 5+ unit buildings).
- This rent runs 31% of the median local income ($63k/yr) — at the standard rent-burdened threshold; future hikes will face affordability resistance.
Forward outlook
- Local home prices are declining (-3.0%/yr); year-one equity from $1k of loan paydown is wiped out by about $6k of value loss. Plan a longer hold.
- Oklahoma County population projected at +41% by 2050 — long-run rental-demand tailwind backs the buy-and-hold thesis.
Negotiation context
- It's been on market 17 days — a 2% lower offer ($192k) is reasonable based on typical stale-listing flexibility.
- 2 sale attempts since 20y ago with the ask held roughly flat each time — persistent listings suggest the price (not the market) is what's stuck; bring a comps-based counter.
- Current owner paid $122k; list at $195k implies a 60% gain — meaningful room to come down on a strong offer.
Risks & watch-outs
- Climate carrying-cost: moderate wildfire risk; extreme-heat days projected 7→19/yr by 2055 (HVAC capex compounding) — expect insurance premiums to compound above CPI over the hold.
Questions for the listing agent
- What do current leases actually rent for vs. the listed asking? Can we see a recent rent roll and the last 12 months of T-12 income?
- Is there a deadline driving the sale (1031 exchange, divorce, estate, relocation)? That informs how much negotiation room exists.
- Schools are F-rated, which usually means shorter tenancies and higher turnover. Who's the typical renter profile here, and what's been the actual vacancy rate?
- Crime grade is F in this area — have there been break-ins, vandalism, or insurance claims at this property in the last 3 years? What carrier currently insures it and at what premium?
- The area grade is low — what's the realistic commute time and amenity access for the typical tenant pool here? Any planned neighborhood developments (good or bad) we should know about?
- What's the average days-on-market for RENTAL listings here right now (not sales)? A rising rental-DOM trend means longer vacancies and softer asking-rent achievability than the comps imply.
- What's the recent tenant-quality profile in this submarket — average credit score on applications, eviction rate, late-payment / NSF rate, and stable-employment percentage? A property-management company in the area should have these aggregated.
- How much new for-sale + rental construction is in the pipeline within 1–3 miles? Heavy new supply typically softens prices + rents 12–24 months out; constrained supply supports both.
Investment metrics
- 1% rule
- 0.83% ✗
- Cap rate
- 6.23%
- Cash-on-cash
- -0.22%
- DSCR
- 0.99
- GRM
- 10.0
CMA / ARV
- ARV (on-the-fly)
- $202,446
- Comps found
- 12
Show comp detail 12 sales within ~0.75 mi
| Address | Dist | Beds/Ba | Sqft | Sold | Price | $/sf | Match |
|---|---|---|---|---|---|---|---|
| 4544 SE 81st St | 0.29mi | 3/2.0 | 1,233 (-1%) | 3mo | $194,000 | $157 | 83 |
| 4517 SE 80th St | 0.20mi | 3/2.0 | 1,241 (-0%) | 10mo | $175,000 | $141 | 82 |
| 4701 SE 81st St | 0.28mi | 3/2.0 | 1,268 (+2%) | 3mo | $217,000 | $171 | 81 |
| 4524 SE 80th St | 0.23mi | 3/2.0 | 1,251 (+1%) | 8mo | $204,500 | $163 | 81 |
| 4704 SE 81st St | 0.31mi | 3/2.0 | 1,268 (+2%) | 3mo | $211,000 | $166 | 80 |
| 4709 SE 81st St | 0.28mi | 3/2.0 | 1,215 (-2%) | 9mo | $205,000 | $169 | 76 |
| 4537 SE 80th St | 0.20mi | 3/2.0 | 1,168 (-6%) | 8mo | $184,000 | $158 | 74 |
| 8112 Erryn Ln | 0.31mi | 3/2.0 | 1,215 (-2%) | 12mo | $210,000 | $173 | 72 |
| 4906 SE 79th St | 0.32mi | 3/2.0 | 1,206 (-3%) | 10mo | $210,000 | $174 | 72 |
| 4528 SE 80th St | 0.23mi | 3/2.0 | 1,176 (-5%) | 11mo | $192,000 | $163 | 71 |
| 7909 Chumley Ln | 0.15mi | 3/2.0 | 1,337 (+8%) | 12mo | $203,000 | $152 | 70 |
| 8113 Waters Edge Way | 0.28mi | 3/2.0 | 1,405 (+13%) | 8mo | $225,000 | $160 | 58 |
Match score weights: distance 35% · size 25% · config 20% · recency 20%. Top-matched comps best support the ARV.
Projected returns pro-forma
-3.0% appreciation · 4.76% rent growth · sell at horizon
- IRR
- -14.8%
- Equity multiple
- 0.46×
- Total profit
- $-29,317
- Equity at exit
- $29,075
- IRR
- -3.6%
- Equity multiple
- 0.74×
- Total profit
- $-13,929
- Equity at exit
- $16,860
Cash invested: $54,600 (down + closing). Projections, not guarantees.
Landlord ↔ Tenant lean methodology
- Overall (STATE)
- 83 Strongly Landlord-Friendly
- State Oklahoma
- 83 Strongly Landlord-Friendly · R+20
- County
- — inherits STATE
- City
- — inherits STATE
ZIP-level market 73135
- Home prices YoY
- -8.0%
- Rents YoY
- 4.8%
- Active inventory
- 89
- Price-to-rent
- 10.0×
Monthly cashflow live
- Estimated rent
- $1,625 high interval (Pro) →
- Mortgage (P&I)
- −$1,023
- Tax from tax record
- −$190 /mo · $2,281/yr
- Insurance
- −$81
- HOA
- −$0
- Vacancy / Maint / Mgmt
- −$341
- Net cashflow
- $-10
Break-even live
UW: 25.0% down · 7.5% · 30yr · 1.5% tax · 5.0% vac · 8.0% maint · 8.0% mgmt
Financing live
Cash to close
- Down payment
- $48,750
- Closing costs
- $5,850
- Reserves months
- —
- Total cash needed
- —
Loan-product check · same deal, 3 products live
Conventional
25% down · 7.5% · 30yr
- Down + closing
- —
- Monthly P&I
- —
- Monthly cashflow
- —
- DSCR
- —
- Eligible?
- —
Personal DTI + credit; lowest rate.
DSCR
20% down · 8.5% · 30yr
- Down + closing
- —
- Monthly P&I
- —
- Monthly cashflow
- —
- DSCR
- —
- Eligible?
- —
No personal income docs; deal must DSCR.
Hard money
10% down · 12.0% · 12mo
- Down + closing
- —
- Monthly P&I
- —
- Monthly cashflow
- —
- DSCR
- —
- Eligible?
- —
Short-term bridge; refi at stabilization.
Rent comps 12 comps
| Address | Beds | Baths | Sqft | Rent | $/sqft | DOM | Units | Dist |
|---|---|---|---|---|---|---|---|---|
| 4800 Interstate 240 Oklahoma City, OK | 3.0 | 2.0 | 1326 | $1,560 | $1.18 | 24d | 1 | 0.11mi |
| 8032 Erryn Ln Oklahoma City, OK | 3.0 | 2.0 | 1361 | $1,595 | $1.17 | 17d | 1 | 0.27mi |
| 7719 Bennie Ter Oklahoma City, OK | 3.0 | 2.0 | 1259 | $1,650 | $1.31 | 2d | 1 | 0.29mi |
| 4512 SE 81st St Oklahoma City, OK | 3.0 | 2.0 | 1233 | $1,650 | $1.34 | 3d | 1 | 0.29mi |
| 7804 Bennie Ter Oklahoma City, OK | 3.0 | 2.0 | 1233 | $1,650 | $1.34 | 11d | 1 | 0.32mi |
| 7802 Bennie Ter Oklahoma City, OK | 3.0 | 2.0 | 1213 | $1,650 | $1.36 | 24d | 1 | 0.32mi |
| 6929 S Sooner Rd Oklahoma City, OK | 1.0–3.0 | 1.0–3.0 | 1085 | $1,890 | $1.74 | 2d | 20 | 0.69mi |
| 4813 SE 89th Ter Oklahoma City, OK | 3.0 | 2.0 | 1395 | $1,495 | $1.07 | 15d | 1 | 0.78mi |
| 3308 SE 89th St Oklahoma City, OK | 3.0 | 2.0 | 1152 | $1,214 | $1.05 | 12d | 1 | 1.23mi |
| 3533 SE 94th St Oklahoma City, OK | 3.0 | 2.0 | 1201 | $1,549 | $1.29 | 16d | 1 | 1.33mi |
| 8601 Canyon Trail Dr Oklahoma City, OK | 3.0 | 2.0 | 1446 | $1,590 | $1.10 | 10d | 1 | 1.35mi |
| 3925 SE 59th St Oklahoma City, OK | 2.0 | 1.5 | 993 | $1,211 | $1.22 | 21d | 1 | 1.44mi |
Listing history 13 events
-
2026-06-18days on market $195,000 Active 17 DOM
-
2026-06-17days on market $195,000 Active 16 DOM
-
2026-06-16days on market $195,000 Active 15 DOM
-
2026-06-15days on market $195,000 Active 14 DOM
-
2026-06-13days on market $195,000 Active 12 DOM
-
2026-06-13days on market $195,000 Active 11 DOM
-
2026-06-09days on market $195,000 Active 8 DOM
-
2026-06-08days on market $195,000 Active 7 DOM
-
2026-06-07days on market $195,000 Active 6 DOM
-
2026-06-05days on market $195,000 Active 3 DOM
-
2026-06-03days on market $195,000 Active 2 DOM
-
2026-06-02remarks 482-char remark
-
2026-06-02$195,000 Active 1 DOM
ⓘ Source: listings_history table (triggers on properties + properties_extension) + one-shot
backfill from property_details.listing_events for pre-trigger history.
Tax reassessment forecast OK · Resets to sale price
- Current annual tax
- $2,281 · $190/mo
- Projected year-2 tax
- $2,281 · $190/mo
- Expected delta
- $0/yr ($0/mo · 0.0%)
ⓘ Screening estimate from a state-policy table — verify with the county assessor before closing.
Climate risk First Street
- Flood 1/10 Low FEMA zone X (unshaded) · 0% chance over 30 yrs
- Wildfire 5/10 Major
- Heat 6/10 Major 7 d/yr ≥107°F today · 19 d/yr by 30 yrs out
- Wind 3/10 Moderate 4% chance of damaging wind over 30 yrs
- Air quality 2/10 Low 1 unhealthy d/yr today · 3 by 30 yrs out
Nearby sold comps map
Loading sold comps map…
Walkable amenities ~0.75 mi
Loading nearby amenities…
Taxation est. · year 1
- Rental income
- $19,503
- − Mortgage interest
- −$10,923
- − Property taxes
- −$2,281
- − Insurance
- −$975
- − Repairs & maintenance
- −$1,560
- − Management
- −$1,560
- − Depreciation
- −$5,673
- Taxable loss
- −$3,470
- Est. tax savings @ 24.0%
- +$833
- After-tax cash flow
- $712/yr
For passive investors: Depreciation is non-cash, so a rental often shows a tax loss while cash-flowing — sheltering income. Rental losses are passive: they offset passive income freely, and up to $25,000/yr can offset ordinary (W-2) income if you actively participate and your MAGI is under $100k (phasing out to $0 by $150k); unused losses carry forward. On sale, claimed depreciation is recaptured at up to 25%, and gains may owe capital-gains tax (a 1031 exchange can defer both). Figures are a year-1 estimate at your 24.0% rate — not tax advice; consult a CPA.
Schools (NCES district)
- District
- Midwest City-Del City
- NCES district ID
- 4019950
- Math proficiency
- 10% ▼ -11.00%
- Reading proficiency
- 17% ▼ -8.00%
- Median HH income
- $45,724
- Composite
- 12.09/100
- National rank
- #9658
- State rank
- #231 of 270 in OK
Livability — Oklahoma City
- Score
- 80/100
- State rank
- #3
- US rank
- #1635
Category grades
Schools grade is shown separately in the Schools card above.
Census & demographics
- Census place
- Oklahoma City, OK
- County
- Oklahoma County · 771,644 people
- City population
- 498,656
- Metro
- Oklahoma City, OK
- Population (ZIP)
- 22,022
- Household income
- $63,478
- Rent vs Own
- Severe rent burden
- 1083.0
Population outlook (Oklahoma County) Hauer SSP2
- Today (2025)
- 911,875 people
- By 2030
- 982,413 · +7.7%
- By 2040
- 1,130,468 · +24.0%
- By 2050
- 1,288,422 · +41.3%
- By 2075
- 1,711,482 · +87.7%
- By 2100
- 2,088,448 · +129.0%
Race, ethnicity, and origin ACS 2023
- Neighborhood character
- Highly diverse neighborhood (Simpson 0.73)
- Race & ethnicity
- White 41% Black 25% Hispanic / Latino 19% Two or more races 15% Asian 6% Native American 2%
- Hispanic origin (detail)
- Mexican 15%
- Common ancestry
- Italian 1% Lithuanian 1% Slovak 1%
- Foreign-born
- 9% · Canada, Vietnam
- Languages at home
- 83% English-only · Spanish 11% Vietnamese 3% Other Asian/Pacific 1%
Political lean MEDSL · Oklahoma
- 2024 margin
- Toss-up / Even · D 48.0% · R 49.7% · Other 2.3%
- 2008→2024 swing
- +15.1pp toward D · 2008: -16.8pp · 2024: -1.7pp
- All cycles
- 2024: R+1.7 2020: R+1.1 2016: R+10.5 2012: R+16.7 2008: R+16.8
Not yet ingested
- Civics
- —
Market trends
- HPI YoY
- ▼ -20.17%
- Current HPI
- 232.4241
- Rent YoY
- ▲ 4.76%
- Metro
- Oklahoma City, OK
- State GDP YoY
- ▲ 1.55%
- F500 in state
- 6
Industry mix (Fortune 500 HQ in OK)
| Industry | F500 HQs | Revenue |
|---|---|---|
| Energy | 3 | $48B |
|
||
Price history
+63.3% since first listed3 events — show timeline
- 2026-06-01 Listed $195,000 MLSOK
- 2007-01-18 Sold (MLS) $121,840 MLSOK
- 2006-10-04 Listed $119,400 MLSOK
Property tax history
+2.6%/yrLatest (2025): $2,281 · +3.3% YoY. Source: county tax records.
Cash-flow waterfall
monthlySold comps — $/sqft
last 12 mo · ≤1 miLoading sold comps…