273 E Vagabond Dr · Murray, UT
Flood risk 7/10 · Major
- FEMA flood zone
- X (unshaded)
- Chance of flooding over 30 yrs
- 0.99%
- Est. flood insurance / yr
- $507 – $1,088
Fire risk 1/10 · Minimal
- Est. fire insurance / yr
- $453 – $841
Heat risk 4/10 · Minor
- Hot days now (above 95°F)
- 7 days/yr
- Hot days in 30 yrs
- 19 days/yr
Wind risk 1/10 · Minimal
- Chance of severe wind over 30 yrs
- —
Air-quality risk 4/10 · Minor
- Unhealthy air days now
- 5 days/yr
- Unhealthy air days in 30 yrs
- 6 days/yr
Risk factors via First Street. Map © Google.
Why this score? — see what drove the B- grade
The composite is a weighted blend of 9 inputs, each scored 0–100. Each bar is that input's sub-score; the figure is the points it added to the 100-point composite (weight × sub-score).
- Cash flow +30.0/30.0
- 1% rule +10.0/10.0
- DSCR +10.0/10.0
- ARV discount +7.5/15.0
- Livability +4.1/5.0
- Schools +3.5/10.0
- Condition / age +2.5/5.0
- Rent growth +1.7/5.0
- Appreciation +0.0/10.0
$85,000
🖨 Deal sheet (PDF) 📄 Offer letter ✓ Due diligence
Listing remarks
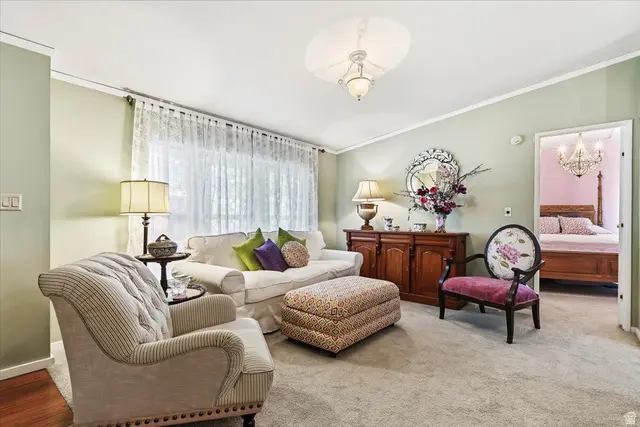
THIS IS THE ONE! This property is the best for only $85,000. Cottonwood Cove 55+ community * Murray / Salt Lake City Utah! Home has been updated with beautiful white cabinets w/ butcher block counters! The bay window in the kitchen gives tonz of natural light. All appliances newer (fridge & gas range)! All new windows with life time guarantee! New carport! 26'X44' Mobile with nice yard and shed. Bathrooms have been updated and both have walk in showers! Right near Cottonwood Creek and across from the large green space, pool and clubhouse. Enjoy all the amenities this home has to offer. Call me for a private showing today. Buyer must qualify for Cottonwood Cove park. Call for de
Key facts
- Parking
- Community pool
- Built 1993
Property features AI
Finance
- HOA & community: Homeowners association with annual fee ($15); Association amenities: clubhouse, management, pet rules, pets permitted, pool; Subdivision: COTTONWOOD COVES
Exterior
- Parking: Covered carport (1 covered parking space, 1 total parking space)
- Utilities: Natural gas connected; Electricity connected; Public sewer connected; Culinary water
- Home design: Mobile home; Faces south; Has a view; Single-family zoning
- Construction: Clapboard/Masonite exterior; Asphalt roof; Built and standing
- Exterior features: Partially fenced yard; Paved road access; Mountain view; Double-pane windows; Storage shed(s)
Interior
- Kitchen: Microwave; Refrigerator; Free-standing range/oven; Updated kitchen
- Bedrooms: 3 bedrooms (primary bedroom on 1st floor)
- Flooring: Carpet; Tile
- Bathrooms: 2 three-quarter bathrooms
- Heating & cooling: Forced air heating (gas central); Evaporative cooling
- Interior features: Walk-in closet; Disposal; Updated kitchen; Free-standing range/oven
- Laundry & utility: Washer; Dryer; Electric dryer hookup
Neighborhood map
What this means for you Summary
Snapshot
- This is a 3-bed/2.0-bath manufactured listed at $85k.
Deal economics
- At list price, monthly cash flow is $380 ($5k/yr) — positive.
- The deal already cash-flows at list — no discount required.
- Meets the 1% rule at list price ($1k rent vs $85k).
- Recommended offer: $80k (6.0% below list) — sets the bar for market timing.
Location & tenants
- Location reads 82/100 on livability (#29 in UT, #1,169 nationally) — a professional / high-income tenant draw. Strengths: commute A+, housing A+, health & safety A; Watch: cost of living C-, crime D.
- Murray District (suburban): math 37% / reading 43% proficiency, ranked #46 of 80 in UT (top 58%) — families likely to look elsewhere, expect single-tenant / working-renter base with shorter leases.
- Zoned schools: Parkside School (math 13% / reading 26%, grade F, #525 of 585 statewide, top 91%, 471 students, 69% FRL); Hillcrest Jr High (math 24% / reading 31%, grade F, #113 of 138 statewide, top 83%, 776 students, 39% FRL); Murray High (math 29% / reading 45%, grade F, #78 of 171 statewide, top 49%, 1,400 students, 24% FRL).
- Zoned-school proficiency averages 28% at this address vs 40% district-wide (-12 pts) — the specific schools serving this property underperform the Murray District average; the district grade overstates school quality for this exact location.
- Market conditions: Rents falling (-3.0%/yr); 230 active listings in the ZIP; 40 comparable units currently listed for rent nearby; rentals leasing fast (median 7d on market — plan ~1-2 weeks tenant-placement turnaround); 4,970 units permitted in Salt Lake County in 2024 (1,963 in 5+ unit buildings).
Forward outlook
- Local home prices are declining (-3.0%/yr); year-one equity from $588 of loan paydown is wiped out by about $3k of value loss. Plan a longer hold.
- Salt Lake County population projected at +37% by 2050 — long-run rental-demand tailwind backs the buy-and-hold thesis.
- At projected returns (-3.0% appreciation + 0.0% rent growth), your $24k cash investment doubles in ~9 years — after that, you're playing with house money.
Negotiation context
- It's been on market 81 days — a 6% lower offer ($80k) is reasonable based on typical stale-listing flexibility.
- 2 sale attempts since 16y ago; this cycle's ask has dropped $15k (15%) from the opening price — seller is motivated, your offer sets the floor, not the list.
Risks & watch-outs
- Watch-outs: flood insurance adds $66/mo.
- Climate carrying-cost: major flood risk — expect insurance premiums to compound above CPI over the hold.
Questions for the listing agent
- It's been on market 81 days. Have you received any prior offers? Is the seller open to a 6% concession, seller financing, or rate buy-down credit?
- What's the actual annual flood-insurance premium (NFIP or private), and is the property in a SFHA with mandatory coverage?
- What does the HOA fee cover, when was the last increase, and are there any pending special assessments or reserve-fund shortfalls?
- Why hasn't it sold? Are there any deal-killer items the seller is aware of (foundation, flood, title, zoning, code violations)?
- Is there a deadline driving the sale (1031 exchange, divorce, estate, relocation)? That informs how much negotiation room exists.
- Schools are B-rated — typically a magnet for longer-tenancy family renters. What's the average tenant stay here, and is there a school-zone premium baked into asking?
- Crime grade is D in this area — have there been break-ins, vandalism, or insurance claims at this property in the last 3 years? What carrier currently insures it and at what premium?
- What's the average days-on-market for RENTAL listings here right now (not sales)? A rising rental-DOM trend means longer vacancies and softer asking-rent achievability than the comps imply.
- What's the recent tenant-quality profile in this submarket — average credit score on applications, eviction rate, late-payment / NSF rate, and stable-employment percentage? A property-management company in the area should have these aggregated.
- How much new for-sale + rental construction is in the pipeline within 1–3 miles? Heavy new supply typically softens prices + rents 12–24 months out; constrained supply supports both.
Investment metrics
- 1% rule
- 1.54% ✓
- Cap rate
- 12.60%
- Cash-on-cash
- 22.53%
- DSCR
- 2.00
- GRM
- 5.4
CMA / ARV
No comps found within radius.
Projected returns pro-forma
-3.0% appreciation · 0.0% rent growth · sell at horizon
- IRR
- 7.5%
- Equity multiple
- 1.28×
- Total profit
- $6,676
- Equity at exit
- $12,674
- IRR
- 13.8%
- Equity multiple
- 1.94×
- Total profit
- $22,418
- Equity at exit
- $7,349
Cash invested: $23,800 (down + closing). Projections, not guarantees.
Landlord ↔ Tenant lean methodology
- Overall (STATE)
- 86 Strongly Landlord-Friendly
- State Utah
- 86 Strongly Landlord-Friendly · R+15
- County
- — inherits STATE
- City
- — inherits STATE
ZIP-level market 84107
- Rents YoY
- -3.0%
- Active inventory
- 230
- Price-to-rent
- 5.4×
Monthly cashflow live
- Estimated rent
- $1,310 high interval (Pro) →
- Mortgage (P&I)
- −$446
- Tax est. 1.5%
- −$106 /mo · $1,275/yr
- Insurance
- −$35
- Flood insurance flood zone
- −$66 /mo · $798/yr
- HOA
- −$1
- Lot rent leased land?
- −$0
- Vacancy / Maint / Mgmt
- −$275
- Net cashflow
- $380
Break-even live
Sensitivity live
| Price | -10% $439 | -5% $410 | +0% $380 | +5% $351 | +10% $322 |
|---|---|---|---|---|---|
| Rent | -10% $277 | -5% $329 | +0% $380 | +5% $432 | +10% $484 |
| Rate | -1.0pp $423 | -0.5pp $402 | base $380 | +0.5pp $358 | +1.0pp $336 |
UW: 25.0% down · 7.5% · 30yr · 1.5% tax · 5.0% vac · 8.0% maint · 8.0% mgmt
Financing live
Cash to close
- Down payment
- $21,250
- Closing costs
- $2,550
- Reserves months
- —
- Total cash needed
- —
Loan-product check · same deal, 3 products live
Conventional
25% down · 7.5% · 30yr
- Down + closing
- —
- Monthly P&I
- —
- Monthly cashflow
- —
- DSCR
- —
- Eligible?
- —
Personal DTI + credit; lowest rate.
DSCR
20% down · 8.5% · 30yr
- Down + closing
- —
- Monthly P&I
- —
- Monthly cashflow
- —
- DSCR
- —
- Eligible?
- —
No personal income docs; deal must DSCR.
Hard money
10% down · 12.0% · 12mo
- Down + closing
- —
- Monthly P&I
- —
- Monthly cashflow
- —
- DSCR
- —
- Eligible?
- —
Short-term bridge; refi at stabilization.
Rent comps 40 comps
| Address | Beds | Baths | Sqft | Rent | $/sqft | DOM | Units | Dist |
|---|---|---|---|---|---|---|---|---|
| 4150 S 300 E Salt Lake City, UT | 1.0–2.0 | 1.0–2.0 | 844 | $2,179 | $2.58 | 5d | 17 | 0.21mi |
| 4371 S Fairbourne Ave Unit 11 Murray, UT | 2.0 | 1.0 | 820 | $1,095 | $1.34 | 18d | 1 | 0.21mi |
| 333 E 4500 S #13 Salt Lake City, UT | 2.0 | 1.0 | 1400 | $1,400 | $1.00 | 6d | 1 | 0.23mi |
| 4109 S 300 E Salt Lake City, UT | 2.0 | 2.0 | 1334 | $2,600 | $1.95 | 4d | 1 | 0.28mi |
| 4080 S 300 E Unit F Millcreek, UT | 2.0 | 1.0 | 1200 | $1,125 | $0.94 | 26d | 1 | 0.31mi |
| 4150 S 500 E Salt Lake City, UT | 1.0–2.0 | 1.0–2.0 | 832 | $1,325 | $1.59 | 26d | 1 | 0.32mi |
| 4072 S 300 E Millcreek, UT | 2.0 | 2.5 | 1200 | $1,895 | $1.58 | 26d | 1 | 0.35mi |
| 4115 S 430 E Millcreek, UT | 1.0–2.0 | 1.0–1.5 | 876 | $1,350 | $1.54 | 18d | 13 | 0.36mi |
| 448 E Damsel Dr Salt Lake City, UT | 2.0 | 1.0–2.0 | 1180 | $1,512 | $1.28 | 18d | 4 | 0.37mi |
| 293 E Hill Ave Unit 10 Millcreek, UT | 3.0 | 2.0 | 1030 | $1,195 | $1.16 | 17d | 1 | 0.40mi |
| 215 E 4600 S Apt 4 Murray, UT | 2.0 | 1.0 | 850 | $1,250 | $1.47 | 6d | 1 | 0.41mi |
| 4277 S Main St Salt Lake City, UT | 2.0 | 1.0–2.0 | 594 | $1,192 | $2.01 | 6d | 1 | 0.41mi |
| 428 E Park Oak Pl Salt Lake City, UT | 3.0 | 2.5 | 1500 | $2,300 | $1.53 | 6d | 1 | 0.41mi |
| 340 E Gordon Ln Salt Lake City, UT | 2.0 | 1.0 | 850 | $1,295 | $1.52 | 6d | 3 | 0.41mi |
| 335 E Woodlake Dr Salt Lake City, UT | 1.0–2.0 | 1.0–2.0 | 881 | $1,561 | $1.77 | 4d | 11 | 0.43mi |
| 4197 S Main St Millcreek, UT | 3.0 | 1.0–2.0 | 891 | $1,858 | $2.08 | 5d | 13 | 0.45mi |
| 514 E 4090 S Salt Lake City, UT | 1.0–2.0 | 1.0–2.0 | 825 | $1,521 | $1.84 | 5d | 25 | 0.46mi |
| 47 W Fireclay Ave Salt Lake City, UT | 1.0–2.0 | 1.0–2.0 | 902 | $2,088 | $2.31 | 5d | 36 | 0.48mi |
| 4624 S Meadow Rd Unit Down Murray, UT | 2.0 | 1.0 | 1200 | $2,000 | $1.67 | 15d | 1 | 0.48mi |
| 4410 S Main St Salt Lake City, UT | 2.0 | 1.0–2.0 | 892 | $2,810 | $3.15 | 5d | 76 | 0.49mi |
| 54 W Fireclay Ave Salt Lake City, UT | 1.0–2.0 | 1.0–2.0 | 962 | $1,775 | $1.84 | 26d | 1 | 0.55mi |
| 480 E Brandt Ct Salt Lake City, UT | 2.0–3.0 | 1.5 | 1200 | $2,009 | $1.67 | 6d | 4 | 0.56mi |
| 44 W Iko Ave Millcreek, UT | 2.0 | 2.5 | 1296 | $2,200 | $1.70 | 6d | 1 | 0.56mi |
| 4320 S 700 E Salt Lake City, UT | 2.0 | 1.0 | 920 | $1,314 | $1.43 | 5d | 3 | 0.57mi |
| 3993 S Main St Millcreek, UT | 1.0–2.0 | 1.0–2.0 | 838 | $1,650 | $1.97 | 5d | 25 | 0.59mi |
| 136 W Fireclay Ave Murray, UT | 1.0–3.0 | 1.0–2.0 | 991 | $1,589 | $1.60 | 6d | 12 | 0.63mi |
| 162 W 4490 S Murray, UT | 1.0–3.0 | 1.0–2.0 | 854 | $1,800 | $2.11 | 26d | 22 | 0.71mi |
| 3910 S Main St Millcreek, UT | 1.0–2.0 | 1.0–2.0 | 747 | $1,652 | $2.21 | 6d | 6 | 0.75mi |
| 265 Rigdon Ave Unit 1 South Salt Lake, UT | 2.0 | 1.0 | 900 | $1,195 | $1.33 | 23d | 1 | 0.76mi |
| 2 Regal St Murray, UT | 2.0 | 1.0 | 1004 | $1,195 | $1.19 | 6d | 7 | 0.85mi |
| 4380 S 900 E #104 Millcreek, UT | 3.0 | 2.5 | 1410 | $2,699 | $1.91 | 5d | 1 | 0.86mi |
| 4380 S 900 E Millcreek, UT | 3.0 | 2.5 | 1409 | $2,499 | $1.77 | 26d | 1 | 0.86mi |
| 4380 S 900 E Millcreek, UT | 3.0 | 2.5 | 1409 | $2,499 | $1.77 | 17d | 1 | 0.86mi |
| 3708 S McCall St South Salt Lake, UT | 2.0 | 1.0 | 885 | $1,300 | $1.47 | 18d | 1 | 0.88mi |
| 3708 S McCall St South Salt Lake, UT | 2.0 | 1.0 | 885 | $1,300 | $1.47 | 16d | 1 | 0.88mi |
| 4364 S 900 E Millcreek, UT | 3.0 | 2.5 | 1409 | $2,499 | $1.77 | 26d | 1 | 0.91mi |
| 4386 S 900 E Salt Lake City, UT | 3.0 | 2.5 | 1410 | $2,499 | $1.77 | 6d | 1 | 0.91mi |
| 4545 S Arcadia Green Way Salt Lake City, UT | 2.0 | 2.0 | 1000 | $1,425 | $1.43 | 4d | 4 | 0.92mi |
| 3653 S 200 E South Salt Lake, UT | 2.0 | 1.0 | 700 | $1,025 | $1.46 | 26d | 1 | 0.93mi |
| 4070 S 900 E Salt Lake City, UT | 1.0–2.0 | 1.0 | 837 | $1,451 | $1.73 | 4d | 5 | 0.93mi |
HOA detail
- Monthly dues
- $1 · $12/yr
- Likely covers
- gaspool
Listing history 20 events
-
2026-06-22days on market $85,000 Active 81 DOM
-
2026-06-21days on market $85,000 Active 80 DOM
-
2026-06-18days on market $85,000 Active 77 DOM
-
2026-06-17days on market $85,000 Active 76 DOM
-
2026-06-16days on market $85,000 Active 75 DOM
-
2026-06-15days on market $85,000 Active 74 DOM
-
2026-06-13days on market $85,000 Active 72 DOM
-
2026-06-13days on market $85,000 Active 71 DOM
-
2026-06-09days on market $85,000 Active 68 DOM
-
2026-06-08days on market $85,000 Active 67 DOM
-
2026-06-07days on market $85,000 Active 66 DOM
-
2026-06-05days on market $85,000 Active 63 DOM
-
2026-06-03days on market $85,000 Active 62 DOM
-
2026-06-02days on market $85,000 Active 61 DOM
-
2026-06-01days on market $85,000 Active 60 DOM
-
2026-05-31days on market $85,000 Active 59 DOM
-
2026-05-02price $95,000
-
2026-04-02$100,000 Active
-
2010-04-22historical
-
2010-02-15$29,000
ⓘ Source: listings_history table (triggers on properties + properties_extension) + one-shot
backfill from property_details.listing_events for pre-trigger history.
Climate risk First Street
- Flood 7/10 Severe FEMA zone X (unshaded) · 99% chance over 30 yrs
- Wildfire 1/10 Low
- Heat 4/10 Moderate 7 d/yr ≥95°F today · 19 d/yr by 30 yrs out
- Wind 1/10 Low
- Air quality 4/10 Moderate 5 unhealthy d/yr today · 6 by 30 yrs out
Nearby sold comps map
Loading sold comps map…
Walkable amenities ~0.75 mi
Loading nearby amenities…
Taxation est. · year 1
- Rental income
- $15,726
- − Mortgage interest
- −$4,761
- − Property taxes
- −$1,275
- − Insurance
- −$1,222
- − Repairs & maintenance
- −$1,258
- − Management
- −$1,258
- − HOA
- −$12
- − Depreciation
- −$2,473
- Taxable income
- $3,466
- Est. tax owed @ 24.0%
- −$832
- After-tax cash flow
- $3,733/yr
For passive investors: Depreciation is non-cash, so a rental often shows a tax loss while cash-flowing — sheltering income. Rental losses are passive: they offset passive income freely, and up to $25,000/yr can offset ordinary (W-2) income if you actively participate and your MAGI is under $100k (phasing out to $0 by $150k); unused losses carry forward. On sale, claimed depreciation is recaptured at up to 25%, and gains may owe capital-gains tax (a 1031 exchange can defer both). Figures are a year-1 estimate at your 24.0% rate — not tax advice; consult a CPA.
Schools (NCES district)
- District
- Murray District
- NCES district ID
- 4900600
- Math proficiency
- 37% ▼ -8.00%
- Reading proficiency
- 43% ▼ -6.00%
- Median HH income
- $53,804
- Composite
- 34.84/100
- National rank
- #5096
- State rank
- #46 of 80 in UT
Livability — Murray
- Score
- 82/100
- State rank
- #29
- US rank
- #1169
Category grades
Schools grade is shown separately in the Schools card above.
Census & demographics
- Census place
- Murray, UT
- County
- Salt Lake County · 1,195,750 people
- City population
- 38,257
- Metro
- Salt Lake City, UT
- Population (ZIP)
- 38,257
- Household income
- $72,108
- Rent vs Own
- Severe rent burden
- 2149.0
Population outlook (Salt Lake County) Hauer SSP2
- Today (2025)
- 1,305,860 people
- By 2030
- 1,402,611 · +7.4%
- By 2040
- 1,594,533 · +22.1%
- By 2050
- 1,787,244 · +36.9%
- By 2075
- 2,224,138 · +70.3%
- By 2100
- 2,551,390 · +95.4%
Race, ethnicity, and origin ACS 2023
- Neighborhood character
- Predominantly White (65%)
- Race & ethnicity
- White 65% Hispanic / Latino 18% Two or more races 12% Asian 5% Black 4% Pacific Islander 2%
- Hispanic origin (detail)
- Mexican 10%
- Common ancestry
- Italian 4% Slovak 4% Iranian 2%
- Foreign-born
- 16% · Canada, Jamaica, China
- Languages at home
- 78% English-only · Spanish 10% Other Indo-European 4% Other Asian/Pacific 2%
Political lean MEDSL · Salt Lake
- 2024 margin
- D (+10.2) · D 53.7% · R 43.5% · Other 2.8%
- 2008→2024 swing
- +10.1pp toward D · 2008: 0.1pp · 2024: 10.2pp
- All cycles
- 2024: D+10.2 2020: D+11.0 2016: D+10.2 2012: R+19.3 2008: D+0.1
Not yet ingested
- Civics
- —
Market trends
- HPI YoY
- ▼ -404.21%
- Current HPI
- 309.8745
- Rent YoY
- ▼ -3.04%
- Metro
- Salt Lake City, UT
- State GDP YoY
- ▲ 3.54%
- F500 in state
- 2
Industry mix (Fortune 500 HQ in UT)
| Industry | F500 HQs | Revenue |
|---|---|---|
| Financial Services | 1 | $3B |
|
||
Price history
+227.6% since first listed4 events — show timeline
- 2026-05-02 Price Changed $95,000 WFRMLS
- 2026-04-02 Listed $100,000 WFRMLS
- 2010-04-22 Listing Removed — WFRMLS
- 2010-02-15 Listed $29,000 WFRMLS
Cash-flow waterfall
monthlySold comps — $/sqft
last 12 mo · ≤1 miLoading sold comps…