335 Nelson Rd N · Cape Coral, FL
Flood risk No data
- FEMA flood zone
- —
- Chance of flooding over 30 yrs
- —
- Est. flood insurance / yr
- —
Fire risk No data
- Est. fire insurance / yr
- —
Heat risk No data
- Hot days now (above threshold)
- —
- Hot days in 30 yrs
- —
Wind risk No data
- Chance of severe wind over 30 yrs
- —
Air-quality risk No data
- Unhealthy air days now
- —
- Unhealthy air days in 30 yrs
- —
Risk factors via First Street. Map © Google.
Why this score? — see what drove the F grade
The composite is a weighted blend of 9 inputs, each scored 0–100. Each bar is that input's sub-score; the figure is the points it added to the 100-point composite (weight × sub-score).
- Cash flow +8.7/30.0
- ARV discount +7.5/15.0
- Schools +4.1/10.0
- Livability +3.9/5.0
- Condition / age +2.5/5.0
- DSCR +2.4/10.0
- 1% rule +1.5/10.0
- Rent growth +1.1/5.0
- Appreciation +0.0/10.0
$366,880
🖨 Deal sheet 📄 Offer letter ✓ Due diligence
Listing remarks MLS
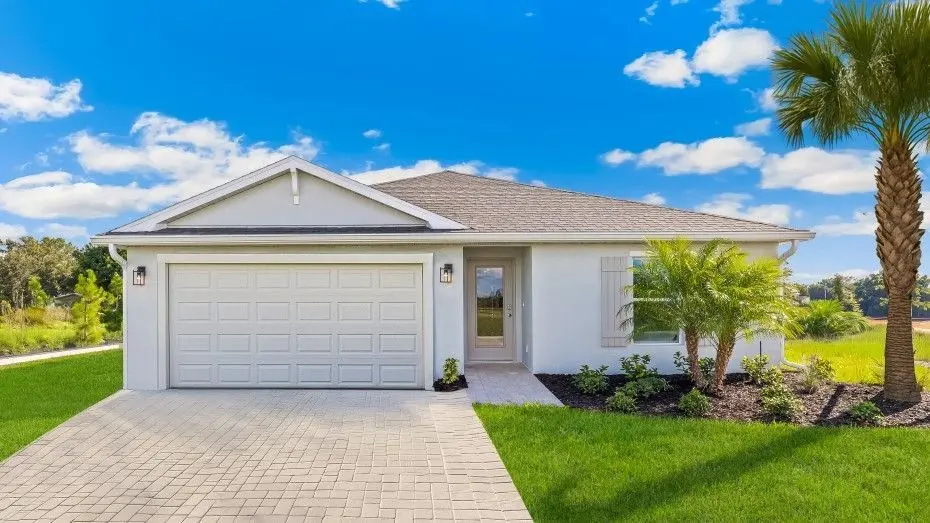
WELCOME TO YOUR NEW DR HORTON HOME!! This is our appealing one-story, open concept, 1499 sqft FREEPORT II Floorplan featuring impact glass, 4 bedrooms, 2 bathrooms, 2-car garage, concrete block construction. This home is on a beautiful lot located in Cape Coral WITH ALL ASSESSMENTS PAID. This home boasts Designer cabinets and quartz countertops in both the kitchen and baths. Experience the timeless beauty and durability of RevWood laminated wood floors featured throughout the home, modern flat stock trim and baseboards, all stainless kitchen appliances including refrigerator, paver driveways and lanai, irrigation system, and garage door openers. Be wowed by the INCLUDED "home-is-connected" package and our builder's warranty. This is why owning a brand-new home from America's largest builder is going to be your best option. These homes move quickly so don't miss out. Finishings may vary - images are representational only of the model home based in that community.
Key facts
- Quartz countertops
- Designer cabinets
- Impact glass
Tags
Property features AI
Finance
- Other: Lot is regular with surveyed dimensions (80' x 125'); Lot area approximately 0.24 acres; Canal width: None; Irrigation assessment paid
- Financial info: Taxes listed (see remarks for details)
- HOA & community: No HOA maintenance; No community amenities; Community type: See remarks
Exterior
- Parking: Attached 2-car garage; Paved driveway
- Security: Impact resistant doors
- Utilities: Water assessment paid; Sewer assessment paid; Cable available
- Home design: Residential single-family home; 1 story (ranch); Rear exposure to the east; Located in Cape Coral development
- Construction: Concrete block construction; Built in 2026
- Exterior features: Automatic sprinkler system; Impact resistant doors; Stone exterior finish; Single hung windows; Shingle roof
Interior
- Kitchen: Pantry; Electric cooktop; Dishwasher; Garbage disposal; Microwave; Refrigerator/Freezer
- Bedrooms: 4 bedrooms; Master bedroom on ground level
- Flooring: Vinyl flooring
- Bathrooms: 2 full bathrooms; Master bath with shower only
- Heating & cooling: Central electric heat; Central electric cooling
- Interior features: Cable prewire; Pantry; Walk-in closet; Great room floor plan; Laundry in residence; Unfurnished
- Laundry & utility: Laundry inside the home; Auto garage door
Neighborhood map
What this means for you Summary
Snapshot
- This is a 4-bed/2.0-bath land listed at $367k.
Deal economics
- At list price, monthly cash flow is $-309 ($-4k/yr) — negative.
- To cash-flow at today's rent, offer at most $312k (14.9% below list).
- To meet the 1% rule (rent ≥ 1% of price), the offer needs to be $238k (35.3% below list).
- Recommended offer: $238k (35.3% below list) — sets the bar for 1% rule.
- Cap rate 5.3% vs local median 3.1% in Cape Coral — top-decile yield for the area; either an underpriced asset or a hidden risk that comps aren't pricing in. Stress-test before assuming the spread holds.
Location & tenants
- Location reads 77/100 on livability (#208 in FL, #3,098 nationally) — a middle-class / working-renter tenant base. Strengths: housing A+, health & safety A+, amenities B+; Watch: commute F.
- Lee (suburban): math 47% / reading 50% proficiency, ranked #42 of 73 in FL (top 58%) — families likely to look elsewhere, expect single-tenant / working-renter base with shorter leases.
- Market conditions: Rents falling (-5.5%/yr); 2652 active listings in the ZIP; 40 comparable units currently listed for rent nearby; rentals leasing fast (median 3d on market — plan ~1-2 weeks tenant-placement turnaround); solid renter incomes; 15,411 units permitted in Lee County in 2024 (4,686 in 5+ unit buildings).
- This rent runs 31% of the median local income ($91k/yr) — at the standard rent-burdened threshold; future hikes will face affordability resistance.
Forward outlook
- Local home prices are declining (-3.0%/yr); year-one equity from $3k of loan paydown is wiped out by about $11k of value loss. Plan a longer hold.
- Lee County population projected at +44% by 2050 — long-run rental-demand tailwind backs the buy-and-hold thesis.
Negotiation context
- It's been on market 72 days — a 6% lower offer ($345k) is reasonable based on typical stale-listing flexibility.
- 4 sale attempts since 11y ago with the ask held roughly flat each time — persistent listings suggest the price (not the market) is what's stuck; bring a comps-based counter.
- Current owner paid $75k; list at $367k implies a 389% gain — meaningful room to come down on a strong offer.
Questions for the listing agent
- What do current leases actually rent for vs. the listed asking? Can we see a recent rent roll and the last 12 months of T-12 income?
- It's been on market 72 days. Have you received any prior offers? Is the seller open to a 35% concession, seller financing, or rate buy-down credit?
- Why hasn't it sold? Are there any deal-killer items the seller is aware of (foundation, flood, title, zoning, code violations)?
- Is there a deadline driving the sale (1031 exchange, divorce, estate, relocation)? That informs how much negotiation room exists.
- Schools are B-rated — typically a magnet for longer-tenancy family renters. What's the average tenant stay here, and is there a school-zone premium baked into asking?
- The area grade is low — what's the realistic commute time and amenity access for the typical tenant pool here? Any planned neighborhood developments (good or bad) we should know about?
- What's the average days-on-market for RENTAL listings here right now (not sales)? A rising rental-DOM trend means longer vacancies and softer asking-rent achievability than the comps imply.
- What's the recent tenant-quality profile in this submarket — average credit score on applications, eviction rate, late-payment / NSF rate, and stable-employment percentage? A property-management company in the area should have these aggregated.
- How much new for-sale + rental construction is in the pipeline within 1–3 miles? Heavy new supply typically softens prices + rents 12–24 months out; constrained supply supports both.
Investment metrics
- 1% rule
- 0.65% ✗
- Cap rate
- 5.28%
- Cash-on-cash
- -3.62%
- DSCR
- 0.84
- GRM
- 12.9
CMA / ARV
No comps found within radius.
Projected returns pro-forma
-3.0% appreciation · 0.0% rent growth · sell at horizon
- IRR
- -25.3%
- Equity multiple
- 0.16×
- Total profit
- $-86,303
- Equity at exit
- $54,703
- IRR
- -31.9%
- Equity multiple
- -0.25×
- Total profit
- $-128,163
- Equity at exit
- $31,721
Cash invested: $102,726 (down + closing). Projections, not guarantees.
Landlord ↔ Tenant lean methodology
- Overall (STATE)
- 87 Strongly Landlord-Friendly
- State Florida
- 87 Strongly Landlord-Friendly · R+3
- County
- — inherits STATE
- City
- — inherits STATE
ZIP-level market 33993
- Home prices YoY
- -14.1%
- Rents YoY
- -5.5%
- Active inventory
- 2652
- Price-to-rent
- 12.9×
Monthly cashflow live
- Estimated rent
- $2,376 high interval (Pro) →
- Mortgage (P&I)
- −$1,924
- Tax from tax record
- −$109 /mo · $1,312/yr
- Insurance
- −$153
- HOA
- −$0
- Vacancy / Maint / Mgmt
- −$499
- Net cashflow
- $-309
Break-even live
UW: 25.0% down · 7.5% · 30yr · 1.5% tax · 5.0% vac · 8.0% maint · 8.0% mgmt
Financing live
Cash to close
- Down payment
- $91,720
- Closing costs
- $11,006
- Reserves months
- —
- Total cash needed
- —
Loan-product check · same deal, 3 products live
Conventional
25% down · 7.5% · 30yr
- Down + closing
- —
- Monthly P&I
- —
- Monthly cashflow
- —
- DSCR
- —
- Eligible?
- —
Personal DTI + credit; lowest rate.
DSCR
20% down · 8.5% · 30yr
- Down + closing
- —
- Monthly P&I
- —
- Monthly cashflow
- —
- DSCR
- —
- Eligible?
- —
No personal income docs; deal must DSCR.
Hard money
10% down · 12.0% · 12mo
- Down + closing
- —
- Monthly P&I
- —
- Monthly cashflow
- —
- DSCR
- —
- Eligible?
- —
Short-term bridge; refi at stabilization.
Rent comps 40 comps
| Address | Beds | Baths | Sqft | Rent | $/sqft | DOM | Units | Dist |
|---|---|---|---|---|---|---|---|---|
| 626 NW 2nd Ln Cape Coral, FL | 3.0 | 2.0 | 1272 | $2,200 | $1.73 | 16d | 1 | 0.22mi |
| 626 NW 2nd Ln Cape Coral, FL | 3.0 | 2.0 | 1272 | $2,200 | $1.73 | 23d | 1 | 0.22mi |
| 186 Tierra De Paz Loop Cape Coral, FL | 1.0–3.0 | 1.0–2.0 | 935 | $2,496 | $2.67 | 2d | 153 | 0.39mi |
| 526 NW 1st Ln Cape Coral, FL | 4.0 | 2.0 | 1793 | $2,000 | $1.12 | 23d | 1 | 0.46mi |
| 222 NW 4th Ter Cape Coral, FL | 4.0 | 2.0 | 1695 | $2,450 | $1.45 | 23d | 1 | 0.61mi |
| 419 NW 7th Ter Cape Coral, FL | 3.0 | 2.0 | 1161 | $4,500 | $3.88 | 3d | 1 | 0.63mi |
| 910 NW 8th Ter Cape Coral, FL | 3.0 | 2.0 | 1619 | $2,100 | $1.30 | 16d | 1 | 0.64mi |
| 224 NW 2nd Pl Cape Coral, FL | 3.0 | 2.0 | 1733 | $2,750 | $1.59 | 23d | 1 | 0.64mi |
| 213 NW 5th St Cape Coral, FL | 4.0 | 2.0 | 1809 | $2,195 | $1.21 | 3d | 1 | 0.69mi |
| 526 NW 9th St Cape Coral, FL | 4.0 | 2.0 | 1800 | $2,100 | $1.17 | 3d | 1 | 0.71mi |
| 114 NW 13th Ave Cape Coral, FL | 3.0 | 2.0 | 1422 | $2,000 | $1.41 | 14d | 1 | 0.72mi |
| 318 NW 8th Ter Cape Coral, FL | 3.0 | 2.0 | 1500 | $1,900 | $1.27 | 3d | 1 | 0.75mi |
| 212 NW 1st St Cape Coral, FL | 3.0 | 2.0 | 1246 | $1,775 | $1.42 | 3d | 1 | 0.78mi |
| 204 NW 1st St Cape Coral, FL | 4.0 | 3.0 | 1826 | $2,300 | $1.26 | 3d | 1 | 0.80mi |
| 227 Tropicana Pkwy W Cape Coral, FL | 4.0 | 2.0 | 1833 | $1,995 | $1.09 | 2d | 1 | 0.85mi |
| 1214 SW Embers Ter Cape Coral, FL | 4.0 | 2.0 | 1828 | $1,900 | $1.04 | 23d | 1 | 0.86mi |
| 507 NW 1st Ave Cape Coral, FL | 4.0 | 2.0 | 1695 | $2,395 | $1.41 | 23d | 1 | 0.86mi |
| 701 SW Pine Island Rd Cape Coral, FL | 1.0–3.0 | 1.0–2.0 | 1138 | $1,794 | $1.58 | 1d | 11 | 0.87mi |
| 1501 NW 4th St Cape Coral, FL | 4.0 | 2.0 | 1809 | $3,800 | $2.10 | 3d | 1 | 0.94mi |
| 217 NW 9th St Cape Coral, FL | 3.0 | 2.0 | 1756 | $2,271 | $1.29 | 3d | 1 | 0.97mi |
| 1400 SW 1st Ter Cape Coral, FL | 3.0 | 2.0 | 1619 | $1,995 | $1.23 | 23d | 1 | 1.06mi |
| 639 NE Juanita Pl Cape Coral, FL | 3.0 | 2.0 | 1116 | $1,700 | $1.52 | 19d | 1 | 1.10mi |
| 305 NW 16th Pl Cape Coral, FL | 3.0 | 2.5 | 1446 | $2,095 | $1.45 | 3d | 1 | 1.11mi |
| 1120 NW 11th Pl Cape Coral, FL | 3.0 | 2.0 | 1528 | $1,816 | $1.19 | 14d | 1 | 1.15mi |
| 1143 NW 4th Pl Cape Coral, FL | 3.0 | 2.0 | 1399 | $1,750 | $1.25 | 3d | 1 | 1.16mi |
| 749 SW 5th Ter Cape Coral, FL | 3.0 | 2.0 | 1404 | $2,065 | $1.47 | 3d | 1 | 1.17mi |
| 713 SW 4th Ter Cape Coral, FL | 3.0 | 2.0 | 1756 | $2,085 | $1.19 | 2d | 1 | 1.19mi |
| 416 NW 17th Ave Cape Coral, FL | 3.0 | 2.0 | 1199 | $2,000 | $1.67 | 3d | 1 | 1.20mi |
| 1156 NW 5th Pl Cape Coral, FL | 3.0 | 2.0 | 1458 | $1,695 | $1.16 | 19d | 1 | 1.20mi |
| 149 Santa Barbara Blvd S Cape Coral, FL | 3.0 | 2.0 | 1250 | $1,520 | $1.22 | 23d | 1 | 1.21mi |
| 916 NW 15th Ave Cape Coral, FL | 3.0 | 2.0 | 1458 | $1,890 | $1.30 | 3d | 1 | 1.22mi |
| 134 SE 1st Ave Cape Coral, FL | 3.0 | 2.0 | 1680 | $2,331 | $1.39 | 3d | 1 | 1.25mi |
| 159 SE Santa Barbara Pl Cape Coral, FL | 3.0 | 2.0 | 1412 | $2,250 | $1.59 | 23d | 1 | 1.26mi |
| 271 SW 4th St Unit 271 Cape Coral, FL | 3.0 | 2.0 | 1259 | $2,000 | $1.59 | 23d | 1 | 1.26mi |
| 376 Penley Lake Cir Cape Coral, FL | 1.0–3.0 | 1.0–2.0 | 1195 | $2,874 | $2.40 | 1d | 87 | 1.27mi |
| 142 SE 1st Ave Cape Coral, FL | 3.0 | 2.0 | 1554 | $1,900 | $1.22 | 14d | 1 | 1.27mi |
| 1012 NW 15th Ave Cape Coral, FL | 3.0 | 2.0 | 1805 | $1,985 | $1.10 | 23d | 1 | 1.28mi |
| 411 NW 13th St Cape Coral, FL | 3.0 | 2.0 | 1408 | $2,035 | $1.45 | 3d | 1 | 1.30mi |
| 1113 NW 1st Ave Cape Coral, FL | 3.0 | 2.0 | 1286 | $1,626 | $1.26 | 3d | 1 | 1.31mi |
| 1140 NW 1st Ave Cape Coral, FL | 3.0 | 2.0 | 1452 | $1,850 | $1.27 | 14d | 1 | 1.38mi |
Listing history 28 events
-
2026-06-17days on market $366,880 Active 72 DOM
-
2026-06-16days on market $366,880 Active 71 DOM
-
2026-06-15days on market $366,880 Active 70 DOM
-
2026-06-13days on market $366,880 Active 68 DOM
-
2026-06-10days on market $366,880 Active 65 DOM
-
2026-06-09days on market $366,880 Active 64 DOM
-
2026-06-07days on market $366,880 Active 62 DOM
-
2026-06-03days on market $366,880 Active 58 DOM
-
2026-06-02days on market $366,880 Active 57 DOM
-
2026-06-01days on market $366,880 Active 56 DOM
-
2026-06-01days on market $366,880 Active 55 DOM
-
2026-04-07$366,880 Active 986-char remark
Show marketing remark (986 chars)
WELCOME TO YOUR NEW DR HORTON HOME!! This is our appealing one-story, open concept, 1499 sqft FREEPORT II Floorplan featuring impact glass, 4 bedrooms, 2 bathrooms, 2-car garage, concrete block construction. This home is on a beautiful lot located in Cape Coral WITH ALL ASSESSMENTS PAID. This home boasts Designer cabinets and quartz countertops in both the kitchen and baths. Experience the timeless beauty and durability of RevWood laminated wood floors featured throughout the home, modern flat stock trim and baseboards, all stainless kitchen appliances including refrigerator, paver driveways and lanai, irrigation system, and garage door openers. Be wowed by the INCLUDED "home-is-connected" package and our builder's warranty. This is why owning a brand-new home from America's largest builder is going to be your best option. These homes move quickly so don't miss out. Finishings may vary - images are representational only of the model home based in that community.
-
2026-04-06$366,880 Active
-
2026-01-30soldstatus $75,000
-
2015-11-13soldstatus $11,000
-
2015-11-09price $11,000 304-char remark
Show marketing remark (304 chars)
Desirable 80x125 homesite with eastern rear exposure in terrific area of North Cape Coral. Great location with easy access to schools, services, shopping, and main roads. In City of Cape Coral Utility Expansion zone N-2. Lot dimensions estimated per public record. * Bulk sale lot package also available.
-
2015-11-05soldstatus $11,000 Sold 304-char remark
Show marketing remark (304 chars)
Desirable 80x125 homesite with eastern rear exposure in terrific area of North Cape Coral. Great location with easy access to schools, services, shopping, and main roads. In City of Cape Coral Utility Expansion zone N-2. Lot dimensions estimated per public record. * Bulk sale lot package also available.
-
2015-11-03price $12,000 304-char remark
Show marketing remark (304 chars)
Desirable 80x125 homesite with eastern rear exposure in terrific area of North Cape Coral. Great location with easy access to schools, services, shopping, and main roads. In City of Cape Coral Utility Expansion zone N-2. Lot dimensions estimated per public record. * Bulk sale lot package also available.
-
2015-10-21status Pending 304-char remark
Show marketing remark (304 chars)
Desirable 80x125 homesite with eastern rear exposure in terrific area of North Cape Coral. Great location with easy access to schools, services, shopping, and main roads. In City of Cape Coral Utility Expansion zone N-2. Lot dimensions estimated per public record. * Bulk sale lot package also available.
-
2015-10-01$12,000 Active 304-char remark
Show marketing remark (304 chars)
Desirable 80x125 homesite with eastern rear exposure in terrific area of North Cape Coral. Great location with easy access to schools, services, shopping, and main roads. In City of Cape Coral Utility Expansion zone N-2. Lot dimensions estimated per public record. * Bulk sale lot package also available.
-
2015-09-16soldstatus $277,400
-
2015-04-01soldstatus $6,700
-
2015-03-31price $7,250
-
2015-03-26soldstatus $7,250 Sold
-
2015-03-26price $7,500
-
2015-03-04price $7,500
-
2015-03-02price $7,998
-
2015-02-20$7,999 Active
ⓘ Source: listings_history table (triggers on properties + properties_extension) + one-shot
backfill from property_details.listing_events for pre-trigger history.
Tax reassessment forecast FL · Resets to sale price
- Current annual tax
- $1,312 · $109/mo
- Projected year-2 tax
- $3,045 · $254/mo
- Expected delta
- +$1,733/yr (+$144/mo · 132.1%)
ⓘ Screening estimate from a state-policy table — verify with the county assessor before closing.
Nearby sold comps map
Loading sold comps map…
Walkable amenities ~0.75 mi
Loading nearby amenities…
Taxation est. · year 1
- Rental income
- $28,506
- − Mortgage interest
- −$20,551
- − Property taxes
- −$1,312
- − Insurance
- −$1,834
- − Repairs & maintenance
- −$2,281
- − Management
- −$2,281
- − Depreciation
- −$10,673
- Taxable loss
- −$10,425
- Est. tax savings @ 24.0%
- +$2,502
- After-tax cash flow
- $-1,212/yr
For passive investors: Depreciation is non-cash, so a rental often shows a tax loss while cash-flowing — sheltering income. Rental losses are passive: they offset passive income freely, and up to $25,000/yr can offset ordinary (W-2) income if you actively participate and your MAGI is under $100k (phasing out to $0 by $150k); unused losses carry forward. On sale, claimed depreciation is recaptured at up to 25%, and gains may owe capital-gains tax (a 1031 exchange can defer both). Figures are a year-1 estimate at your 24.0% rate — not tax advice; consult a CPA.
Schools (NCES district)
- District
- Lee
- NCES district ID
- 1201080
- Math proficiency
- 47% ▼ -11.00%
- Reading proficiency
- 50% ▼ -4.00%
- Median HH income
- $49,518
- Composite
- 41.49/100
- National rank
- #3458
- State rank
- #42 of 73 in FL
Livability — Cape Coral
- Score
- 77/100
- State rank
- #208
- US rank
- #3098
Category grades
Schools grade is shown separately in the Schools card above.
Census & demographics
- Census place
- Cape Coral, FL
- County
- Lee County · 788,662 people
- City population
- 217,388
- Metro
- Cape Coral-Fort Myers, FL
- Population (ZIP)
- 35,580
- Household income
- $90,577
- Rent vs Own
- Severe rent burden
- 286.0
Population outlook (Lee County) Hauer SSP2
- Today (2025)
- 871,946 people
- By 2030
- 955,468 · +9.6%
- By 2040
- 1,113,587 · +27.7%
- By 2050
- 1,256,891 · +44.1%
- By 2075
- 1,560,270 · +78.9%
- By 2100
- 1,726,848 · +98.0%
Race, ethnicity, and origin ACS 2023
- Neighborhood character
- Diverse neighborhood (Simpson 0.58)
- Race & ethnicity
- White 57% Hispanic / Latino 30% Two or more races 21% Black 7% Asian 2%
- Hispanic origin (detail)
- Mexican 2% Puerto Rican 6% Cuban 17% Dominican 1%
- Common ancestry
- Romanian 2% Hispanic 2% Lithuanian 2%
- Foreign-born
- 21% · Canada, Jamaica, China
- Languages at home
- 73% English-only · Spanish 24% French/Haitian/Cajun 1% Russian/Polish/Slavic 1%
Political lean MEDSL · Lee
- 2024 margin
- Strong R (+28.4) · D 35.5% · R 63.9%
- 2008→2024 swing
- -18.0pp toward R · 2008: -10.4pp · 2024: -28.4pp
- All cycles
- 2024: R+28.4 2020: R+19.2 2016: R+20.4 2012: R+16.6 2008: R+10.4
Not yet ingested
- Civics
- —
Market trends
- HPI YoY
- ▼ -55.34%
- Current HPI
- 337.0575
- Rent YoY
- ▼ -5.51%
- Metro
- Cape Coral-Fort Myers, FL
- State GDP YoY
- ▲ 3.28%
- F500 in state
- 36
Industry mix (Fortune 500 HQ in FL)
| Industry | F500 HQs | Revenue |
|---|---|---|
| Industrial Technology | 2 | $29B |
|
||
| Insurance | 2 | $17B |
|
||
| Retail | 1 | $60B |
|
||
| Technology Distribution | 1 | $58B |
|
||
| Homebuilding | 1 | $35B |
|
||
| Technology Manufacturing | 1 | $35B |
|
||
Price history
+4486.6% since first listed17 events — show timeline
- 2026-04-07 Listed $366,880 Zillow
- 2026-04-06 Listed $366,880 NAPLESMLS
- 2026-01-30 Sold (Public Records) $75,000 Public Records
- 2015-11-13 Sold (Public Records) $11,000 Public Records
- 2015-11-09 Price Changed $11,000 FORTMLS
- 2015-11-05 Sold (MLS) $11,000 FORTMLS
- 2015-11-03 Price Changed $12,000 FORTMLS
- 2015-10-21 Pending — FORTMLS
- 2015-10-01 Listed $12,000 FORTMLS
- 2015-09-16 Sold (Public Records) $277,400 Public Records
- 2015-04-01 Sold (Public Records) $6,700 Public Records
- 2015-03-31 Price Changed $7,250 FORTMLS
- 2015-03-26 Price Changed $7,500 FORTMLS
- 2015-03-26 Sold (MLS) $7,250 FORTMLS
- 2015-03-04 Price Changed $7,500 FORTMLS
- 2015-03-02 Price Changed $7,998 FORTMLS
- 2015-02-20 Listed $7,999 FORTMLS
Property tax history
+10.6%/yrLatest (2025): $1,312 · +210.2% YoY. Source: county tax records.
Cash-flow waterfall
monthlySold comps — $/sqft
last 12 mo · ≤1 miLoading sold comps…